
Sleeping Pods Market Size and Share
Market Overview
| Study Period | 2020 - 2031 |
|---|---|
| Market Size (2026) | USD 624.89 Million |
| Market Size (2031) | USD 880.95 Million |
| Growth Rate (2026 - 2031) | 7.11 % |
| Fastest Growing Market | Middle East and Africa |
| Largest Market | Asia-Pacific |
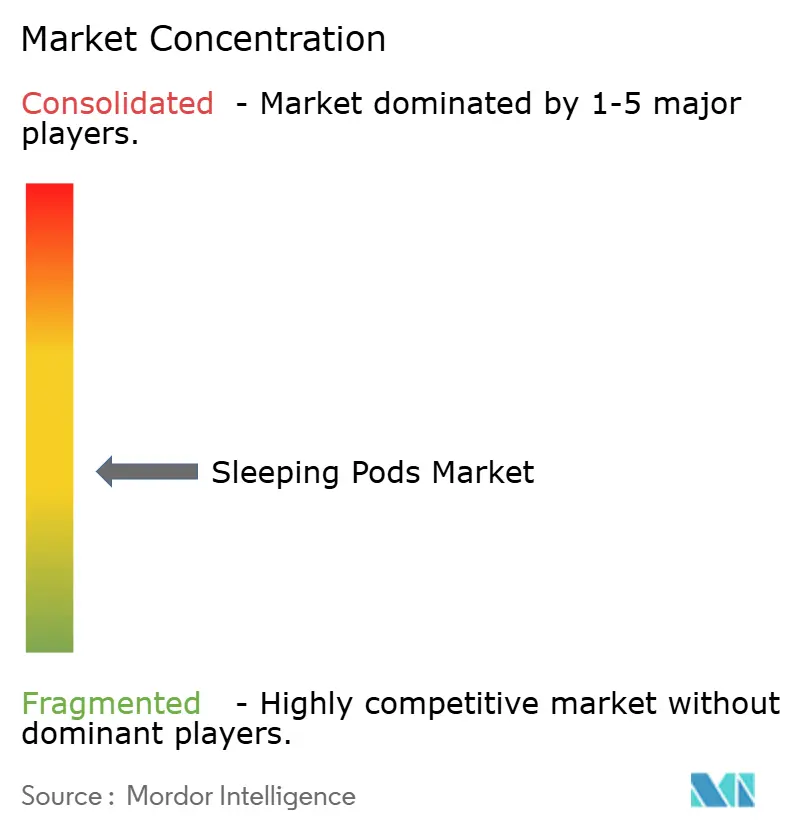
| Market Concentration | Medium |
Major Players *Disclaimer: Major Players sorted in no particular order Image © Mordor Intelligence. Reuse requires attribution under CC BY 4.0. | |
Sleeping Pods Market Analysis by Mordor Intelligence
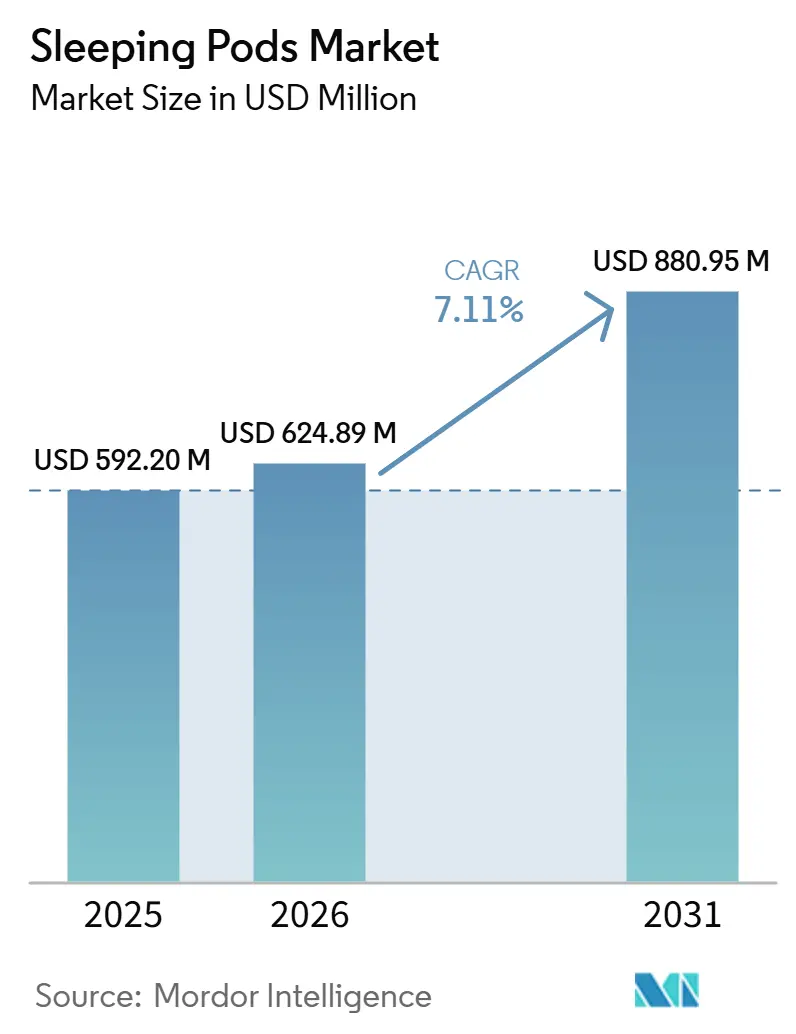
The sleeping pods market size was valued at USD 592.20 million in 2025 and estimated to grow from USD 624.89 million in 2026 to reach USD 880.95 million by 2031, at a CAGR of 7.11% during the forecast period (2026-2031). The faster forecast reflects a change in buyer behavior, as airport authorities and operators increasingly treat sleeping pods as revenue-generating infrastructure rather than minor passenger amenities. IATA stated that global passenger demand rose 5.3% in 2025, international RPKs increased 7.10%, and load factors reached a record 83.6%, which kept pressure high on remaining capacity inside transit hubs[1]. In Q1 2026, industry-wide passenger traffic reached 2.20 trillion RPKs, up 4.00% year over year, and IATA projects total passengers will reach 5.10 billion by the end of 2026, which supports ongoing demand across major installation points for the sleeping pods market. The sleeping pods market is also benefiting from airport expansion programs in Asia-Pacific and the Middle East, while offices, hospitals, and rail hubs are expanding the use base beyond airports alone. Even so, high capital intensity, varied code requirements, and hygiene sensitivity continue to shape project timing and vendor selection, favoring players with strong compliance records, established concession relationships, and digital operating capabilities.
Key Report Takeaways
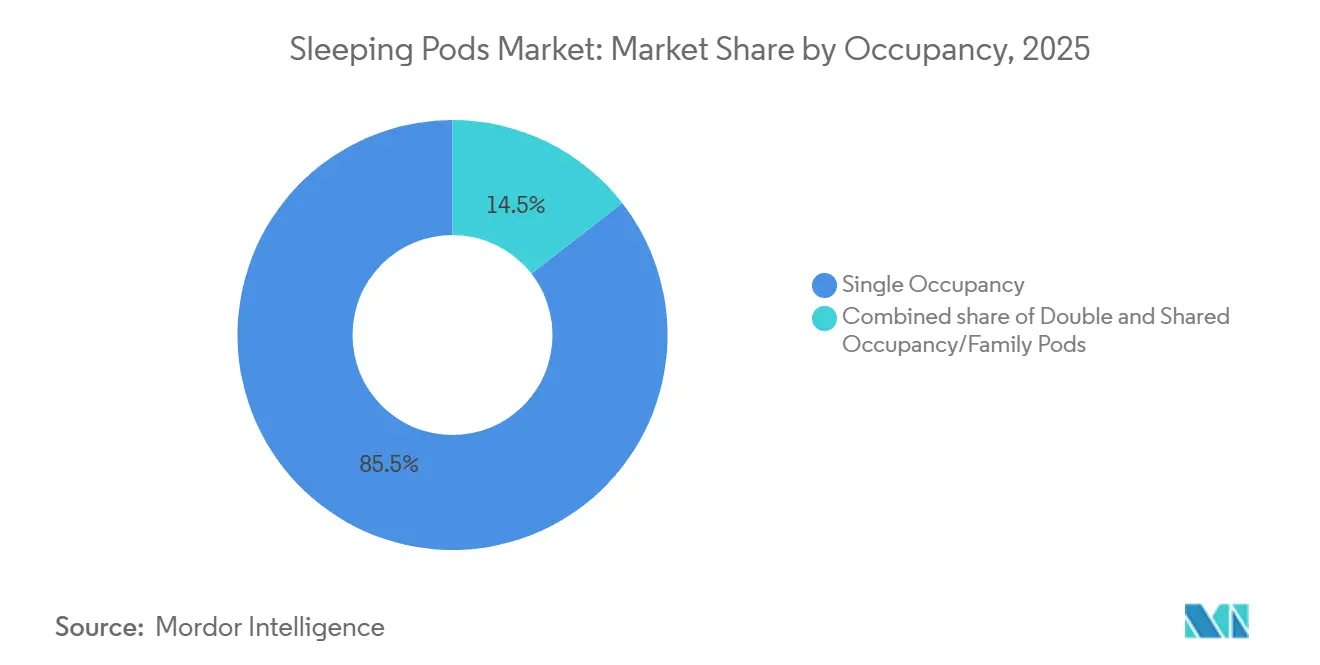
- By occupancy, single-occupancy pods held 85.52% of the sleeping pod market share in 2025, while double-occupancy pods recorded the highest projected CAGR at 8.51% through 2031.
- By application, airport sleeping pods accounted for 33.18% of the sleeping pods market size in 2025, while capsule hotel pods are advancing at a 9.13% CAGR through 2031.
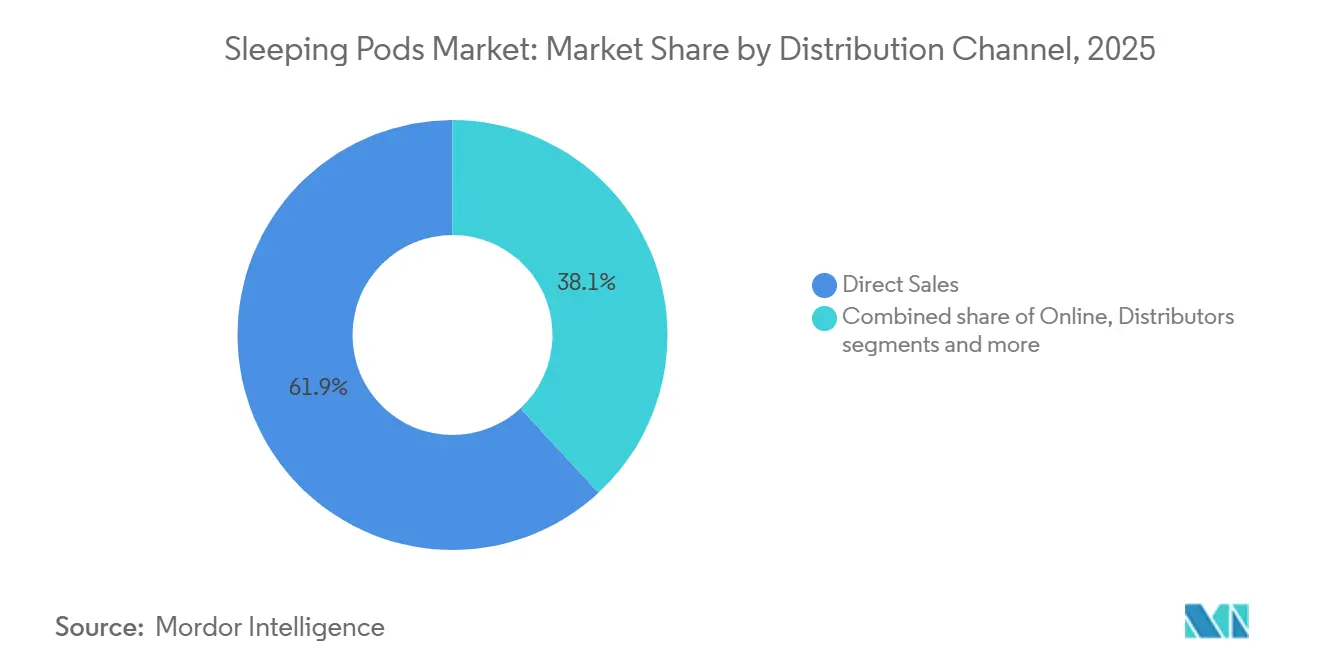
- By distribution channel, direct sales accounted for 61.89% of the sleeping pods market share in 2025, while distributors and dealers posted the fastest projected CAGR of 8.72% through 2031.
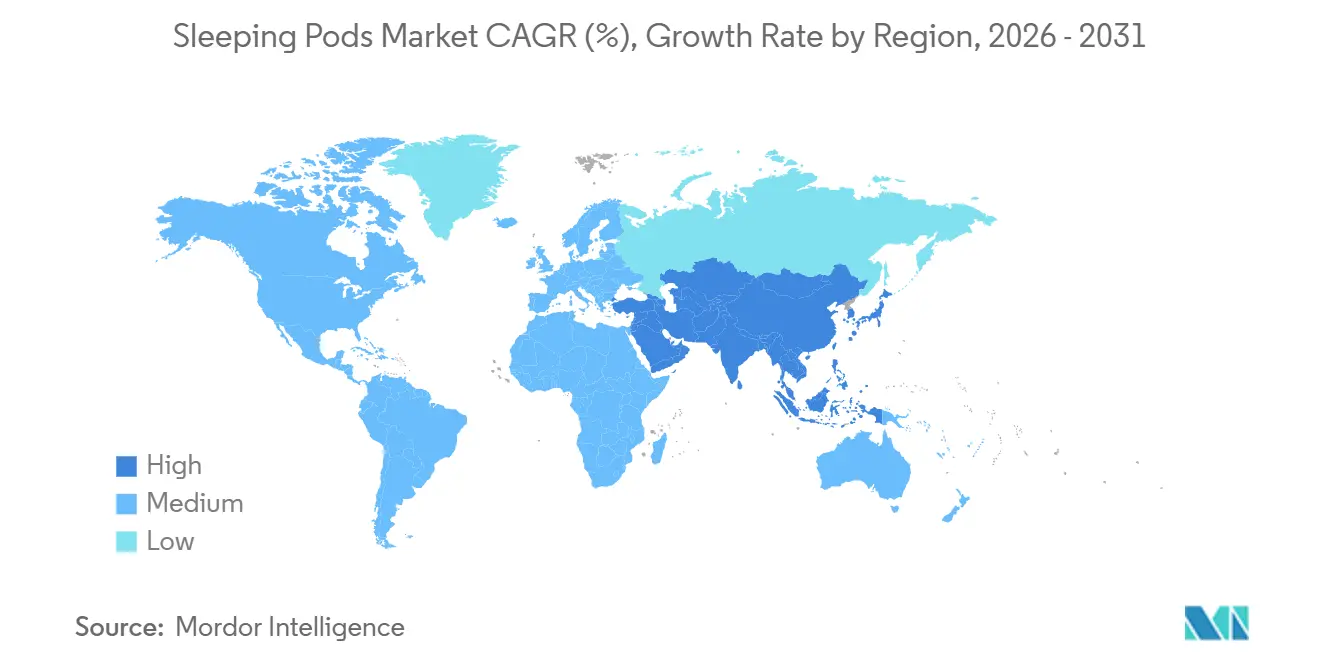
- By geography, Asia-Pacific accounted for 41.16% of the sleeping pods market in 2025, while the Middle East and Africa are forecast to expand at a 9.32% CAGR through 2031.
Note: Market size and forecast figures in this report are generated using Mordor Intelligence’s proprietary estimation framework, updated with the latest available data and insights as of January 2026.
Market Trends and Insights
Drivers Impact Analysis of Sleeping Pods Market*
| Driver | (~) % Impact on CAGR Forecast | Geographic Relevance | Impact Timeline |
|---|---|---|---|
| Rising Air Passenger Throughput and Layover Duration | +2.20% | Global, outsized effect in Asia-Pacific and Middle East & Africa | Short term (≤ 2 years) |
| Corporate Fatigue Management and Employee Recovery Programs | +1.30% | North America, Europe, Asia-Pacific urban centers | Medium term (2-4 years) |
| Space Monetization in Airports, Rail Hubs, and Shared Workplaces | +1.00% | Global, concentrated in hub airports across Europe and Middle East & Africa and Asia-Pacific | Medium term (2-4 years) |
| Shift Toward Subscription and Pay-Per-Use Revenue Models | +0.70% | North America, Europe, Japan | Medium term (2-4 years) |
| Wellness-Led Hospitality and Premium Transit Experience | +0.60% | Middle East and Africa, especially GCC hub airports, and Europe | Long term (≥ 4 years) |
| Smart Access, Occupancy Analytics, and Remote Operations | +0.50% | Global, led by Singapore, Germany, and the United Arab Emirates | Long term (≥ 4 years) |
| Source: Mordor Intelligence | |||
Rising Air Passenger Throughput and Layover Duration
The sleeping pods market is drawing direct support from stronger passenger throughput, as fuller aircraft and tighter onward connections increase the number of travelers who need short-duration rest within terminals. IATA confirmed that global passenger demand rose 5.3% in 2025, while international load factors reached 83.6%, leaving less flexibility in schedules and increasing layover strain for connecting passengers. Asia-Pacific airlines recorded 10.90% international traffic growth in 2025, and African carriers posted 9.40% growth, which matters because both regions handle long-haul and multi-stop itineraries where sleep and rest demand is stronger. IATA also stated in January 2026 that the Asia-Pacific region will maintain its dominant share of global RPKs through 2050, with outbound RPKs projected to grow 2.70 times from 2024 levels, which keeps the long-term demand runway centered on that corridor for the sleeping pods market[2]. Airlines are also keeping load factors high while fleet shortages and delivery delays continue, so the same operating pressure that disrupts travel flow is also strengthening the need for structured rest infrastructure in the sleeping pods market.
Corporate Fatigue Management and Employee Recovery Programs
The sleeping pods market is also gaining support from employers and health systems, which now view fatigue as a performance and risk issue rather than solely a comfort issue. A 2024 review published in the Journal of Business Research found that workplace napping reduces cognitive fatigue and improves work engagement. It explicitly recommended dedicated napping zones as part of a formal HR strategy. This has practical relevance for hospitals, corporate campuses, manufacturing sites, and emergency services where alertness directly affects work quality and safety. Framery reported in its 2025 annual report that its core smart office pod markets are projected to grow at 12% CAGR between 2024 and 2030, which signals stable investment appetite for enclosed rest and focus infrastructure around the sleeping pods market[3]. The shift also broadens the addressable base because demand is no longer limited to tech offices or premium airport lounges, and it increasingly includes settings where workers operate in shifts and need scheduled recovery periods.
Space Monetization in Airports, Rail Hubs, and Shared Workplaces
The sleeping pods market benefits when airports and other space owners seek ways to improve yield from limited floor space without building a full hotel inventory. Royal Schiphol Group confirmed a USD 6.86 billion capital program in January 2025, and that plan explicitly included sleeping-pod zones in terminal renovation budgets. Abu Dhabi’s Midfield Terminal and Singapore Changi Terminal 5 each earmarked more than USD 15 million for integrated layover sleeping solutions, which shows that pods have moved into planned capital line items rather than small experimental programs. This matters because the sleeping pods market can convert underused terminal, station, and workplace zones into bookable rest spaces without the build-out complexity of traditional lodging formats. It also creates space for earlier installations at secondary airports and rail hubs, where passenger dwell time is rising. Still, nearby hotel infrastructure remains limited, supporting the next layer of adoption in the sleeping pods market.
Shift Toward Subscription and Pay-Per-Use Revenue Models
The sleeping pods market is also becoming easier to scale because access is increasingly being packaged through recurring models rather than only one-time hourly transactions. Tokyu Corporation launched TsugiTsugi with Stripe, allowing customers to book 2 to 30 nights per month across more than 140 properties. That approach provides a practical template for pod operators that want steadier demand[4]. Subscription access can also be linked to airline loyalty programs, premium lounge entitlements, and corporate travel arrangements, reducing occupancy volatility and improving planning confidence for site owners. Pay-per-use access remains central to the sleeping pods market because it suits short transit stays. Still, recurring usage models make the commercial relationship more predictable for both operators and concession partners. As these structures spread, the sleeping pods market is likely to see greater contracted-occupancy management and broader platform integration across travel and workplace ecosystems.
Restraints Impact Analysis of Sleeping Pods Market*
| Restraint | (~) % Impact on CAGR Forecast | Geographic Relevance | Impact Timeline |
|---|---|---|---|
| High Capex Per Installable Unit and Long Payback Cycles | -1.80% | Global, most acute in North America and Europe | Short term (≤ 2 years) |
| Fire Safety, Building Code, and Aviation Compliance Burden | -0.80% | North America, Europe, select Asia-Pacific markets | Medium term (2-4 years) |
| Hygiene Perception and Cleaning-Protocol Sensitivity | -0.60% | Global, most pronounced in South and Southeast Asia | Short term (≤ 2 years) |
| Competing Use of Premium Terminal and Office Floor Space | -0.50% | Global, the highest in premium hub airports | Long term (≥ 4 years) |
| Source: Mordor Intelligence | |||
High Capex Per Installable Unit and Long Payback Cycles
High upfront investment remains one of the clearest barriers to faster expansion in the sleeping pods market. The user-supplied draft states that multi-module deployments at major Asia-Pacific airports typically require an initial investment of USD 4.10 million (CNY 30.00 million), and payback can extend beyond 4 years when traffic patterns fluctuate. This cost structure restricts entry to firms with stronger balance sheets or to operators that can secure revenue-sharing arrangements with airport authorities under concession frameworks. It also creates timing risk because airport construction schedules often move by 12 to 24 months, which can delay utilization after capital has already been committed. Modular pod designs are reducing this burden, but the sleeping pods market still competes with retail and food tenants, which usually offer faster visibility into cash flow and payback.
Fire Safety, Building Code, and Aviation Compliance Burden
The sleeping pods market also faces regulatory friction because pods do not fit neatly into a single building or operating category in many countries. The draft notes that this classification ambiguity can delay permits by 6 to 18 months, especially where authorities must decide whether pods should be regulated like hotel rooms, waiting areas, or retail units. In the United States, compliance with UL 962 has become a common threshold for airport concession approvals, which gives a clear edge to vendors with established certification histories. Framery’s Gradus line, designed for the United States and Canadian markets, meets IBC, IFC, and UL 962 requirements, demonstrating that compliance architecture is now part of product positioning in the sleeping pods market. Airside deployment rules also vary by country and airport authority, so the sleeping pods market continues to favor players that can move through approvals faster and more consistently than new entrants.
*Our forecasts treat driver/restraint impacts as directional, not additive. The impact forecasts reflect baseline growth, mix effects, and variable interactions.
Sleeping Pods Market Segment Analysis
By Occupancy:
Single Pods Anchor Revenue While Double Occupancy Paces the Growth CurveSingle Occupancy Pods commanded 85.52% of the sleeping pod market share in 2025, underscoring how strongly the installed base still reflects solo travel behavior and the need for private, lockable rest space. This lead also comes from space economics because single formats allow operators to install more units per square meter in airport and workplace settings where floor space is expensive. The format aligns with the most common use case in the sleeping pods market, since most transit passengers travel alone and most office and hospital users need individual rest space rather than shared arrangements. Single units also fit well with hourly booking models, which remain central to the revenue logic of many airport and transit installations in the sleeping pods market. At the same time, a heavy concentration in single formats imposes a natural limit on revenue per booking, as operators rely more on utilization and pricing discipline than on larger group ticket values.
Double Occupancy Pods are projected to expand at a 8.51% CAGR through 2031, making them the fastest-growing occupancy type in the sleeping pods market. Growth is being supported by family and couple travel, especially in the Asia-Pacific, and by leisure users who want to split costs during longer layovers. Shared Occupancy or Family Pods remain a smaller part of the sleeping pods industry because multi-user formats face more complex placement and operating conditions, especially in airside environments. The draft also notes that operators at Japan’s Narita Terminal pioneered female-only Double Occupancy corridors with partition systems, demonstrating how layout changes can broaden the addressable user base without altering the category’s core function. As pricing tools and occupancy analytics improve, operators may place greater emphasis on balancing density and ticket yield across both single- and double-format sleeping pods.

By Application:
Airport Pods Lead but Capsule Hotels Redefine Growth EconomicsAirport Sleeping Pods accounted for 33.18% of the sleeping pods market in 2025, confirming that airports remain the category’s largest commercial use case. This position is based on captive demand because passengers in terminals have few practical alternatives for private, short-duration rest after they pass through security. The airport segment also benefits from stronger digital integration as pod bookings increasingly connect with airline apps, loyalty platforms, and lounge access programs. This maintains high visibility for the sleeping pods market because airports remain the most recognized public setting where users encounter the product. It also explains why leading operators continue to focus heavily on concession relationships at major hubs even as demand spreads to other environments.
Capsule Hotel Pods are projected to grow at a 9.13% CAGR through 2031, which makes them the fastest-growing application in the sleeping pods market. Their growth logic differs from that of airport pods because they allow longer stays, attract both transit and non-transit users, and avoid many airside operating restrictions. Office Nap Pods are gaining traction as companies place more emphasis on workplace wellness, focus, and recovery infrastructure, expanding the use profile of the sleeping pod market beyond travel. Healthcare and Recovery Pods are also becoming more relevant as structured rest is increasingly linked with fatigue management in clinical settings and shift-based work environments. Railway and Transit Pods are emerging strongly in India through Naploo’s smart network, where pricing starts at INR 150 (USD 1.80) per hour, demonstrating how the sleeping pods market can also scale through mobile-first, low-friction booking in price-sensitive settings.
By Distribution Channel:
Direct Sales Dominate but Dealer Networks Unlock ScaleDirect Sales retained 61.89% of the sleeping pod market share in 2025, reflecting the contract-heavy nature of large pod installations across airports, offices, and institutions. Many buyers need customized layouts, electrical specifications, access controls, and design finishes, so direct engagement with manufacturers remains the most practical route for major projects. Framery’s direct-to-specifier model for the Gradus line shows how suppliers work directly with architects, consultants, and facilities managers when code compliance and project coordination are central to the sale. This structure still suits the sleeping pods market because many installations are site-specific and require closer coordination than standard furniture or equipment procurement. It also helps manufacturers protect service standards and maintain greater control over pricing, installation, and after-sales support.
Distributors and Dealers are projected to expand at a 8.72% CAGR through 2031, indicating a wider venue mix and a broader buyer base for the sleeping pods market. This channel becomes more relevant when adoption spreads into mid-scale airports, hospitals, universities, and secondary transit hubs that already procure through established vendor networks. System Integrators and Project Contractors are also gaining weight because pod areas are often included inside larger terminal upgrade and workplace renovation packages. Online channels remain smaller, but they are helping modular designs reach smaller offices and coworking spaces where standardized products can be delivered more easily. As the sleeping pods industry continues to diversify its end-use base, channel growth is likely to become less concentrated around bespoke direct deals and more linked to institutional procurement ecosystems.
Geography Analysis
APAC Sleeping Pods Market
Asia-Pacific accounted for 41.16% of the sleeping pods market in 2025, maintaining its lead over all other regions. Japan remains central to this position because it established the capsule hotel model early and continues to serve as a reference for newer rollouts in the sleeping pods market. China is strengthening that regional lead through visible airport deployments, with Shanghai Pudong Airport commissioning its first 13 sleeping pods in July 2025 and planning a full rollout to 30 units by the end of that month. The Shanghai units were priced at CNY 35.00 (USD 4.80) per 30 minutes, and the airport recorded 40 daily orders with average usage of 0.50 to 1.00 hours per booking. Ningbo Airport added 19 capsule pods in June 2026 with WeChat and Alipay scan-to-unlock access, priced at CNY 55.00 for 2 hours (USD 7.60), indicating that adoption is spreading beyond the largest hubs.
India and Singapore Sleeping Pods Market
India is also becoming an important part of the sleeping pods market, as Naploo operates the country’s first smart sleeping pod network across airports and railway stations, with mobile-led access and pay-per-hour pricing. That model matters because it adapts the product to price-sensitive demand rather than relying solely on premium-lounge or international-hub economics. Regional air traffic conditions remain supportive, with Asia-Pacific airlines posting the strongest international growth among major airline groups in 2025, which sustains a large demand base for the sleeping pods market. Southeast Asia also stands out, and Singapore has already earmarked more than USD 15.00 million for the integration of sleeping pods at Changi Terminal 5, suggesting a strong next wave of installations in the region.
EMEA and South America Sleeping Pods Market
The Middle East and Africa are projected to grow at a 9.32% CAGR through 2031, making it the fastest-growing regional segment in the sleeping pods market. The Middle East alone requires USD 151.00 billion in airport capacity investment by 2040, and the USD 35.00 billion Al Maktoum expansion in Dubai, along with the USD 50.00 billion King Salman International Airport in Riyadh, is setting up large future transit volumes that support the rest of the infrastructure demand. Riyadh Air’s Hafawa Lounge opened in March 2026 with private sleeping pods across a 2,000-square-meter space, placing pod infrastructure at the premium end of the passenger journey rather than at its edge. Europe and North America remain more established and generate higher per-unit value under tighter compliance frameworks, while South America is still in earlier stages of development because traffic growth is improving faster than supporting infrastructure in many locations for the sleeping pods market.
Competitive Landscape
The sleeping pods market is moderately fragmented, with the top 5 operators, GoSleep, YOTELAir, NapCabs, Minute Suites, and Sleep 'n Fly, collectively holding nearly half of global revenue in 2025. The revenue balance is spread across regional operators, design-build firms, and workplace pod specialists, reflecting a market that still has room for local and niche participation. The leading group benefits from airport concession experience, brand visibility, and operational maturity, while smaller players often focus on offices, hospitals, rail stations, and secondary airports. GoSleep reinforced that advantage in June 2025 through its expanded partnership with XWELL at Amsterdam Schiphol’s D-Pier, where pod capacity was doubled and folded into a broader premium wellness setting. NapCabs also demonstrated the value of disciplined site selection, with user-supplied draft reports showing average occupancy rates of 71.40% at the Munich and Berlin deployments.
YOTEL pursued a different route in 2025 through an exclusive franchise agreement with Hilton, bringing 23 properties across 10 countries into Hilton’s global distribution network and widening reach through loyalty-linked visibility rather than solely through airport concession growth. That move matters because it shows how the sleeping pods market can also compete through network access and booking scale rather than hardware alone. Technology is becoming increasingly central, as occupancy data, sensor integration, and mobile access are helping vendors move from static installations to more actively managed assets. Compliance remains another differentiator because vendors with recognized standards histories can move through approvals faster, especially in airports and regulated workplace settings.
Open space remains across healthcare, education, and secondary transit settings, where no single specialist has achieved dominant scale in the sleeping pods market. That leaves room for mid-scale operators to secure first-mover positions in locations that are too small for global leaders but still large enough to support repeat demand. India is especially relevant because ongoing airport development creates one of the largest greenfield opportunity pools for the sleeping pods market over the next decade. Operators that can localize manufacturing, adapt pricing, and meet concession economics are likely to be better placed than those that rely only on imported premium pod formats.
Sleeping Pods Industry Leaders
-
GoSleep Oy
-
MetroNaps, Inc.
-
NapCabs GmbH
-
Sleepbox, Inc.
-
Minute Suites, LLC
- *Disclaimer: Major Players sorted in no particular order
Sleeping Pods Market Companies Covered in this Report
- GoSleep Oy
- MetroNaps, Inc.
- NapCabs GmbH
- Sleepbox, Inc.
- Minute Suites, LLC
- YOTEL Limited
- Restworks
- Podtime
- 9 Hours Co., Ltd.
- ZZZleepandGo S.r.l.
- Kotobuki Seating Co., Ltd.
- Haworth, Inc.
- Framery Oy
- Silence Business Solutions GmbH
- Nap York
- HOHM
- POD-ZONE
- B&H Ergonomics
- Sleep Capsule Co.
- Sleeppod Factory
Recent Industry Developments in Sleeping Pods Market
- June 2026: Ningbo Airport in China launched 19 capsule sleeping pods distributed across five locations in the T1 and T2 terminals. These pods use a WeChat or Alipay scan-to-unlock system, with pricing starting at CNY 55 for 2 hours (approximately USD 7.85). Each pod includes a new-air ventilation system, four ambient lighting modes, and a mandatory disinfection protocol for each occupant. This development reflects the increasing adoption of such amenities in tier-2 airports in China.
- May 2026: At NeoCon in Chicago, Framery Oy introduced the Gradus smart office pod line designed for the United States and Canadian markets. The three models (Focus, Work, Huddle) are produced at Framery's newly established facility in Michigan and comply with IBC, IFC, and UL 962 standards. These pods include occupancy sensors and anonymized floor-plan analytics that integrate with building management systems. This launch represents Framery's first product line developed specifically for North America and its first manufacturing output assembled in the United States.
- April 2026: Framery decided to begin manufacturing in the United States at its Zeeland, Michigan logistics center, with operations expected to start in the second half of 2026. The investment is estimated to be below USD 1.17 million (EUR 1 million), supported by a 7-year partnership with a local operating partner. This approach reduces exposure to import tariffs and supply chain disruptions.
- March 2026: Riyadh Air opened the Hafawa Lounge at King Khalid International Airport. The lounge spans 21,500 m2 and was designed by Yabu Pushelberg. It accommodates 370 Business Elite and Business Class guests and includes private sleeping pods and spa-like washrooms. This initiative aligns with Saudi Arabia's Vision 2030 goals and establishes sleeping pod infrastructure as a standard amenity in airline lounges across the Gulf Cooperation Council region.
Global Sleeping Pods Market Report Scope
Segmentation Overview
| Single Occupancy Pods |
| Double Occupancy Pods |
| Shared Occupancy/Family Pods |
| Capsule Hotel Pods |
| Airport Sleeping Pods |
| Office Nap Pods |
| Healthcare & Recovery Pods |
| Educational Institution Pods |
| Railway & Transit Pods |
| Other Applications (wellness & meditation pods, military & institutional pods, etc.) |
| Direct Sales |
| Distributors and Dealers |
| System Integrators / Project Contractors |
| Online |
| North America | Canada |
| United States | |
| Mexico | |
| South America | Brazil |
| Peru | |
| Chile | |
| Argentina | |
| Rest of South America | |
| Europe | United Kingdom |
| Germany | |
| France | |
| Spain | |
| Italy | |
| BENELUX (Belgium, Netherlands, and Luxembourg) | |
| NORDICS (Denmark, Finland, Iceland, Norway, and Sweden) | |
| Rest of Europe | |
| Asia-Pacific | India |
| China | |
| Japan | |
| Australia | |
| South Korea | |
| South East Asia (Singapore, Malaysia, Thailand, Indonesia, Vietnam, and the Philippines) | |
| Rest of Asia-Pacific | |
| Middle East and Africa | United Arab Emirates |
| Saudi Arabia | |
| South Africa | |
| Nigeria | |
| Rest of the Middle East and Africa |
| By Occupancy | Single Occupancy Pods | |
| Double Occupancy Pods | ||
| Shared Occupancy/Family Pods | ||
| By Application | Capsule Hotel Pods | |
| Airport Sleeping Pods | ||
| Office Nap Pods | ||
| Healthcare & Recovery Pods | ||
| Educational Institution Pods | ||
| Railway & Transit Pods | ||
| Other Applications (wellness & meditation pods, military & institutional pods, etc.) | ||
| By Distribution Channel | Direct Sales | |
| Distributors and Dealers | ||
| System Integrators / Project Contractors | ||
| Online | ||
| By Geography | North America | Canada |
| United States | ||
| Mexico | ||
| South America | Brazil | |
| Peru | ||
| Chile | ||
| Argentina | ||
| Rest of South America | ||
| Europe | United Kingdom | |
| Germany | ||
| France | ||
| Spain | ||
| Italy | ||
| BENELUX (Belgium, Netherlands, and Luxembourg) | ||
| NORDICS (Denmark, Finland, Iceland, Norway, and Sweden) | ||
| Rest of Europe | ||
| Asia-Pacific | India | |
| China | ||
| Japan | ||
| Australia | ||
| South Korea | ||
| South East Asia (Singapore, Malaysia, Thailand, Indonesia, Vietnam, and the Philippines) | ||
| Rest of Asia-Pacific | ||
| Middle East and Africa | United Arab Emirates | |
| Saudi Arabia | ||
| South Africa | ||
| Nigeria | ||
| Rest of the Middle East and Africa | ||
Key Questions Answered in the Report
What is the current outlook for sleeping pods through 2031?
The sleeping pods market is estimated at USD 624.89 million in 2026. It is forecast to reach USD 880.95 million by 2031 at a 7.11% CAGR, supported by airport expansion, rising passenger traffic, and wider adoption in offices and healthcare settings.
Which region leads global demand for sleeping pods?
Asia-Pacific led with 41.16% share in 2025, supported by Japan's mature capsule ecosystem, visible airport deployments in China, and early network expansion in India.
Which application is expanding the fastest?
Capsule Hotel Pods are forecast to grow at a 9.13% CAGR through 2031 because they allow longer dwell times, serve transit and non-transit users, and face fewer airside restrictions than airport-only installations.
Why are airports investing more in sleeping pods?
Airports are using pods to improve passenger comfort and create higher-yield use of limited floor space, especially as traffic rises and layovers remain a strain point in major hubs.
What is the biggest barrier for operators entering this space?
High upfront capex remains the main barrier, with major Asia-Pacific multi-module deployments often requiring USD 4.10 million (CNY 30.00 million), and payback periods that can extend beyond 4 years.
Which companies are shaping competition in this category?
GoSleep, YOTELAir, NapCabs, Minute Suites, and Sleep 'n Fly formed the leading group in 2025, while players such as Framery are widening the category through code-compliant, sensor-enabled pod offerings.