Airport Sleeping Pods Market Size and Share
Market Overview
| Study Period | 2020 - 2031 |
|---|---|
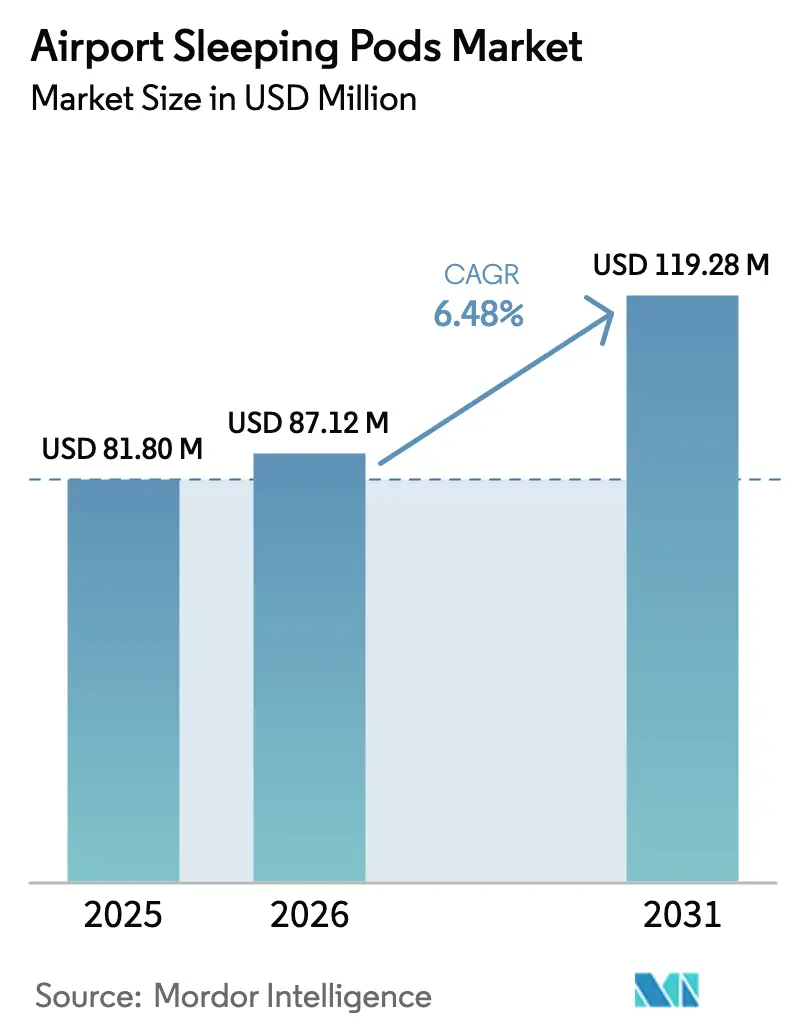
| Market Size (2026) | USD 87.12 Million |
| Market Size (2031) | USD 119.28 Million |
| Growth Rate (2026 - 2031) | 6.48% CAGR |
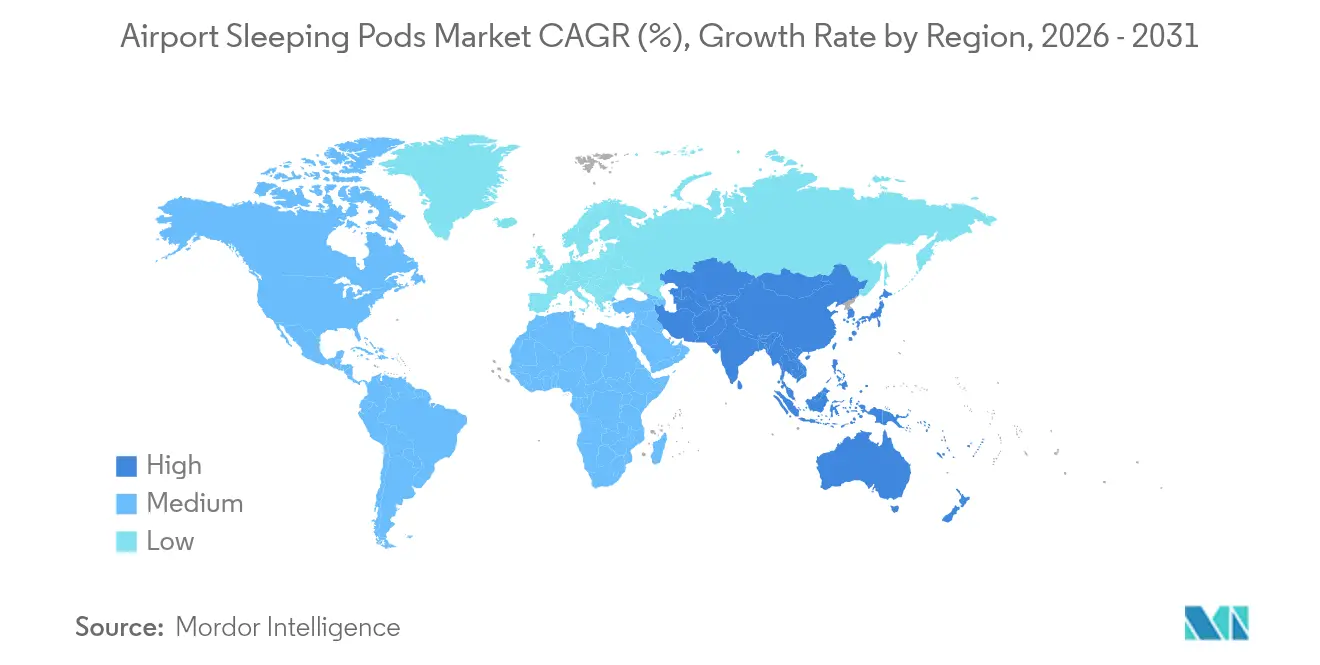
| Fastest Growing Market | Asia Pacific |
| Largest Market | North America |
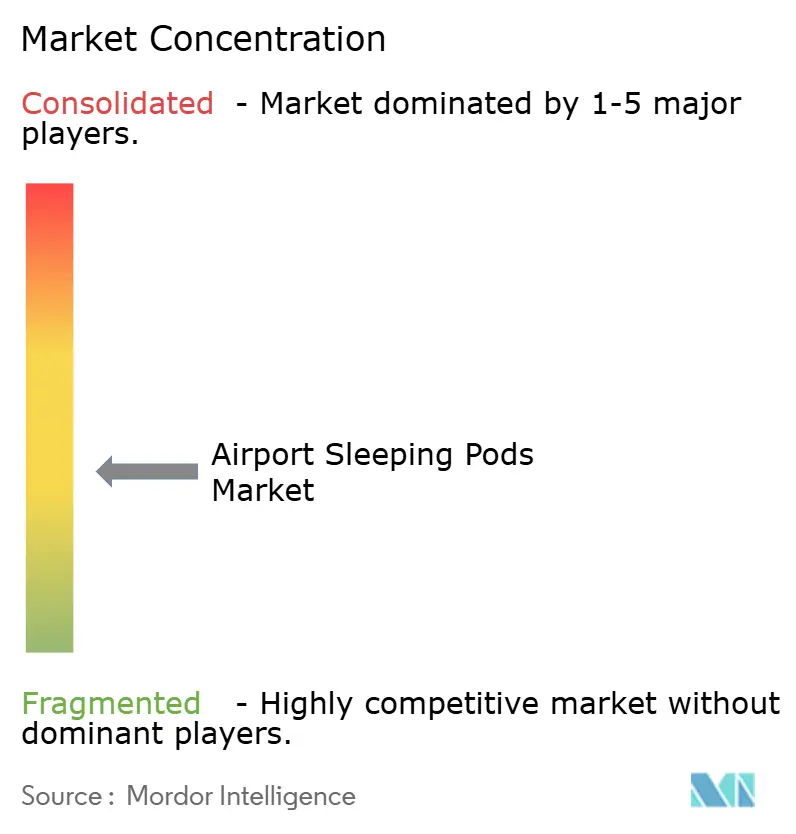
| Market Concentration | Medium |
Major Players *Disclaimer: Major Players sorted in no particular order Image © Mordor Intelligence. Reuse requires attribution under CC BY 4.0. | |
Airport Sleeping Pods Market Analysis by Mordor Intelligence
The airport sleeping pods market size was valued at USD 81.80 million in 2025 and estimated to grow from USD 87.12 million in 2026 to reach USD 119.28 million by 2031, at a CAGR of 6.48% during the forecast period (2026-2031). This steady rise underscores the transition of sleeping pods from a niche amenity to a core part of airport passenger-experience strategies, supported by airports’ pivot toward non-aeronautical revenue streams that account for roughly 40% of total airport income. Generational shifts are amplifying demand as younger flyers funnel 25% of discretionary terminal spending into experiential products such as sleep suites, well above their outlay on traditional retail. International hubs dominate unit deployments, but domestic facilities adopt pods faster as hub-and-spoke networks intensify connection times. Digital infrastructure—biometric access, IoT occupancy monitoring, and mobile booking—elevates utilization and supports dynamic pricing models. Meanwhile, rising health consciousness sustains passenger willingness to pay premiums for private, hygienic rest spaces certified to UL 962 standards.
Key Report Takeaways
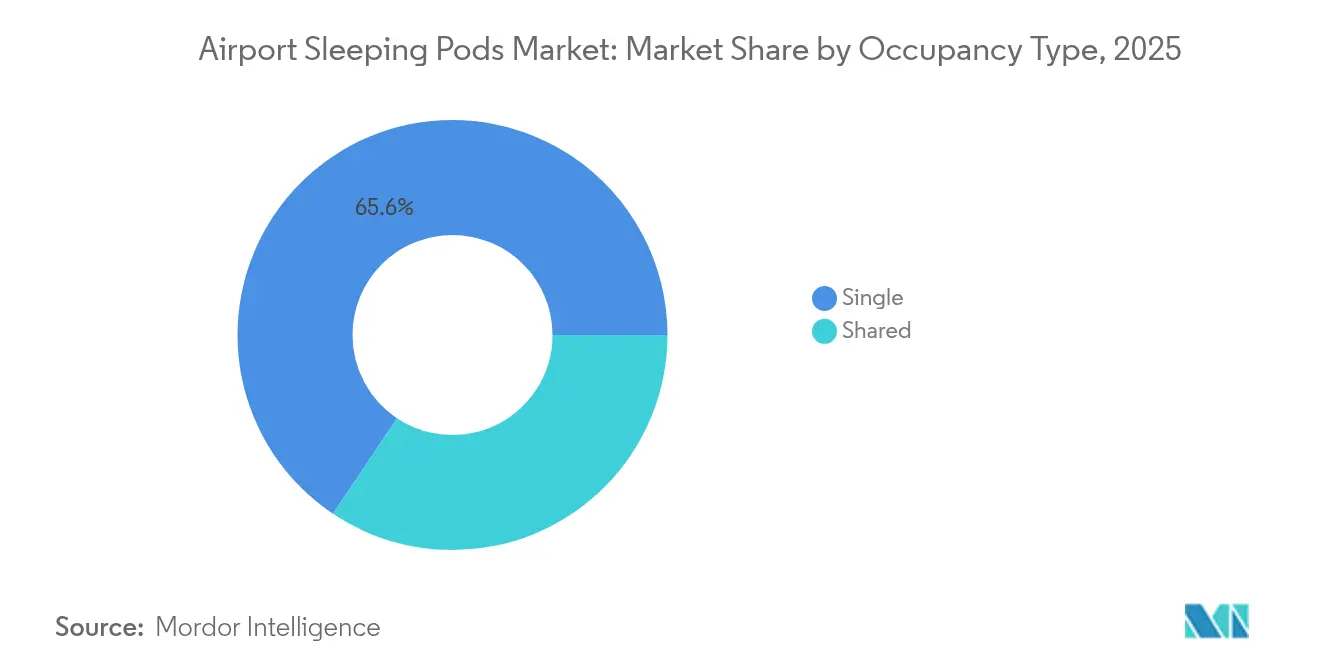
- By occupancy type, single pods led with 65.62% of the airport sleeping pods market share in 2025, while shared pods are slated to climb at an 8.62% CAGR through 2031.
- By stay duration, standard stays (2 to 6 hours) accounted for 49.78% of the airport sleeping pods market size in 2025; overnight stays (beyond 6 hours) are projected to expand at a 7.79% CAGR to 2031.
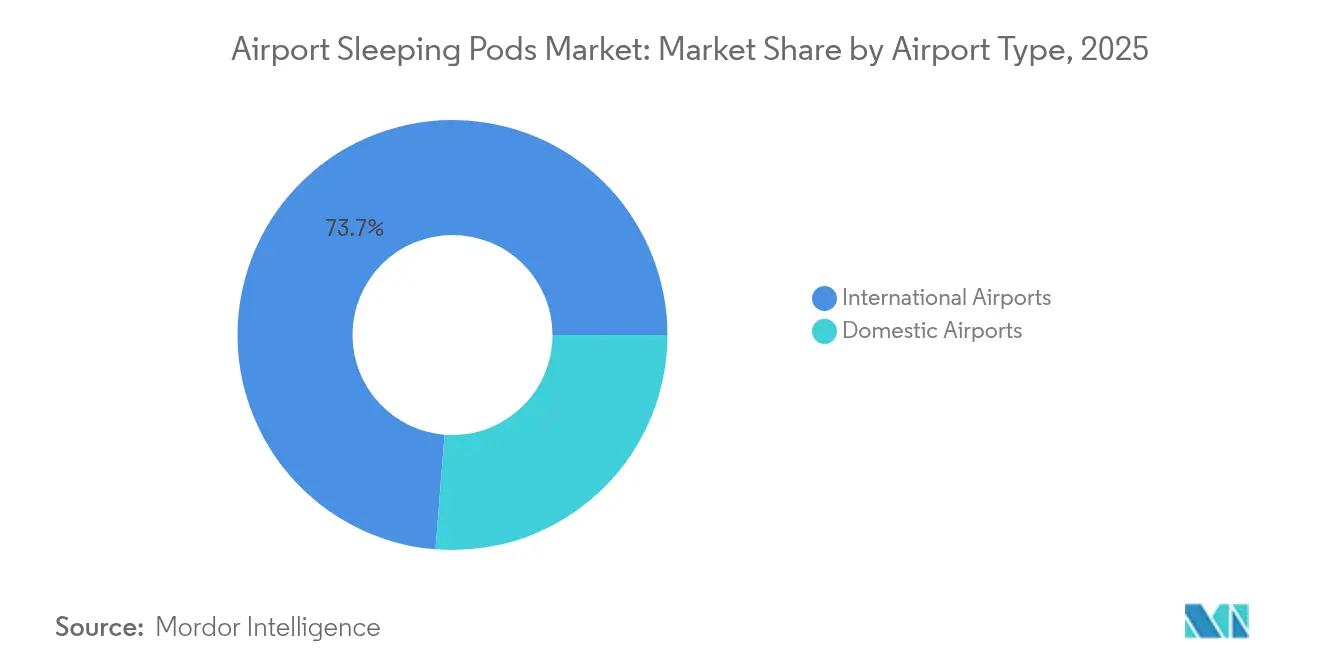
- By airport type, international hubs held 73.74% revenue share in 2025, but domestic airports recorded the highest forecast CAGR at 8.01% through 2031.
- By ownership model, franchise/concession operations captured 51.85% of installations in 2025, whereas third-party-managed concepts are growing at 8.47% CAGR.
- By geography, North America led the airport sleeping pods market, with a 37.92% share in 2025, while Asia-Pacific is growing at an 8.69% CAGR to 2031.
Note: Market size and forecast figures in this report are generated using Mordor Intelligence’s proprietary estimation framework, updated with the latest available data and insights as of 2026.
Global Airport Sleeping Pods Market Trends and Insights
Drivers Impact Analysis*
| Driver | (~) % Impact on CAGR Forecast | Geographic Relevance | Impact Timeline |
|---|---|---|---|
| Rising global passenger volumes and longer average layover times | +1.2% | Global hub airports | Medium term (2-4 years) |
| Growth of Gen Z and Millennial long-haul travel preferring experiential micro-accommodation | +1.8% | Asia-Pacific core, spill-over to North America and Europe | Long term (≥ 4 years) |
| Roll-out of smart-airport infrastructure (IoT, mobile access, biometrics) | +0.9% | North America and EU lead, Asia-Pacific following | Medium term (2-4 years) |
| Airline and travel-tech partnerships bundling “sleep time” | +0.7% | Global, early adoption by premium carriers | Short term (≤ 2 years) |
| Airports’ pivot to non-aeronautical revenue streams | +1.1% | Global, especially space-constrained European hubs | Medium term (2-4 years) |
| Post-pandemic preference for private, hygienic rest spaces | +0.8% | Global, sustained effect in high-density regions | Short term (≤ 2 years) |
| Source: Mordor Intelligence | |||
Rising Global Passenger Volumes and Longer Average Layover Times
Hub airports are recording average layover extensions of 45–90 minutes as security processing and slot limitations tighten schedules. Those added dwell windows enable sleep-pod operators to generate higher revenue per square meter than many retail concepts. As airlines concentrate long-haul flows into fewer banks, demand spikes align with pod availability, prompting terminal redesigns that position pods near under-utilized gate clusters. Airports in the Middle East, Asia, and North America increasingly view pods as anchor tenants in “dwell-time monetization” zones that also improve passenger satisfaction.
Growth of Gen Z and Millennial Long-Haul Travel Preferring Experiential Micro-Accommodation
More than 70% of flyers under 35 show strong interest in sleep pods versus 40% for conventional shopping offers, marking a structural redirect of on-premise spending.[1]Airport Dimensions, “Perfecting the Airport Offering for Younger Travellers,” airportdimensions.com Experiential allocations already average 11% of total discretionary outlays for these cohorts, and Asia-Pacific business-travel surveys register a willingness to pay premiums that secure productivity during transits. Airlines are reinforcing the trend - Air New Zealand’s economy-class bunk concept mirrors the expectation that rest options exist across the journey. Because these travelers wield high lifetime value and social-media influence, airports integrating pods benefit from amplified digital word-of-mouth.
Roll-out of Smart-Airport Infrastructure (IoT, Mobile Access, Biometrics)
Biometric locks and QR-code doors curb staffing needs while tightening security—trials at Hartsfield-Jackson Atlanta illustrate how passenger validation can be coupled to automated billing. IoT sensors deliver real-time occupancy dashboards that feed dynamic pricing engines, letting concession operators flex rates as surrounding gates empty or fill. The Federal Aviation Administration (FAA) earmarked USD 43.4 million in its FY 2025 research agenda for airport-technology pilots, including resting-pod upgrades.[2]Federal Aviation Administration, “FY 2025 Budget Request,” transportation.gov Predictive maintenance analytics and energy-management systems lower operating costs, enhancing ROI for both airport-run and third-party models.
Airline and Travel-Tech Partnerships Bundling “Sleep Time”
Priority Pass has begun offering pod access in bundles at airports such as New York LaGuardia, integrating the service into loyalty ecosystems that streamline customer acquisition and payment. Full-service Asian carriers are embedding rest hours within premium-economy tickets to counter low-cost competitors on trans-Pacific routes. Digital platforms enable seat-plus-sleep packaging, encouraging cross-sell and ancillary-revenue sharing between airlines and pod providers, especially in airports with multiple operating terminals.
Restraints Impact Analysis*
| Restraint | (~) % Impact on CAGR Forecast | Geographic Relevance | Impact Timeline |
|---|---|---|---|
| High Capex per m² versus retail alternatives limiting footprint in space-constrained terminals | −1.4% | Europe and mature North American hubs | Medium term (2-4 years) |
| Competition from on-airport micro-hotels and airline lounges | −0.8% | Global, particularly premium airport segments | Long term (≥ 4 years) |
| Legacy terminal space constraints | −1.0% | Mature European and North American hubs; select Asia-Pacific megahubs | Medium term (2-4 years) |
| Strict aviation security, fire-safety and building-code compliance | −0.6% | Global, with the most stringent requirements in US and EU airports | Short term (≤ 2 years) |
| Source: Mordor Intelligence | |||
High Capex per m² vs. Retail Alternatives Limiting Footprint in Space-Constrained Terminals
Sleeping pods demand dedicated ventilation, electrical, and security integrations that can elevate per-square-meter installation costs above USD 50,000 in retrofit environments. European airports are already short on leasable area; therefore, pods should be weighed against duty-free outlets offering guaranteed minimum rents. Modular pod designs and plug-and-play utility couplings are closing the cost gap, yet real-estate committees still require compelling density metrics before greenlighting deployments in premium concourses.
Competition from On-Airport Micro-Hotels and Airline Lounges
Brands such as YOTELAir and expanding airline lounges feature showers, dining, and concierge services that siphon high-value customers from pods. For instance, the new Chase Sapphire lounges in Los Angeles plan quiet rooms tailored for naps, directly overlapping the sleeping-pod proposition. The overlap pressures pod operators to differentiate via frictionless digital access, shorter minimum-stay windows, and lower variable costs rather than head-to-head amenity battles.
*Our forecasts treat driver/restraint impacts as directional, not additive. The impact forecasts reflect baseline growth, mix effects, and variable interactions.
Segment Analysis
By Occupancy Type: Privacy Drives Premium Positioning
Single units secured 65.62% of the airport sleeping pods market in 2025 as business travelers prioritized exclusive space and hygiene assurance at Abu Dhabi International’s AED 45-per-hour suites. The airport sleeping pods market size for single units equated to roughly USD 53.7 million that year. Early post-pandemic sentiment and laptop-friendly work surfaces amplify willingness to pay, cementing individual capsules as the premium benchmark.
Shared configurations are advancing at an 8.62% CAGR through 2031, reflecting price-sensitive leisure traffic and families pursuing affordable respite. For example, operators in Japan’s Narita Terminal allocate female-only corridors to preserve privacy while improving density. These mixed-use formats expand the total addressable audience yet require stringent occupancy-mix algorithms to avoid over-booking or low-turnover drift. The segment’s airport sleeping pods market size is projected to almost double by 2031, diversifying revenue streams for facility managers.


By Stay Duration: Extended Sessions Drive Revenue Density
Standard stays spanning two to six hours dominated with a 49.78% market share in 2025, capturing predictable transfer windows that allow airports to rotate pods four or five times per day. Because cleaning can be batched between waves, operating margins remain attractive even at moderate hourly rates. Overnight bookings past six hours, while smaller in volume, expand at a 7.79% CAGR as flight disruptions and red-eye scheduling proliferate, especially across intercontinental routes from Europe to Asia-Pacific.
The longer-stay cohort materially lifts revenue per transaction: at Helsinki Airport, average receipts on overnight sessions exceed daytime naps by 60%. Airports accordingly experiment with bundled shower and locker add-ons to drive ancillary spend. Sub-2-hour “power naps” fill trough periods yet rarely exceed 15% of bookings, limiting their overall impact on the airport sleeping pods market.
By Airport Type: Hub Concentration Creates Scale Advantages
International gateways held a 73.74% stake in 2025, translating into roughly USD 60.3 million of the airport sleeping pods market size at hub terminals. Their larger passenger volumes, longer average dwell times, and higher discretionary spending underpin quicker concessionaire payback periods. Dubai, Doha, and Munich demonstrate kiosk-style pod clusters integrated into transit corridors to intercept transfer traffic.
Domestic nodes, especially within North America and China, log an 8.01% CAGR through 2031 as regional connection banks introduce layovers once uncommon for same-country journeys. Smaller airports leverage pods as visible symbols of passenger-experience upgrades, aiding airline marketing when route planners assess hub quality. Operators favor flexible-lease models to match uncertain traffic volumes during early deployment phases.
By Ownership Model: Third-Party Expertise Gains Momentum
Franchise and concession formats accounted for 51.85% of 2025 installations. Airports secure steady concession fees while delegating staffing, cleaning, and pricing to specialists. Minute Suites’ multi-airport portfolio exemplifies how brand consistency drives repeat usage among loyalty program members.
Third-party-managed structures, however, notch the speediest expansion at 8.47% CAGR. Under this approach, airports outsource day-to-day operations but may fund capital outlays, retaining upside once traffic surpasses benchmarks. The division of roles clarifies contractual risk and accelerates adoption in facilities lacking concession-tender bandwidth. As algorithms fine-tune occupancy and variable pricing, data-rich operators garner negotiating power for revenue-share uplifts.
Geography Analysis
North America’s 37.92% revenue lead is anchored by robust business-travel recovery and sophisticated concession partnerships that bundle pods with credit-card lounge access. Minute Suites’ forthcoming rollout at JFK Terminal 4 exemplifies this synergy, enabling travelers to book through mobile apps and loyalty programs in tandem. Regulatory initiatives such as the FAA’s technology-research funds lower adoption risk by offsetting innovation expenses and encouraging integrations like biometric access.
Asia-Pacific’s 8.69% CAGR to 2031 underscores rapid terminal modernization and growing long-haul connectivity that elevate layover lengths. Singapore, South Korea, and India governments provide capital incentives for passenger-experience features, while regional carriers position rest amenities as key differentiators in fare classes. The region’s advanced IoT adoption accelerates the deployment of sensor-rich pods capable of predictive maintenance and energy optimization, improving uptime and lowering lifecycle costs.
Europe balances real-estate scarcity with intense competition among hubs for international transfer traffic. Heathrow’s recently unveiled Ultra Pods integrate advanced HVAC, circadian lighting, and real-time occupancy updates, aligning with continent-wide sustainability directives. Airports use granular utilization data to demonstrate revenue density superior to luxury-retail tenants, supporting continued pod footprint expansion despite space constraints.

Competitive Landscape
The airport sleeping pods market remains moderately fragmented. Early movers like GoSleep, YOTELAir, and Napcabs leverage brand awareness and operational maturity to secure prime concourse real estate. Emerging challengers differentiate through technology-first platforms that automate bookings, biometric entry, and variable pricing. Compliance with UL 962 safety standards now constitutes a gating factor, and operators with established audit records possess a competitive moat.
Technology integration is the main battleground. IoT telemetry feeds dashboards that optimize cleaning cycles and predict component failures, cutting downtime and boosting asset yields. Leading providers also integrate with airline reservation systems, channeling pre-qualified passengers directly to pod inventory. While price competition exists, airports increasingly evaluate vendors on data-sharing transparency and the ability to elevate overall passenger-experience ratings, not hourly rates.
White-space opportunities persist in second-tier domestic airports and select emerging markets in Africa and South America. Limited incumbent presence, governmental airport upgrades, and growing middle-class travel create fertile ground. Success hinges on modular build-outs that fit uncertain demand and straightforward lease structures that appeal to authorities unfamiliar with concession complexity.
Airport Sleeping Pods Industry Leaders
GoSleep
Sleepbox
YOTELAir (Yotel Limited)
Napcabs GmbH
Minute Suites, LLC
- *Disclaimer: Major Players sorted in no particular order

Recent Industry Developments
- January 2025: Royal Schiphol Group confirmed a EUR 6 billion (USD 6.86 billion), five-year capital program to incorporate sleeping-pod zones into terminal renovations and raise passenger satisfaction scores.
- September 2024: JetBlue Airways unveiled premium-lounge concepts for JFK and Boston Logan that include nap suites, spotlighting intensifying competition for in-terminal rest revenue.


Research Methodology Framework and Report Scope
Market Definitions and Key Coverage
Our study defines the airport sleeping pods market as all revenue earned from the sale and in-terminal installation of enclosed, bed-equipped pods or micro-cabins that can be rented by passengers for short stays, typically one to eight hours, inside public or security-restricted areas of commercial airports. Pods must feature controlled lighting, ventilation, power outlets, and lockable doors to be counted.
Scope exclusion: Lounges with reclining chairs, capsule hotels located outside airport grounds, and sleep pods deployed in offices, hospitals, or academic campuses are not included.
Segmentation Overview
- By Occupancy Type
- Single
- Shared
- By Stay Duration
- Short Stay (Less than 2 hours)
- Standard Stay (2 to 6 hours)
- Overnight Stay (Greater than 6 hours)
- By Airport Type
- International
- Domestic
- By Ownership Model
- Airport-Operated
- Franchise/Concession-Operated
- Third-Party Managed
- By Geography
- North America
- United States
- Canada
- South America
- Brazil
- Rest of South America
- Europe
- Germany
- United Kingdom
- France
- Rest of Europe
- Asia-Pacific
- China
- India
- Japan
- South Korea
- Rest of Asia-Pacific
- Middle East and Africa
- Middle East
- United Arab Emirates
- Saudi Arabia
- Rest of Middle East
- Africa
- South Africa
- Rest of Africa
- Middle East
- North America
Detailed Research Methodology and Data Validation
Primary Research
Structured interviews with airport commercial managers, pod-system operators, lounge concessionaires, and aviation architects in North America, Europe, the Middle East, and Asia provided live occupancy rates, installation costs, and pricing tactics. Follow-up surveys with frequent flyers validated willingness-to-pay assumptions and identified emerging comfort features.
Desk Research
We opened with traffic, capacity, and connection-time statistics drawn from tier-one sources such as IATA, Airports Council International, UNWTO visitor flows, and national civil-aviation regulators, which helped size the pool of travelers likely to pay for rest space. Company filings, airport concession agreements, press releases, and airport master-plan documents then clarified pod deployments, rental tariffs, and pipeline projects across regions.
To gauge manufacturer economics, we referenced D&B Hoovers for turnover data, while Dow Jones Factiva supplied deal announcements. Patent filings tracked design iterations, and trade journals on terminal design offered cost benchmarks. The sources named here illustrate the breadth of material consulted; many additional outlets were reviewed for cross-checks and context.
Market-Sizing & Forecasting
A top-down build started with international and domestic transit-hour volumes, multiplied by observed penetration rates of pods within terminals and average hourly rental tariffs. Results were corroborated through selective bottom-up supplier roll-ups and channel checks to fine-tune regional totals. Key inputs included layover duration distribution, terminal floor-space additions, pod unit capex, average occupancy yield, passenger traffic growth, and real tariff progression. Forecasts employ a multivariate regression that ties pod demand to passenger throughput, disposable income, and expansion of 24-hour hub operations, while scenario analysis bridges data gaps where installation counts were partial.
Data Validation & Update Cycle
Model outputs pass variance checks against independent traffic and revenue signals before senior analyst sign-off. Reports refresh annually, with interim updates triggered by material events such as major hub expansions or step-change vendor contracts. A final review on publication week ensures clients receive the latest view.
Why Mordor's Airport Sleeping Pods Baseline Earns Trust
Published estimates often diverge because firms adopt differing scopes, traffic pools, and refresh cadences.
Key gap drivers include whether study boundaries cover only international hubs or every domestic airfield, the choice between list prices and realized tariffs, and the frequency with which new installations are captured.
Benchmark comparison
| Market Size | Anonymized source | Primary gap driver |
|---|---|---|
| USD 81.8 M (2025) | Mordor Intelligence | - |
| USD 75 M (2024) | Global Consultancy A | Narrows scope to shared pods in top 50 hubs and relies on vendor shipment data updated biennially |
| USD 68.1 M (2025) | Industry Research Firm B | Counts domestic installations only and applies flat ASPs without inflation adjustment |
| USD 75.1 M (2023) | Trade Journal C | Includes prototype units not yet operational and projects using a simple historical average |
The comparison shows that once scope breadth, refresh frequency, and price realism are aligned, Mordor's balanced, transparently sourced baseline remains the dependable reference point for airport planners, investors, and pod vendors.


Key Questions Answered in the Report
What was the airport sleeping pods market size in 2026?
The airport sleeping pods market size stood at USD 87.12 million in 2026 and is projected to hit USD 119.28 million by 2031, reflecting a 6.48% CAGR.
Which region leads the airport sleeping pods market?
North America led with 37.92% revenue share in 2025, thanks to mature concession frameworks and high passenger spending.
Which segment is growing fastest within the airport sleeping pods market?
Shared-occupancy pods are the fastest-growing configuration, advancing at a 8.62% CAGR through 2031.
Why are domestic airports adopting sleeping pods more rapidly now?
Hub-and-spoke routing and rising business travel extend domestic connection times, making pods attractive for quick rest and productivity during layovers.
How is technology shaping the airport sleeping pods industry?
IoT sensors, biometric access, and dynamic pricing platforms cut operating costs, raise utilization, and enable seamless booking through airline and loyalty ecosystems.
What are the main restraints to wider adoption of airport sleeping pods?
High installation costs versus retail alternatives and competition from lounges and micro-hotels limit pod footprints in space-constrained premium terminals.
Page last updated on:


