Market Overview
| Study Period | 2020 - 2031 |
|---|---|
| Forecast Data Period | 2026 - 2031 |
| Historical Data Period | 2020 - 2024 |
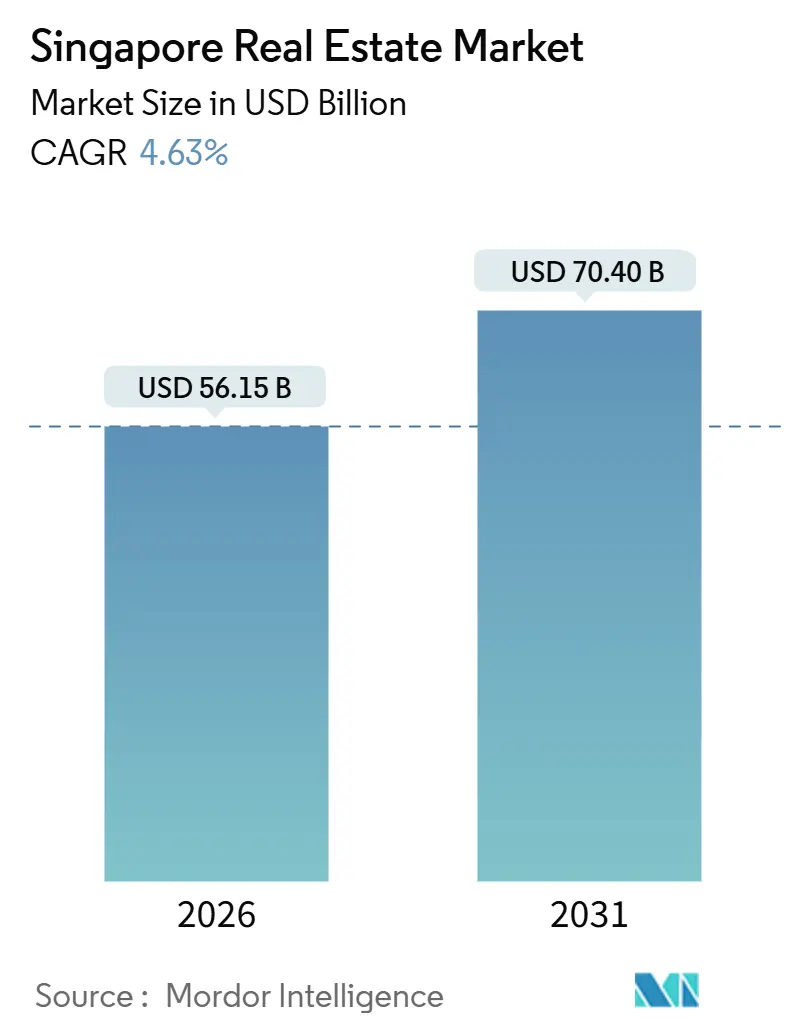
| Market Size (2026) | USD 56.15 Billion |
| Market Size (2031) | USD 70.40 Billion |
| Growth Rate (2026 - 2031) | 4.63% CAGR |
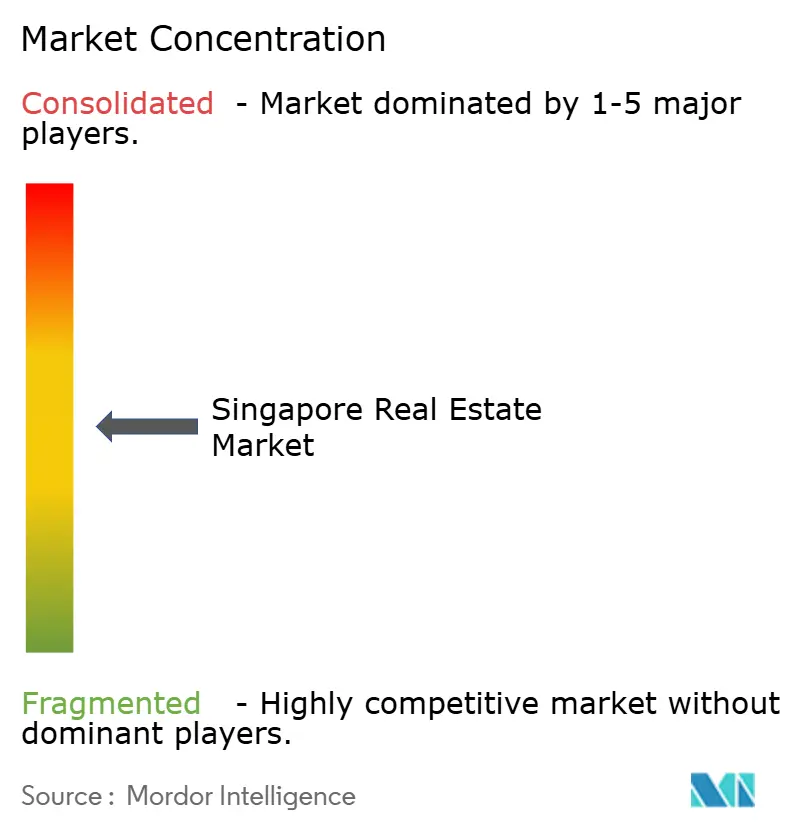
| Market Concentration | Medium |
Major Players *Disclaimer: Major Players sorted in no particular order Image © Mordor Intelligence. Reuse requires attribution under CC BY 4.0. | |
Singapore Real Estate Market Analysis by Mordor Intelligence
The Singapore Real Estate market size is USD 56.15 billion in 2026 and is projected to reach USD 70.4 billion by 2031, reflecting a 4.63% CAGR. The Singapore Real Estate market continues to benefit from safe-haven demand, tight supply in central office districts, and a steady flow of household buyers supported by formal savings and policy clarity. A high level of market participation by licensed agents, coupled with measured liquidity across residential and commercial assets, supports balanced price discovery. Government-led urban redevelopment programs and green building incentives remain key anchors for long-term value creation in the Singapore Real Estate market. Targeted cooling measures and strict credit frameworks keep speculative activity contained, which helps align price trends with economic fundamentals in the Singapore Real Estate market.[1]https://www.cea.gov.sg/
Key Report Takeaways
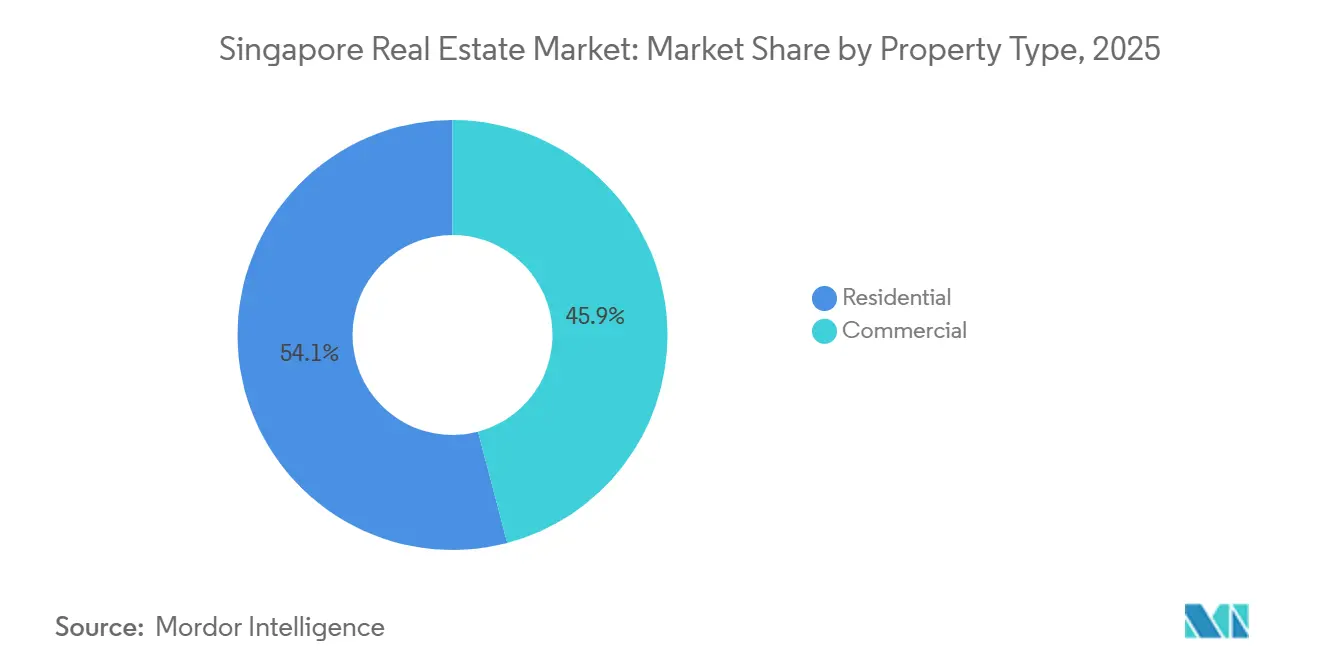
- By property type, Residential led with 54.1% revenue share in 2025, while Commercial is forecast to expand at a 5.44% CAGR through 2031.
- By business model, Sales held a 63.2% share in 2025, while Rental is projected to grow at a 5.30% CAGR to 2031.
- By end-user, Individuals and Households accounted for 70.1% of 2025 revenue, while Corporations and SMEs are expected to record the fastest growth at a 5.59% CAGR.
- By geography, the Core Central Region held a 43.1% share in 2025, while the Rest of Central Region is on track to grow at a 5.99% CAGR through 2031.
Note: Market size and forecast figures in this report are generated using Mordor Intelligence’s proprietary estimation framework, updated with the latest available data and insights as of January 2026.
Singapore Real Estate Market Trends and Insights
Drivers Impact Analysis*
| Drivers | (~) % Impact on CAGR Forecast | Geographic Relevance | Impact Timeline |
|---|---|---|---|
| Government-backed urban planning spurring long-term development | +1.2% | National, with early gains in Greater Southern Waterfront precincts | Long term (≥ 4 years) |
| Strategic positioning as a regional business hub supporting office and mixed-use growth | +0.9% | CCR CBD, business parks in Changi Business Park, and one-north | Medium term (2-4 years) |
| Robust foreign investor interest driven by political stability and strong legal frameworks | +0.8% | Global, concentrated in CCR and RCR for premium assets | Long term (≥ 4 years) |
| Booming e-commerce and advanced manufacturing driving logistics and industrial demand | +0.7% | OCR industrial zones such as Jurong, Tuas, Woodlands, and prime corridors near Tuas Mega Port | Short term (≤ 2 years) |
| Sustained demand in the luxury and high-end residential segment from global UHNWIs | +0.6% | CCR Districts 9-11, Sentosa Cove | Medium term (2-4 years) |
| Rising adoption of smart and sustainable building technologies | +0.5% | National, with pilot projects in Marina South and Punggol Digital District | Medium term (2-4 years) |
| Source: Mordor Intelligence | |||


Government-Backed Urban Planning Spurring Long-Term Development
The Urban Redevelopment Authority’s planning framework, including the transformation of the Greater Southern Waterfront, expands the supply of mixed-use and housing options over a multi-decade horizon in the Singapore Real Estate market. Port relocation and new precinct development create pathways to re-balance density and enhance liveability, with a clear sequence of transport, coastal protection, and community infrastructure investments. The pipeline around city-fringe sites and mature estates aligns new housing with transit nodes and social amenities, which supports price stability through broader access and reduces cross-island commuting. Government Land Sales continue to anchor investor expectations around bid discipline, location advantages, and integrated designs in the Singapore Real Estate market. Over time, these measures build a steady foundation for demand while reducing concentrations of obsolescent stock across the city.[2]https://www.ura.gov.sg/Corporate
Strategic Positioning as a Regional Business Hub Supporting Office, Co-working, and Mixed-Use Growth
Singapore’s role as a regional headquarters location continues to reinforce CBD office fundamentals through steady leasing, low vacancy, and a flight to quality. Vacancy in Core CBD Grade A assets narrowed to 4.7% in the third quarter of 2025, which indicates demand resilience in the Singapore Real Estate market. Limited near-term completions in prime districts, combined with sustained professional services and finance hiring, continue to favor newer green-certified assets. Flexible workspace offerings complement this trend by providing turnkey options to occupiers that prefer short commitments while waiting for clearer macro signals in the Singapore Real Estate market. The Central Business District Incentive Scheme and Strategic Development Incentive Scheme, both overseen by the Urban Redevelopment Authority, encourage adaptive reuse of older buildings to mixed-use formats, which supports long-run grade improvement in the stock. Together, these dynamics reinforce a premium for centrally located, efficient, and sustainable projects in the Singapore Real Estate market.[3]https://www.cushmanwakefield.com/en
Booming E-Commerce and Advanced Manufacturing Driving Logistics and Industrial Real Estate Demand
Logistics and high-spec industrial assets benefit from a blend of port automation, just-in-time inventory strategies, and demand from technology and biomedical tenants. Tuas Mega Port processed 41.1 million TEUs in 2024 and targets 65 million TEUs at full build-out, which strengthens the need for multi-story ramp-up facilities close to maritime gateways in the Singapore Real Estate market. Industrial supply has been pre-committed at high rates, while island-wide vacancy is projected to tighten through 2027, reflecting structurally healthy absorption. Prime logistics rents and high-tech factory rents firmed as occupiers sought power redundancy, automation readiness, and green certifications. Policy support, including land use and lease extensions linked to capital investment, reduces risk on long-cycle industrial projects in the Singapore Real Estate market. Active portfolio moves by listed trusts, such as selective acquisitions near Tuas, illustrate capital rotation toward this theme.
Sustained Demand in the Luxury and High-End Residential Segment from Global UHNWIs
Despite tighter stamp duties, well-capitalized buyers continue to target prime non-landed homes in central precincts for own-stay needs and wealth diversification in the Singapore Real Estate market. Launches of well-located projects in established districts recorded strong initial take-up in 2025, signaling a resilient appetite for premium-located inventory. The broader upgrader pipeline is sustained by public housing delivery that supports orderly transitions into the private market over time. Policy clarity and a strong legal framework continue to anchor long-run demand in the Singapore Real Estate market. This dynamic keeps activity concentrated in high-quality assets with immediate liveability and amenity advantages.
Restraints Impact Analysis*
| Restraints | (~) % Impact on CAGR Forecast | Geographic Relevance | Impact Timeline |
|---|---|---|---|
| Stringent cooling measures and stamp duties tempering speculative residential investment | -1.1% | National, most acute in the CCR luxury segment | Short term (≤ 2 years) |
| Limited land supply and high land acquisition costs constraining new development | -0.9% | National, severe in CCR and prime RCR locations | Long term (≥ 4 years) |
| Geopolitical and economic headwinds impacting foreign capital flow and tenant demand | -0.8% | Global influence, concentrated impact on CBD offices and prime residential | Medium term (2-4 years) |
| Supply-demand imbalances in select asset classes | -0.6% | Suburban retail in OCR, fringe office locations outside the CBD core | Medium term (2-4 years) |
| Source: Mordor Intelligence | |||
Stringent Cooling Measures and Stamp Duties Tempering Speculative Residential Investment
Additional Buyer’s Stamp Duty remains a key tool in shaping residential demand composition, with a 60% rate applied to foreign buyers since April 2023 in the Singapore Real Estate market. The Seller’s Stamp Duty regime, extended to a four-year holding period in July 2025, further disincentivizes short-term flipping and supports more stable resale activity. Macroprudential measures like the Total Debt Servicing Ratio cap help ensure that borrowing remains prudent relative to income levels, which sustains financial stability for households. These frameworks preserve market integrity while reducing volatility in the Singapore Real Estate market. The result is a clearer emphasis on end-user needs and long-run value rather than speculative momentum.
Limited Land Supply and High Land Acquisition Costs Constraining New Development
Singapore’s finite landmass and zoning allocations create persistent scarcity that shapes pricing and bidding behavior, particularly in central precincts of the Singapore Real Estate market. Government Land Sales remain competitive, and average land rates rose in 2025 as developers priced location, transit integration, and amenity depth into pro formas. Industrial zoning and lease policies channel heavy uses to specific districts, reducing conversion optionality in the near term. Longer-dated reclamation and relocation timelines delay the full impact of new supply relief for core residential and mixed-use sites. In this context, developers focus on product differentiation and sustainability credentials to defend margins within the Singapore Real Estate market.
*Our forecasts treat driver/restraint impacts as directional, not additive. The impact forecasts reflect baseline growth, mix effects, and variable interactions.
Segment Analysis
By Property Type: Commercial Leads Growth Despite Residential Dominance
Residential commanded a 54.1% share in 2025, underscoring its role as the largest revenue contributor in the Singapore Real Estate market. HDB resale transactions reached 28,986 in 2025, which indicates steady end-user movement and supports upgrader pathways over time. Commercial assets are the fastest-growing subsegment at a 5.44% CAGR through 2031, supported by low CBD vacancy and a continued flight to quality in the Singapore Real Estate market. Core CBD Grade A vacancy tightened to 4.7% in the third quarter of 2025, which reinforces landlord pricing power at the top end. Industrial and logistics benefit from port automation and pre-commitments in advanced manufacturing, which support sustained absorption and balanced rental growth.
Within Residential, non-landed homes remain the most liquid format for upgraders and new entrants, while landed segments are structurally supply-constrained. In Commercial, office dominates the subsegment revenue, followed by retail and logistics, although logistics has the strongest cyclical tailwind as e-commerce share stabilizes at higher levels. Retail portfolios in suburban catchments benefit from near-full occupancy and healthy rental reversion, reflecting resilient household spending patterns tied to essential services. Data center exposure within industrial portfolios continues to expand, as illustrated by acquisitions of high-spec assets that are fully leased to digital and financial services tenants in the Singapore Real Estate market. Green certification, energy efficiency, and embedded smart systems are increasingly central to asset differentiation across all property types in the Singapore Real Estate industry.

By Business Model: Rental Segment Gains Share Amid Sales Cycle Maturity
Sales held a 63.2% share in 2025, which reflects strong new-launch activity and a steady resale base in the Singapore Real Estate market. Rental is the fastest-growing channel at a 5.30% CAGR through 2031, supported by flexible office demand, expatriate leasing in prime districts, and master leases in logistics that embed annual escalations. Office renewals have been the path of least resistance for many tenants as fit-out costs and relocation capex remain high, which helps sustain occupancy in newer schemes. Residential leasing in upper-tier precincts remains supported by corporate housing budgets, which keep vacancy low in prime projects. Industrial leasing is underpinned by longer-weighted lease expiries and clear rent steps, enabling stable cash flow visibility for landlords in the Singapore Real Estate market.
Primary sales continue to capture strong upgrader interest at accessible quantum bands, while institutional capital focuses on stabilized income-producing assets for predictable yields. In the rental channel, turnkey office suites and build-to-suit industrial facilities help occupiers manage near-term uncertainty while preserving growth options. Leasing demand within high-spec industrial and data center properties has remained resilient, reflecting the infrastructure requirements of digital economy tenants in the Singapore Real Estate industry. Regulatory frameworks, including leverage limits for REITs, support disciplined capital management and preserve balance sheet flexibility across cycles. These features strengthen the durability of the rental growth outlook relative to the maturing sales cycle in the Singapore Real Estate market.
By End-user: Corporates and SMEs Drive Fastest Growth
Individuals and Households represented 70.1% of 2025 revenue, which highlights the centrality of owner-occupiers and renters in the Singapore Real Estate market. Corporates and SMEs are the fastest-growing cohort at a 5.59% CAGR through 2031, led by technology, life sciences, and professional services demand for high-quality office and high-spec industrial space. Public housing launches and targeted policies maintain an orderly upgrade path for households, which supports a stable base of private demand over time. Corporate leasing expanded across CBD and city-fringe nodes in 2025, supported by low vacancy and better building performance standards in the Singapore Real Estate market. This segment mix drives complementary needs for retail podiums, logistics backbones, and integrated community facilities.
Individuals and Households continue to prioritize connectivity, proximity to schools, and access to amenities, which favors launches in mature and centrally linked estates. Corporate demand concentrates in prime CBD towers and in decentralized business parks where talent access and cost efficiency align with long-run workplace strategies. SMEs often prefer strata office or flexible space formats to reduce capex burdens, while larger firms consolidate into fewer, better buildings with modern specifications in the Singapore Real Estate market. Green Mark incentives and gross floor area bonuses steer corporate users to higher-performance assets, accelerating adoption of sustainable design. As these patterns reinforce, the end-user mix supports multi-year investments into mixed-use precincts and smart building capabilities in the Singapore Real Estate market.


Geography Analysis
The Core Central Region accounted for a 43.1% revenue share in 2025, while the Rest of Central Region is projected to post the fastest growth at a 5.99% CAGR through 2031, with the Outside Central Region expanding at a 4.8% CAGR. In the Core Central Region, limited new Grade A supply and favorable tenant demand kept vacancy tight, which supported sustained rental performance at the upper end of the Singapore Real Estate market. Adaptive reuse frameworks in the CBD encourage the conversion of older buildings into mixed-use schemes that blend office, hospitality, and residential uses. Recent prime launches in District 10 achieved high sell-through, which signals healthy absorptive capacity for well-located premium projects in the Singapore Real Estate market. The Core Central Region outlook remains anchored by the scarcity of buildable land and ongoing corporate concentration in the CBD.
The Rest of the Central Region captured 36.7% of 2025 revenue and benefits from an active pipeline of integrated developments near MRT interchanges, which aligns live-work-play needs and supports upgrader demand in the Singapore Real Estate market. New projects linked to strong transport nodes recorded robust initial take-up, which indicates that accessibility and amenity depth help narrow price gaps to the core. Decentralized office nodes in the Rest of the Central Region continue to attract tenants seeking rent savings relative to CBD towers without giving up connectivity. Industrial and high-spec assets near city-fringe clusters complement this story, with acquisitions and asset enhancement by listed trusts reflecting long-cycle confidence in the Singapore Real Estate market. As redevelopment accelerates under incentive schemes, asset quality improves and diversifies the set of investable properties across this geography.
The Outside Central Region contributes 20.2% of 2025 revenue and remains the affordability anchor for first-time buyers and families prioritizing space, supported by a steady pipeline of public and private launches. Industrial dominance is a hallmark of this geography, where clusters in Jurong and Tuas remain central to manufacturing and logistics in the Singapore Real Estate market. Tuas Mega Port’s throughput and automation objectives underpin continued demand for nearby logistics facilities and multi-user factories. Lease frameworks that reward plant and machinery investment improve capex visibility and encourage modernization of existing facilities. New green building standards help newer suburban developments achieve lower operating costs and support stable yields that attract long-term owners in the Singapore Real Estate market.
Competitive Landscape
Competition features two reinforcing models, with capital-light managers scaling through third-party funds and developers deploying balance sheets to originate and deliver projects in the Singapore Real Estate market. The top listed and private platforms operate across office, retail, industrial, and hospitality, using active asset management, green retrofits, and recycling to drive returns. On the development side, disciplined bidding and product differentiation are central to sustaining margins under land scarcity and higher build standards. Government incentives for sustainability and adaptive reuse reward early movers with better leasing outcomes and stickier cash flows in the Singapore Real Estate market.
Developers and REITs executed targeted acquisitions and divestments in 2025 to optimize portfolios and improve balance sheets. City Developments Limited completed the divestment of its South Beach stake for S$834 million (USD 617.2 million), which supported deleveraging objectives while preparing the platform for future deployments in and beyond Singapore. CapitaLand Ascendas REIT announced multiple acquisitions of industrial and logistics assets that were fully occupied with in-place escalations, demonstrating a preference for cash flow visibility in the Singapore Real Estate market. Frasers Logistics & Commercial Trust entered the domestic logistics segment with a Green Mark Platinum asset near Tuas, reweighting its portfolio toward growth categories. Select platforms continued to recycle capital from non-core assets to fund higher-yielding opportunities and to align with sustainability targets.
Market structure in residential development remains concentrated, with top bidders capturing a large share of Government Land Sales in 2025 as average land rates rose alongside demand for integrated, transit-linked sites in the Singapore Real Estate market. The mix of strategies points to continued focus on bulk leasing, tenant quality, and ESG-driven value creation, which is now embedded in underwriting and design. Green building commitments and smart operations help reduce operating costs, raise tenant satisfaction, and extend asset lifecycles across portfolios. Across both models, execution discipline and capital recycling remain the primary tools for navigating land scarcity and policy guardrails in the Singapore Real Estate market.
Singapore Real Estate Industry Leaders
PropNex Realty Pte Ltd
ERA Realty Network Pte Ltd
Huttons Asia Pte Ltd
OrangeTee & Tie Pte Ltd
SRI Pte Ltd
- *Disclaimer: Major Players sorted in no particular order

Recent Industry Developments
- October 2025: CapitaLand Ascendas REIT announced the proposed acquisition of three high-quality industrial and logistics properties, with expected completion in the first quarter of 2026.
- October 2025: UOL consortium comprising UOL Group, Singapore Land, CapitaLand Development, and Kheng Leong launched Skye at Holland in District 10, achieving strong day-one take-up.
- October 2025: City Developments Limited completed the divestment of its 50.1% stake in the entity owning the South Beach integrated development for S$834 million (USD 617.2 million).
- September 2025: Keppel received the Investment Registration Certificate for Phase 3 of Saigon Centre in Ho Chi Minh City, Vietnam, featuring premium green office, retail, and hospitality spaces.


Research Methodology Framework and Report Scope
Market Definitions and Key Coverage
Our study defines the Singapore real estate market as all primary sales and rental revenues generated from residential, commercial, industrial, and mixed-use buildings located within the Republic, expressed in USD after conversion from SGD at the prevailing annual average rate.
Scope exclusions, such as land-bank flips, REIT share trades, and stand-alone facilities-management fees, are left outside the valuation so the focus stays on bricks-and-mortar transaction economics.
Segmentation Overview
- By Property Type
- Residential
- Apartments & Condominiums
- Villas & Landed Houses
- Commercial
- Office
- Retail
- Logistics
- Others (industrial real estate, hospitality real estate, etc.)
- Apartments & Condominiums
- By End-user
- Individuals / Households
- Corporates & SMEs
- Others
- By Region
- Core Central Region (CCR)
- Rest of Central Region (RCR)
- Outside Central Region (OCR)
- Residential
Detailed Research Methodology and Data Validation
Primary Research
Mordor analysts interview developers, brokerage heads, institutional investors, valuers, and policy advisers across the island and in key outbound capital hubs (Hong Kong, Sydney, London). Insights on achievable selling prices, lease renegotiations, vacancy expectations, and policy sentiment guide the fine-tuning of conversion factors and stress-test early desk findings.
Desk Research
We begin by mining freely available macro and sector series from agencies such as the Urban Redevelopment Authority, Department of Statistics, Monetary Authority of Singapore, and the Building & Construction Authority, which collectively anchor volumes, prices, completions, mortgage outstandings, and planned pipeline projects. Additional context flows from parliamentary papers, tender logs, and reputed dailies that track stamp-duty tweaks and cross-border capital inflows.
Company filings, IPO prospectuses, and investor decks complement these public feeds, while paid databases like D&B Hoovers and Dow Jones Factiva help our analysts benchmark developer financials and news momentum against market-wide indicators. The sources listed here illustrate the breadth of inputs; many other public and subscription references are consulted throughout the build.
Market-Sizing & Forecasting
The core model applies a top-down build that reconstructs market value from URA transaction counts, average transacted unit sizes, and median selling or leasing prices, followed by rental-yield gross-ups for income assets. Select bottom-up checkpoints, such as developer revenue roll-ups and sampled average selling price multiplied by unit launches, flag material skews before finalizing totals. Key fingerprints include private home sales volumes, industrial space take-up, median office rents, foreign direct investment pledges, and stamp-duty bracket shifts.
Multivariate regression links these drivers to historical market value and projects them forward, while scenario analysis cushions for interest-rate and policy shocks. Data voids, where they arise, are interpolated using three-year moving averages adjusted by primary-research sentiment.
Data Validation & Update Cycle
Every draft model passes variance checks against independent benchmarks, then undergoes peer review and senior-analyst sign-off. Reports refresh yearly; interim updates trigger when policy, economic, or transaction shocks move inputs beyond preset alert bands.
Why Mordor's Singapore Real Estate Baseline Commands Reliability
Published numbers often diverge because firms select different scopes, price assumptions, and refresh cadences.
We acknowledge those gaps upfront and then show how a disciplined variable set and annual update rhythm ground our figures.
Benchmark comparison
| Market Size | Anonymized source | Primary gap driver |
|---|---|---|
| USD 53.6 bn (2025) | Mordor Intelligence | - |
| USD 62.9 bn (2025) | Global Consultancy A | Includes land-bank transfers and premium-tier ASP uplift beyond URA averages |
| USD 35.3 bn (2024) | Trade Journal B | Counts only notarized sales; drops rentals and industrial assets |
The comparison confirms that when scope alignment and dual-track validation are missing, values swing widely. Mordor Intelligence delivers a balanced, transparent baseline that connects back to verifiable public series and repeatable steps.


Key Questions Answered in the Report
What is the size and growth outlook for the Singapore Real Estate market to 2031?
The Singapore Real Estate market size is USD 56.15 billion in 2026 and is projected to reach USD 70.4 billion by 2031 at a 4.63% CAGR.
Which segments lead and which are growing fastest within the Singapore Real Estate market?
Residential led with 54.1% of revenue in 2025, while Commercial is the fastest-growing at a 5.44% CAGR through 2031.
How do policy measures affect demand in the Singapore Real Estate market?
ABSD and SSD frameworks reduce speculative activity, while TDSR maintains prudent borrowing, which stabilizes demand and price trends.
Which geographies are most attractive in the Singapore Real Estate market?
The Core Central Region held a 43.1% share in 2025, and the Rest of Central Region is the fastest-growing at a 5.99% CAGR, supported by integrated transit-linked projects.
What is driving logistics and industrial demand in the Singapore Real Estate market?
Port automation and throughput at Tuas Mega Port, together with advanced manufacturing, continue to drive pre-commitments and rental stability.
What strategic moves did leading players make in 2025 in the Singapore Real Estate market?
Major moves included South Beach divestment by City Developments Limited and multiple industrial acquisitions by CapitaLand Ascendas REIT and Frasers Logistics & Commercial Trust.
Page last updated on:


