Market Overview
| Study Period | 2019 - 2031 |
|---|---|
| Forecast Data Period | 2026 - 2031 |
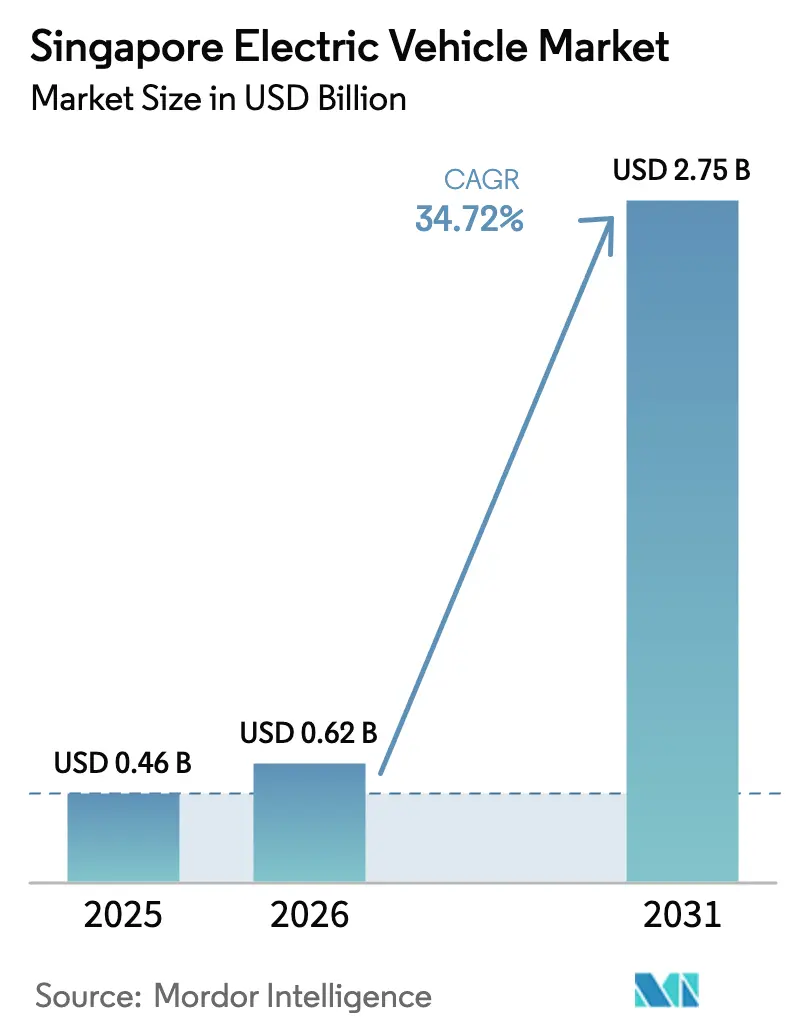
| Base Year Market Size (2025) | USD 0.46 Billion |
| Market Size (2026) | USD 0.62 Billion |
| Market Size (2031) | USD 2.75 Billion |
| Growth Rate (2026 - 2031) | 34.72% CAGR |
| Market Concentration | Medium |
Major Players *Disclaimer: Major Players sorted in no particular order Image © Mordor Intelligence. Reuse requires attribution under CC BY 4.0. | |
Singapore Electric Vehicle Market Analysis by Mordor Intelligence
The Singapore electric vehicle market size is expected to grow from USD 0.46 billion in 2025 to USD 0.62 billion in 2026 and is forecast to reach USD 2.75 billion by 2031, reflecting a 34.72% CAGR over the forecast period (2026-2031). This acceleration is anchored in an incentive-heavy fiscal regime, rapidly scaling charging infrastructure, and a hard regulatory phase-out that removes internal-combustion optionality for new buyers. Electric vehicles have significantly increased their share of new car registrations in Singapore, signaling their transition into mainstream adoption. Passenger cars dominate the market, accounting for the majority of revenue. However, the electrification of ride-hailing and logistics is expected to drive the rapid growth of commercial vehicles. Battery-electric models lead the drivetrain segment, supported by rebates, adjustments to COE categories, and a well-established island-wide charging network, making them the most cost-effective option over the ownership cycle. Manufacturers are focusing on localizing production or final assembly to mitigate COE volatility, while fleet operators are securing orders in anticipation of stricter incentive conditions.
Key Report Takeaways
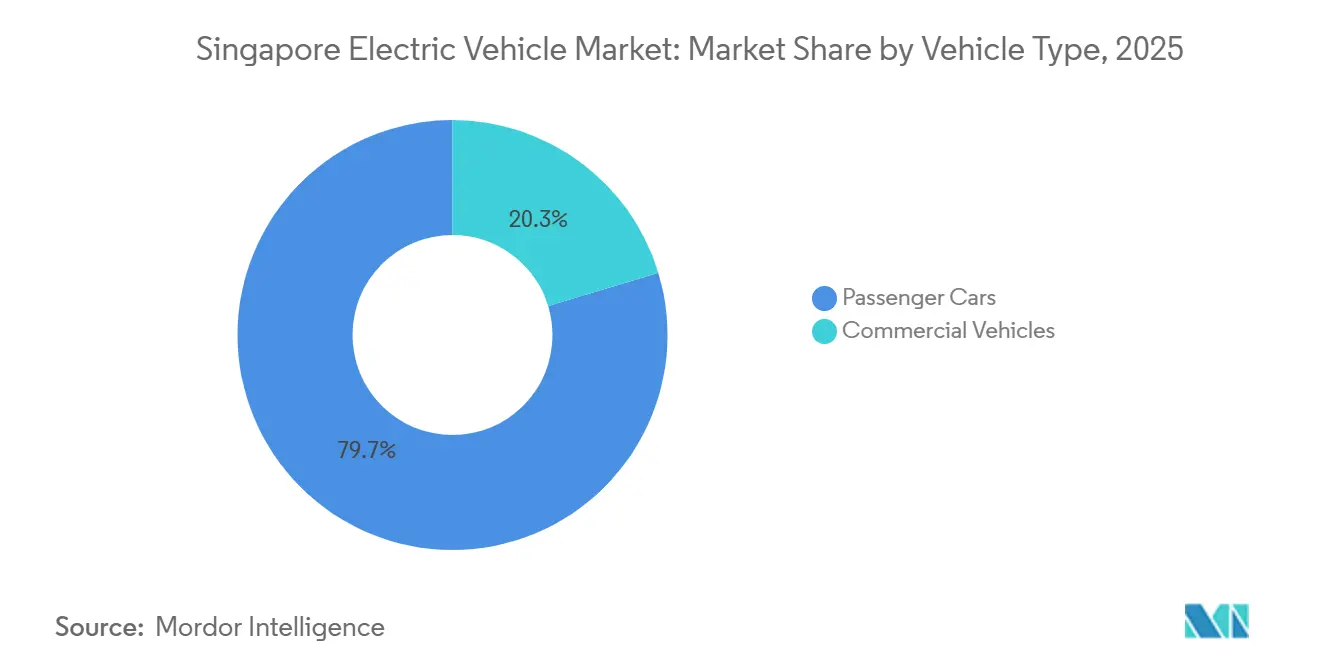
- By vehicle type, passenger cars led with 79.67% share of the Singapore electric vehicle market size in 2025; commercial vehicles are forecast to expand at a 37.21% CAGR through 2031.
- By drivetrain, battery electric vehicles accounted for an 82.23% share of the Singapore electric vehicle market size in 2025 and are projected to advance at a 35.78% CAGR to 2031.
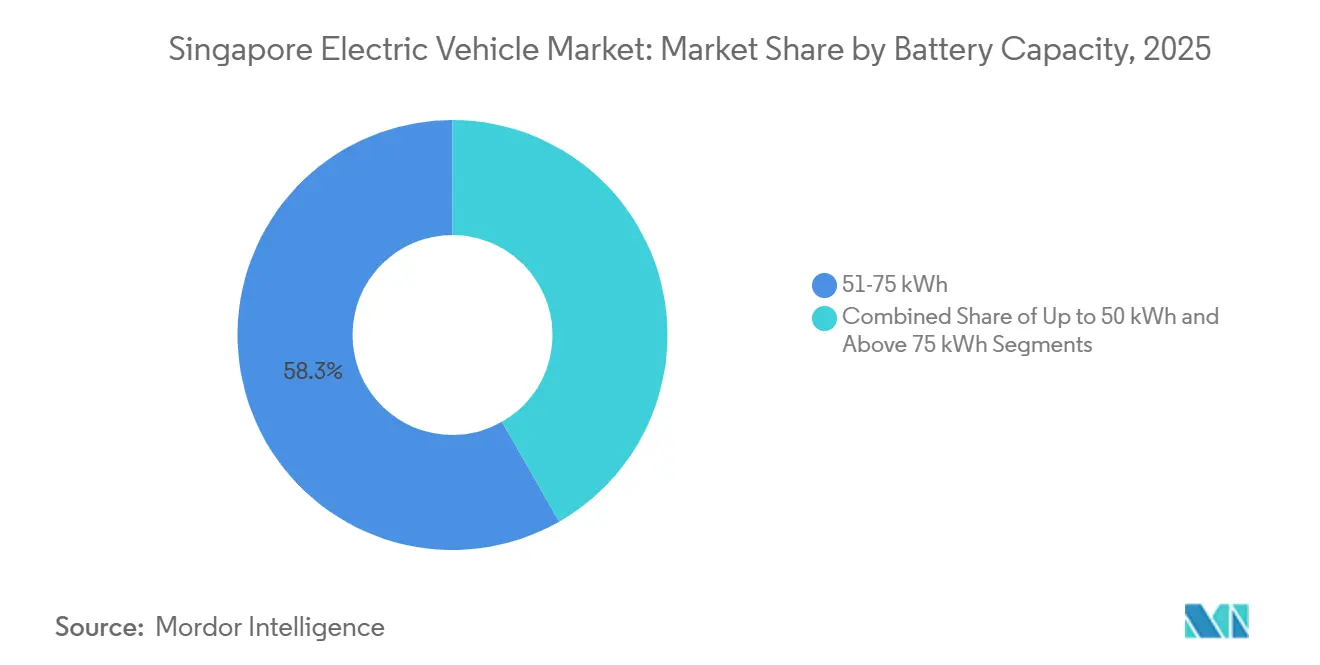
- By battery capacity, the 51-to-75 kWh class captured 58.26% of the Singapore electric vehicle market size in 2025, while packs above 75 kWh are projected to grow at a 38.06% CAGR through 2031.
- By end user, private individual owners accounted for 62.18% of the Singapore electric vehicle market in 2025, whereas commercial fleet operators are projected to grow at a 35.62% CAGR to 2031.
Note: Market size and forecast figures in this report are generated using Mordor Intelligence’s proprietary estimation framework, updated with the latest available data and insights as of January 2026.
Singapore Electric Vehicle Market Trends and Insights
Drivers Impact Analysis*
| Driver | (~) % Impact on CAGR Forecast | Geographic Relevance | Impact Timeline |
|---|---|---|---|
| Incentives Driving TCO Parity | +8.5% | Singapore | Short term (≤ 2 years) |
| COE and VES Reforms Penalizing ICE | +7.8% | Singapore | Medium term (2-4 years) |
| Charger Roll-Out Toward 60k Target | +6.2% | Singapore | Medium term (2-4 years) |
| Battery Costs Projected Below USD 80/kWh | +4.5% | Global supply chains | Medium term (2-4 years) |
| Fleet Decarbonization By Ride-Hailing and Logistics | +3.8% | Singapore | Medium term (2-4 years) |
| Nationwide V2G Pilot Unlocking Revenue | +2.4% | Singapore | Long term (≥ 4 years) |
| Source: Mordor Intelligence | |||
Government Incentive Schemes Driving TCO Parity
By integrating the Early EV Adoption Incentive with the Vehicle Emissions Scheme A1 tier, a dual-rebate architecture significantly reduces sticker-price disparities. These rebates prioritize immediate savings, allowing entry-level battery-electric sedans to surpass their gasoline counterparts in post-tax price. The zero-dollar Additional Registration Fee for eligible models continues to boost demand for mid-range imports, such as the BYD Atto 3. Adoption has surged, with a growing number of electric cars and taxis benefiting from the dual rebates. By reducing Band A2 benefits, policymakers indicate a shift from transitional hybrids to fully zero-emission models, aligning with the evolving charging network. These incentives not only shorten payback periods for frequent drivers but also support a broader acceptance of electric vehicles.
Rapid Roll-Out of Public and Condo Chargers Toward 60 k Target
The island has a growing network of charge points and is following a legally binding roadmap to significantly expand this infrastructure in the coming years [1]“Charging Singapore’s EV future,” Singapore EDB, edb.gov.sg. Regulations now require private condominiums to include active chargers in a portion of their lots and pre-install wiring in additional spaces, reducing future retrofitting challenges for residents. A majority of Housing & Development Board estates are equipped with at least one charger. However, usage patterns indicate a preference for workplace and public fast-charging sites, highlighting ongoing challenges with overnight charging for apartment residents. The Energy Market Authority’s V2G sandbox initiative enables motorists to return power to the grid during peak periods, helping reduce energy costs. The development of a dense, reliable charging infrastructure has helped alleviate range anxiety, making electric vehicles more accessible to consumers without private garages.
COE and VES Reforms Penalizing ICE Ownership
New diesel cars and taxis will no longer be eligible for registration, and all new registrations will transition to cleaner-energy models. Adjustments to the Certificate of Entitlement rules have expanded the power ceiling for electric cars in Category A, enabling more mid-range sedans to qualify for lower-priced permits. Record-high bids for the Certificate of Entitlement highlight the volatility caused by quotas and replacement demand, which rebates alone cannot fully address. At the same time, the Vehicle Emissions Scheme imposes higher surcharges on high-emission models, increasing the financial gap. These combined measures are reducing the options for holdouts to internal combustion engines and driving brands to introduce right-hand-drive electric variants in their showrooms.
Battery-Pack Cost Road-map Below USD 80/kWh by 2028
Global battery-pack prices have been declining, and this trend is expected to continue, driving a significant shift in the cost dynamics of electric vehicles (EVs) compared to internal combustion engine (ICE) vehicles [2]“Global EV Outlook 2024,” International Energy Agency, iea.org. Nissan is advancing its solid-state battery technology with a pilot line in Yokohama, which is anticipated to deliver faster charging times and longer battery life. Additionally, adopting gigacasting for aluminum body sections is reducing manufacturing costs and vehicle weight, resulting in substantial savings. These advancements are particularly impactful in markets like Singapore, where they help offset the additional costs of vehicle ownership. The reduction of upstream expenses is also making higher-capacity batteries more accessible to mid-tier buyers, further strengthening the position of battery electric vehicles (BEVs) in the electric vehicle market.
Restraints Impact Analysis*
| Restraint | (~) % Impact on CAGR Forecast | Geographic Relevance | Impact Timeline |
|---|---|---|---|
| High EV Prices and COE Volatility | -3.2% | Singapore | Short term (≤ 2 years) |
| Limited HDB Parking Upgrade Capacity | -2.8% | Singapore | Medium term (2-4 years) |
| Grid Capex For 150kW Fast-Charge Corridors | -2.5% | Singapore | Long term (≥ 4 years) |
| Scarce RHD Allocations For Singapore Market | -1.9% | Singapore | Medium term (2-4 years) |
| Source: Mordor Intelligence | |||
Persistently High EV Upfront Price and COE Volatility
Record COE bids have occasionally surpassed the open-market value of entry-level electric cars, undermining rebates and straining household budgets. Band A2 VES rebates have been reduced, diminishing support for high-power models and forcing premium buyers to bear additional taxes. Fleet planners face challenges managing COE fluctuations across extended procurement cycles, which can delay bulk orders despite the impending cleaner-energy mandate. High upfront costs remain the most significant barrier to the growth of the Singapore electric vehicle market, particularly for middle-income households without access to leasing options.
Limited HDB Parking Upgrade Capacity for Chargers
While most public housing estates have at least one charge point, only a small proportion of EVs with HDB season parking utilize these facilities. This reflects challenges such as transformer limitations and concerns about queueing. Retrofitting older multi-story carparks requires extensive feeder upgrades, which are delayed by lengthy permitting processes. Additionally, restrictions on the use of household extension cords limit overnight trickle-charging options. Middle-income drivers, particularly those without access to workplace chargers, remain hesitant, slowing EV adoption among Singapore’s largest demographic segment.
*Our forecasts treat driver/restraint impacts as directional, not additive. The impact forecasts reflect baseline growth, mix effects, and variable interactions.
Segment Analysis
By Vehicle Type: Commercial Fleets Drive Acceleration
Passenger cars accounted for 79.67% of the 2025 Singapore electric vehicle market share. Commercial vehicles, however, are slated to post a 37.21% CAGR through 2031, buoyed by decisive moves from ride-hailing, parcel, and public-transport operators. Hatchbacks and sedans remain popular choices for entry-level buyers, supported by favorable policies for models within specific price thresholds. At the same time, compact SUVs, such as the Kia EV5, are gaining traction among buyers seeking additional space at competitive price points.
Light vans are driving commercial adoption, with examples like FedEx’s deployment of electric models demonstrating significant cost savings compared to traditional diesel vehicles. The bus segment is electrifying at a rapid pace, supported by large-scale tenders that are fostering investments in depot-charging infrastructure, which also benefits nighttime truck charging. Medium and heavy trucks face challenges due to payload and range limitations, as well as fewer model options. However, the introduction of electric trucks by leading manufacturers highlights the growing validation of their economic viability in urban freight. Overall, fleet strategies are reshaping the electric vehicle market in Singapore, shifting focus toward high-utilization duty cycles that maximize fuel-saving benefits.


By Drive-Train Technology: BEV Dominance Accelerates
Battery electric vehicles accounted for 82.23% of the 2025 Singapore electric vehicle market share and are forecast to grow at a 35.78% CAGR to 2031, solidifying their status as the de facto platform in the Singapore electric vehicle market. Drivers who frequently cross into Malaysia still favor plug-in hybrids, but dwindling VES incentives and regulatory mandates are limiting the segment's growth. While fuel-cell initiatives are still in the exploratory phase, Hyundai's hydrogen MoU with the Economic Development Board sets the stage. Still, its success is contingent on simultaneous investments in refueling infrastructure.
With expanded public charging and improved real-world ranges for mid-tier BEVs, significant practical challenges are being addressed. Sales data from OEMs reveal a growing trend: buyers are bypassing transitional hybrids altogether. This shift is highlighted by BYD's rise to the top of the brand rankings, surpassing Toyota. As BEV prices continue to decline and regulations tighten, the market's focus is increasingly leaning towards pure electric options.
By Battery Capacity: High-Capacity Packs Gain Momentum
Packs rated 51-to-75 kWh accounted for 58.26% of the 2025 Singapore electric vehicle market share, balancing cost, weight, and 350-to-450 km range that suits the island’s 50 km average daily journey. The Singapore electric vehicle market size for packs above 75 kWh is expanding at 38.06% CAGR because premium buyers value the freedom to weekend-tour Malaysia without en-route charging. Battery price reductions and the anticipated introduction of solid-state batteries will progressively narrow the price gap between various capacity bands, encouraging mid-market consumers to explore higher-end options.
Entry-level battery packs, particularly those with lower capacities, are being adopted by commercial last-mile fleets. These fleets prioritize capital expenditure and payload capacity over driving range. However, the adoption of these packs is somewhat constrained due to a limited selection of right-hand-drive models. As the market sees a surge in multi-chemistry offerings—such as BYD’s Blade cells and CATL’s Shenxing LFP—buyers will find a broader spectrum of energy-density choices across different capacity classes. This diversification is expected to sustain competitive segmentation dynamics over time.

By End User: Commercial Fleets Accelerate Adoption
Private households accounted for 62.18% of the 2025 Singapore electric vehicle market share, driven by rebate-assisted affordability and a cultural preference for personal car ownership in a high-GDP city-state. Commercial fleet demand, although smaller today, is projected to grow at a 35.62% CAGR as operators adjust to carbon pledges and fuel-savings calculations. Grab's electrification roadmap is expected to significantly impact the market, contributing a substantial number of additional units, comparable to a full year's worth of historic taxi registrations.
Government initiatives are accelerating EV adoption. Public-sector leadership is evident through electric-bus tenders, while ComfortDelGro is exploring innovative revenue models with its V2G taxis. Car-sharing platforms are also experiencing notable growth in memberships, reflecting the increasing adoption of mobility-as-a-service. Across various user groups, the availability of cost-effective options and a wider range of models is transforming initial interest into confirmed purchases, reinforcing the upward trajectory of Singapore's electric vehicle market.
Geography Analysis
Singapore's compact landmass allows for quicker interplay of policy, infrastructure, and demand factors compared to larger jurisdictions. The city has seen a significant increase in the share of electric vehicles (EVs) in new-car registrations. With legislative deadlines mandating a transition to cleaner energy for all new car registrations and the entire rolling fleet, Singapore is driving a rapid shift in the automotive landscape. These definitive deadlines compress product cycles for original equipment manufacturers (OEMs) and enhance Singapore's importance on global lists for right-hand-drive vehicle allocations.
Singapore's charging network is expanding rapidly, with a legal commitment to significantly increase the number of charging points. This expansion aims to ensure adequate infrastructure to support the growing EV penetration. While coverage by the Housing and Development Board (HDB) addresses access disparities for the majority of public-housing residents, upgrades to transformers remain a work in progress. Regulatory measures, such as Technical Reference 25, are in place to ensure safety and interoperability across a diverse landscape of charger vendors.
Competitive Landscape
Competitive intensity remains moderate, with the top brands—BYD, Hyundai-Kia, Tesla, Mercedes-Benz, and Volvo—holding a significant share of registrations. BYD has gained prominence through aggressive pricing strategies for its models, which also qualify for full rebates. Hyundai-Kia has strengthened its position by focusing on local production, reducing logistics costs, and improving delivery times. Tesla continues to attract premium buyers by expanding its Supercharger network, offering attractive cash incentives, and offering low financing rates.
European manufacturers are defending their market share by advancing their technology. Mercedes-Benz has introduced a range of models designed to meet logistics demand, while Volvo is leveraging its domestic R&D capabilities to accelerate the development of software-defined vehicle features. Meanwhile, Chinese entrants Xpeng and Zeekr are targeting tech-savvy consumers with innovative driver-assist systems and OTA-enabled cabin interfaces, pushing established players to enhance their value propositions. Nissan's declining market presence highlights the risks for brands that fail to refresh their offerings, as consumer perception surveys indicate its models are less competitive in terms of value for range. Current strategies are increasingly focused on vertical integration of charging, fleet partnerships, and local assembly to mitigate policy-driven cost fluctuations.
Singapore Electric Vehicle Industry Leaders
Hyundai Motor Company
Tesla Inc.
BYD Co. Ltd
BMW AG
MG Motor
- *Disclaimer: Major Players sorted in no particular order


Recent Industry Developments
- May 2025: Kia unveiled its inaugural EV5, assembled in Singapore, priced at SGD 194,000. The production boasted 67% automation, offering variants with a range of 400-540 km.
- March 2025: Hyundai launched the Ioniq 6 sedan, produced locally, and broadened its mobile fast-charging collaborations with SP Mobility.
- January 2025: Inchcape and ComfortDelGro signed an MOU to co-develop EV financing and infrastructure during the opening of BYD’s Commercial Mobility Hub.


Research Methodology Framework and Report Scope
Market Definitions and Key Coverage
Our study defines the Singapore electric vehicle market as all road-legal passenger cars, light commercials, trucks, and buses propelled mainly by battery, plug-in hybrid, or fuel-cell drive trains and licensed by Singapore's Land Transport Authority.
Scope exclusion: low-speed micro-mobility devices such as e-scooters, e-bikes, and golf carts are not covered.
Segmentation Overview
- By Vehicle Type
- Passenger Cars
- Hatchback
- Sedan
- Sport-Utility Vehicle
- Multi-Purpose Vehicle
- Commercial Vehicles
- Light Commercial Vehicles
- Medium Commercial Vehicles
- Heavy Commercial Vehicles
- Buses & Coaches
- Passenger Cars
- By Drive Train Technology
- Battery Electric Vehicles (BEV)
- Plug-in Hybrid Electric Vehicles (PHEV)
- Fuel Cell Electric Vehicles (FCEV)
- By Battery Capacity
- Up to 50 kWh
- 51 to 75 kWh
- Above 75 kWh
- By End User
- Private Individual Owners
- Commercial Fleet Operators
- Ride-hailing & Car-sharing
- Logistics & Delivery
- Government & Public-Sector Fleets
Detailed Research Methodology and Data Validation
Primary Research
Mordor analysts spoke with dealership heads, fleet-leasing managers, charge-point operators, and transport regulators across Singapore and neighboring hubs. They then ran short surveys with early EV drivers. These conversations validated average selling prices, charger-to-vehicle ratios, and policy scenario probabilities.
Desk Research
We combined open datasets from the Land Transport Authority, Singapore Customs, the Energy Market Authority's electricity sales, and National Environment Agency policy papers, which map fleet size, import values, and charger roll-outs. Trade insights from the Electric Vehicle Association of Asia Pacific, peer-reviewed work at Nanyang Technological University, and press archives accessed via Dow Jones Factiva added adoption context. Paid inputs from D&B Hoovers (dealer revenues) and Questel (battery patents) enriched cost and technology views. The sources cited here are illustrative; many more were consulted for data checks and nuance.
Market-Sizing & Forecasting
A top-down build converts LTA registration and in-use stock into value using quarterly average selling prices adjusted for COE premiums and tax rebates. It then cross-checks results with sampled dealer shipments and charger utilization surveys. Key variables include annual COE quota, Additional Registration Fee rebate uptake, battery pack cost per kWh, public charger count, and OEM allocation shares. Multivariate regression on these drivers, supported by scenario analysis around incentive shifts, produces the 2025-2030 forecast, while small data gaps are bridged with three-year moving averages.
Data Validation & Update Cycle
Outputs undergo two-stage peer review. We next compare totals with fleet growth, import duty collections, and power-demand swings. Variances above five percent trigger re-estimation before sign-off. Reports refresh every twelve months, with interim updates issued when material policy changes occur.
Why Mordor's Singapore Electric Vehicle Baseline Earns Trust
Published estimates often diverge because firms pick different drivetrain scopes, handle volatile COE premiums inconsistently, or roll forward historic prices without fresh interviews.
Key gap drivers are the exclusion of buses in some studies, static ASP assumptions that miss quarterly COE shifts, and slower refresh cycles that overlook new rebate caps.
Benchmark comparison
| Market Size | Anonymized source | Primary gap driver |
|---|---|---|
| USD 0.46 B (2025) | Mordor Intelligence | - |
| USD 131.55 M (2024) | Regional Consultancy A | Omits buses; ignores COE in ASP conversion |
| USD 102.34 M (2023) | Global Consultancy B | Relies on charger plan proxy; lacks primary interviews |
These contrasts show how Mordor's disciplined scope choices, annual refresh, and ground-level validations supply a balanced, transparent baseline that decision-makers can trace to clear variables and repeatable steps.


Key Questions Answered in the Report
How large is the Singapore electric vehicle market in 2026?
The Singapore electric vehicle market size is valued at USD 0.62 billion in 2026.
What CAGR is projected for Singapore’s EV sector to 2031?
The Singapore electric vehicle market is projected to grow at a CAGR of 34.72% through 2031.
What is the biggest challenge to wider EV adoption?
Persistently high upfront costs, amplified by volatile COE premiums, continue to restrain some household and fleet buyers.
Which segment will grow fastest through 2031?
Commercial vehicles, led by ride-hailing and logistics fleets, are projected to expand at about 37.21% CAGR through 2031.
Page last updated on:


