
Africa Cotton Market Analysis by Mordor Intelligence
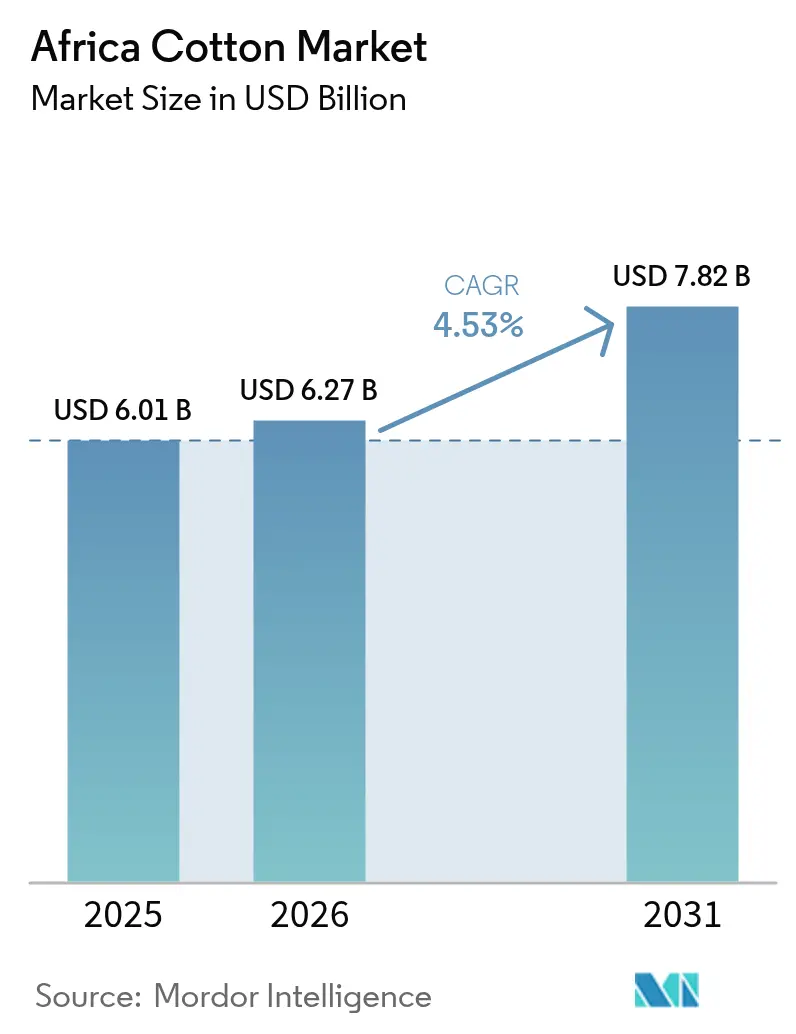
The Africa cotton market size was valued at USD 6.01 billion in 2025 and estimated to grow from USD 6.27 billion in 2026 to reach USD 7.82 billion by 2031, at a CAGR of 4.53% during the forecast period (2026-2031). Structural shifts in West African cultivation zones, wider irrigation coverage in Egypt and Sudan, and deeper offtake ties with Chinese mills are steering the growth trajectory of the Africa cotton market. Government-backed acreage expansion across Benin, Burkina Faso, and Mali overlaps with traceability premiums from European and United States brands, enabling ginners to extract higher margins even while obsolete equipment drags average out-turn ratios below Asian and American benchmarks. Currency shortages in Nigeria, Egypt, and Sudan, together with civil conflict in Gezira, temper near-term optimism, yet digitized advisory platforms cushion productivity losses by guiding smallholders on optimal input timing.
Key Report Takeaways
- By geography, Egypt was the largest country, leading with a 24.20% Africa cotton market share in 2025, while Sudan is the fastest-growing country, forecast to advance at a 5.13% CAGR through 2031.
Note: Market size and forecast figures in this report are generated using Mordor Intelligence’s proprietary estimation framework, updated with the latest available data and insights as of 2026.
Africa Cotton Market Trends and Insights
Drivers Impact Analysis*
| Driver | (~) % Impact on CAGR Forecast | Geographic Relevance | Impact Timeline |
|---|---|---|---|
| Rising area under cotton cultivation | +1.2% | West Africa (Benin, Mali, Burkina and Faso), secondary gains in Côte d’Ivoire and Cameroon | Medium term (2-4 years) |
| Growing chinese demand for West-African lint | +1.4% | West Africa core (Benin, Burkina Faso, and Mali), spillover to Sudan and Tanzania | Long term (≥ 4 years) |
| Expansion of irrigation corridors | +0.8% | North Africa (Egypt, Sudan), East Africa (Tanzania), and Southern Africa (Zimbabwe, and Mozambique) | Long term (≥ 4 years) |
| Adoption of genetically modified cotton seeds | +1.0% | Burkina Faso, Nigeria, Kenya, Malawi, South Africa, and Zimbabwe | Medium term (2-4 years) |
| Digitized extension platforms | +0.5% | Mali, Benin, Côte d’Ivoire, Kenya, Tanzania, Ghana, and Cameroon | Short term (≤ 2 years) |
| Traceability premiums from Environmental, Social, and Governance (ESG)-oriented brands | +0.6% | Global early capture in Benin, Mali, Burkina Faso, Tanzania | Medium term (2-4 years) |
| Source: Mordor Intelligence | |||
Rising Area Under Cotton Cultivation
The expansion of land allocated to cotton farming continues to drive growth in the African cotton market, particularly in West Africa, where cotton remains a key cash crop. Governments and farmer cooperatives actively promote cotton cultivation as a dependable source of export revenue and rural income, encouraging farmers to dedicate more acreage to cotton instead of subsistence crops. Government subsidy programs in Benin, Mali, and Burkina Faso added 180,000 hectares during the 2023-2025 period, increasing raw fiber availability and enabling ginners to secure freight discounts. In 2025, Benin provided USD 40 million in subsidized fertilizer to 285,000 smallholder farmers. These efforts collectively strengthen the region's position in the global cotton market.
Growing Chinese Demand for West-African Lint
The growing demand of cotton from Asian textile manufacturers is a significant factor driving African cotton exports. Chinese mills imported 1.2 million metric tons of African lint in 2025, 19% above 2024 volumes. West African cotton is particularly valued for its fiber quality and competitive pricing, making it appealing to spinning mills seeking to diversify their sourcing. Trade partnerships with Asian buyers help stabilize demand, even when local consumption remains low. For instance, export-focused cotton producers benefit from long-term procurement agreements, which help mitigate price fluctuations and support consistent production, thereby strengthening Africa's position as a key supplier in global cotton trade.
Expansion of Irrigation Corridors
The development of irrigation infrastructure has contributed to improved cotton yield stability in areas previously reliant on inconsistent rainfall. Irrigation corridors help farmers mitigate climate-related risks, extend growing seasons, and enhance crop consistency. In 2025, Egypt has outlined a long-term policy to transition from traditional flood irrigation to modern methods across 3.7 million feddans within three years. This transition includes adopting drip and pivot irrigation systems, laser land leveling, and raised-bed planting, which collectively reduce water use by up to 30% and can increase crop productivity by 30–40%. This development strengthens market resilience by reducing output fluctuations and ensuring a more reliable supply for ginners and exporters.
Adoption of Genetically Modified Cotton Seeds
The growing acceptance of genetically modified cotton seeds has enhanced productivity and minimized crop losses caused by pests. These seeds reduce reliance on chemical inputs and labor-intensive pest control methods, making cotton farming more cost-effective for farmers. In regions where their use is allowed, farmers frequently report higher yields and improved lint quality, boosting competitiveness in export markets. As adoption increases, this factor contributes to sustained improvements in supply reliability and farm-level profitability throughout the cotton value chain. In December 2019, Kenya approved the use of genetically modified (GM) Bt cotton. By March 2020, the government authorized the commercial cultivation of genetically modified (GM) seeds designed to resist infestation by the African bollworm, a prevalent pest that severely impacts cotton farms in Kenya. Thousands of Kenyan farmers have since planted large quantities of these genetically modified (GM) seeds, initially distributed free of charge by the government through a company called Mahyco. This initiative has increased yields and boosted the supply of raw materials essential to the textile industry.
Restraints Impact Analysis*
| Restraint | (~) % Impact on CAGR Forecast | Geographic Relevance | Impact Timeline |
|---|---|---|---|
| Low ginning out-turn ratios versus peers | -0.9% | Mali, Burkina Faso, Benin, Côte d’Ivoire, Tanzania, Kenya, Zimbabwe, and Zambia | Medium term (2-4 years) |
| Under-developed rural logistics | -0.7% | Mali, Burkina Faso, northern Côte d’Ivoire, Tanzania, Mozambique, Zimbabwe, and Zambia | Long term (≥ 4 years) |
| Aging smallholder farmer base | -0.5% | Mali, Burkina Faso, Benin, Tanzania, Kenya, Ghana, and Cameroon | Long term (≥ 4 years) |
| Foreign exchange shortages limiting inputs | -0.8% | Nigeria, Egypt, Sudan, Zimbabwe, spillover to Malawi and Zambia | Short term (≤ 2 years) |
| Source: Mordor Intelligence | |||
Under-Developed Rural Logistics
Inadequate rural transport and storage infrastructure pose significant challenges to the cotton market by driving up costs and increasing post-harvest losses. Many cotton-producing regions rely on unpaved roads, insufficient warehousing, and fragmented transport networks, hindering the efficient movement of seed cotton from farms to gins. In 2025, the 1,028-kilometer Abidjan-Lagos coastal motorway, linking Côte d'Ivoire, Nigeria, Ghana, Togo, and Benin, was set to boost West African connectivity. With USD 15.6 billion in investment interest, construction is slated to start in 2026 and finish by 2030. The African Development Bank funded feasibility studies and developed financing and institutional frameworks to support, the project, yet until the projects finish, logistics bottlenecks continue to restrain the Africa cotton market [1]Source: International Food Policy Research Institute, “Rural Roads and Agricultural Productivity in West Africa,” ifpri.org.
Aging Smallholder Farmer Base
The cotton industry in several African countries relies heavily on smallholder farmers, many of whom are aging and have limited generational succession. Younger individuals often migrate to urban areas or pursue alternative livelihoods, reducing labor availability and slowing the adoption of technology in rural cotton farming. Consequently, productivity growth is restricted, and farm sizes remain fragmented. This demographic shift hampers the industry's capacity to modernize and adapt swiftly to evolving market demands. Tractor-mounted pickers cut labor 70% but cost USD 180,000, beyond most cooperatives’ reach. Without generational renewal, the Africa cotton industry risks acreage attrition[2]Source: Food and Agriculture Organization, “Cottonseed Oil Production and Trade,” fao.org Geography Analysis.
*Our forecasts treat driver/restraint impacts as directional, not additive. The impact forecasts reflect baseline growth, mix effects, and variable interactions.
Geography Analysis
Egypt was the largest country, leading with a 24.20% Africa cotton market share in 2025. The country's proximity to European buyers minimizes lead times, while state incentives encourage apparel manufacturers to establish operations. Producer groups collaborate with mills to ensure consistent lint quality, enhancing backward linkages and stabilizing demand for domestic cotton growers. Egypt continues to serve as the continent's consumption hub, supported by its established spinning capacity, reliable power infrastructure, and free trade agreements with the European Union. According to the United States Department of Agriculture, Egypt's domestic cotton consumption is producted to reach 750,000 bales (163,000 metric tons) in the 2025 marketing year, driven by the expansion of spinning and weaving capacity[3]Source: USDA Foreign Agricultural Service, “Cotton: World Markets and Trade,” usda.gov.
Sudan is the fastest-growing country, forecast to advance at a 5.13% CAGR through 2031. The successful implementation of biotechnology has enhanced profitability and encouraged smallholder farmers to expand their cultivation areas. Government collaboration with development financiers has facilitated funding for irrigation infrastructure improvements, safeguarding yields against climate-related impacts. These advancements position Sudan to increase its share in the African cotton market by 2031, contributing to greater regional supply diversity.
Southern and Eastern Africa contribute smaller cotton volumes but present opportunities for innovation. South Africa's experience with biotechnology serves as a model for controlled implementation of genetically modified (GM) crops. In Zimbabwe, high smartphone adoption among farmers supports the delivery of modern agricultural extension services. Nigeria's textile sector revival has gained momentum, supported by impact investors such as the International Finance Corporation (IFC), which invested USD 15 million in Togo's first export-focused apparel facility in 2024. This investment created 4,520 jobs and boosted regional demand for lint. Meanwhile, Cameroon and Ghana face administrative and infrastructure challenges but remain key targets for logistics improvements.
Regulatory Landscape
Africa's cotton regulatory environment combines national crop-trade oversight with growing regional and multilateral policy anchors aimed at lifting value addition. In March 2026, the World Trade Organization (WTO) launched the implementation phase of the Partenariat pour le Coton (PPC) at MC14 in Yaounde, positioning cotton within a coordinated cotton-to-textile investment and policy agenda for C-4+ countries. MC14 discussions also reiterated commitments tied to the Hong Kong, Bali, and Nairobi cotton mandates on reducing trade-distorting support.
At the national level, commodity governance continues to rely on licensing, grading, and compliance mechanisms administered by local authorities, for example under Tanzania's Cotton Industry Act (Cap 201 R.E 2023). For sustainability and market-access compliance, the Aid by Trade Foundation's Transparency Standard (Version 1, June 2025) for Cotton made in Africa sets a defined transition timeline, with mandatory implementation for stakeholders beginning March 1, 2026. This reinforces traceability and ESG documentation requirements used by brands and exporters.
Value Chain Analysis
The Africa cotton value chain is anchored in input supply (seed, fertilizer, crop protection), smallholder-dominated cultivation, aggregation and seed-cotton trading, ginning, lint classification and baling, and export logistics, with limited downstream transformation into yarn, fabric, and garments in many origins. Export-oriented merchants and integrated processors typically manage procurement, ginning throughput, and freight forwarding, while public or parastatal-linked cotton companies and cooperatives shape farmgate purchasing and input access in major producing markets.
The main frictions sit at midstream and downstream stages, including ginning efficiency gaps, unreliable and costly energy for spinning and weaving, limited industrial finance, and compliance and logistics constraints that inhibit scale-up of regional yarn and fabric trade. Policy and development finance are increasingly tied to value-chain upgrading, as reflected in the African Development Bank's December 2025 approval of a USD 2 million technical assistance grant for Northern Uganda's cotton value chain project to improve seed quality, processing efficiency, and market coordination. Related efforts aligned to AfCFTA aim to reduce non-tariff barriers that restrict intra-African movement of cotton and textile intermediates.
Competitive Landscape
The African cotton market comprises key stakeholders, including importers, exporters, and producers. Major players such as Olam International, Louis Dreyfus Company, and Cargill dominate export logistics through vertically integrated operations encompassing procurement, ginning, and freight forwarding. They face margin pressures from national entities like Societe Burkinabe des Fibres Textiles (SOFITEX), Cotton Company of Zimbabwe Limited (COTTCO), and Societe de Developpement du Coton (SODECOTON), which benefit from subsidized input supplies and preferential access to smallholder cooperatives.
Investments in traceability are transforming competitive dynamics. Mid-tier exporters, such as Plexus Cotton and Paul Reinhart, are leveraging blockchain platforms to enable European buyers to verify farm-level sustainability claims. This capability not only commands price premiums but also secures long-term offtake commitments. Opportunities exist in cottonseed processing, where only 55% of available seed volumes are utilized by existing crushing capacities. Additionally, linter extraction remains underdeveloped outside Egypt and South Africa, despite increasing demand from the pharmaceutical and cellulose derivative industries.
Technology adoption trends favor companies that integrate satellite monitoring, mobile advisory services, and digital payment systems. These innovations facilitate real-time crop tracking and faster settlement cycles, improving liquidity for farmers. Furthermore, compliance with standards such as Better Cotton and Cotton Made in Africa is becoming a fundamental requirement for accessing European and United States markets.
Market Opportunities and Future Outlook
Opportunities are increasingly concentrated in domestic and regional value addition, where multi-country platforms and national programs aim to convert lint and seed cotton into yarn, fabric, and garments. The Partenariat pour le Coton (PPC) entered implementation in March 2026 and is designed to mobilize investment for cotton-to-textile projects in C-4+ countries, supported by the Africa Textile Invest platform launched by partners including Afreximbank, ITFC, and the African Development Bank. The platform centralizes investable project visibility and reduces information frictions for industrial investors.
On-the-ground programs and private investment point to actionable openings in spinning, garmenting, and farm productivity services. Nigeria completed a six-month pilot under its National Cotton, Textile and Garment Industrial Transformation Programme in May 2026, producing 10,000 T-shirts using local cotton, signaling near-term demand pull for lint tied to domestic manufacturing. Senegal set a quantified 2026/27 seed-cotton output target with public support through SODEFITEX, and mechanization access is expanding through channels such as CFAO Kenya's Case IH network build-out (February 2026). Additional opportunities focus on farm-level risk management and compliance tooling, including initiatives such as Cotton4Impact that have deployed weather-intelligence systems for smallholders in markets including Tanzania and Zambia, aligning productivity stabilization with traceability-driven offtake requirements from exporters and brands.
Recent Industry Developments
- June 2026: AVCI Global Industrie inaugurated a textile factory in Senegal's Diamniadio industrial zone, with capacity of about 1,200 garments per day and investment above USD 10 million. The commissioning adds downstream garment capacity that can absorb regional lint and supports the shift from raw-fiber exports toward local transformation in West Africa.
- March 2025: The OPEC Fund provided EUR 26 million (USD 30.3 million) to support Burkina Faso's cotton sector, enabling SOFITEX to purchase seed cotton from farmers during harvest and improve payment cycles. The facility strengthens liquidity at the farmgate, helping stabilize supply procurement for ginners and exporters amid input-cost and financing constraints.
- November 2024: Egypt's Ministries of Agriculture and Industry signed an agreement with UNIDO for the second phase of the Egyptian Cotton Project, extending technical support across the cotton supply chain from farming to manufacturing. The program supports quality and competitiveness upgrades in a major African cotton and textiles hub, reinforcing upstream-to-downstream linkages.


Research Methodology Framework and Report Scope
Market Definition and Coverage
For this study, the Africa cotton market is defined as the value of cotton produced and traded within Africa, expressed in USD, and tied to measurable supply and demand signals like output, trade flows, and indicative prices.
Scope exclusions: We exclude downstream textile and apparel manufacturing value, as well as logistics and retail margins that sit outside the raw cotton market.
Segmentation Overview
- By Geography
- Burkina Faso
- Production Analysis (Area Harvested, Yield, and Production Volume)
- Consumption Analysis (Consumption Value and Volume)
- Import Market Analysis (Import Value, Volume, and Key Supplying Markets)
- Export Market Analysis (Export Value, Volume, and Key Destination Markets)
- Wholesale Price Trend Analysis and Forecast
- Regulatory Framework
- List of Key Players
- Logistics and Infrastructure
- Seasonality Analysis
- Mali
- Production Analysis (Area Harvested, Yield, and Production Volume)
- Consumption Analysis (Consumption Value and Volume)
- Import Market Analysis (Import Value, Volume, and Key Supplying Markets)
- Export Market Analysis (Export Value, Volume, and Key Destination Markets)
- Wholesale Price Trend Analysis and Forecast
- Regulatory Framework
- List of Key Players
- Logistics and Infrastructure
- Seasonality Analysis
- Benin
- Production Analysis (Area Harvested, Yield, and Production Volume)
- Consumption Analysis (Consumption Value and Volume)
- Import Market Analysis (Import Value, Volume, and Key Supplying Markets)
- Export Market Analysis (Export Value, Volume, and Key Destination Markets)
- Wholesale Price Trend Analysis and Forecast
- Regulatory Framework
- List of Key Players
- Logistics and Infrastructure
- Seasonality Analysis
- Kenya
- Production Analysis (Area Harvested, Yield, and Production Volume)
- Consumption Analysis (Consumption Value and Volume)
- Import Market Analysis (Import Value, Volume, and Key Supplying Markets)
- Export Market Analysis (Export Value, Volume, and Key Destination Markets)
- Wholesale Price Trend Analysis and Forecast
- Regulatory Framework
- List of Key Players
- Logistics and Infrastructure
- Seasonality Analysis
- Cameroon
- Production Analysis (Area Harvested, Yield, and Production Volume)
- Consumption Analysis (Consumption Value and Volume)
- Import Market Analysis (Import Value, Volume, and Key Supplying Markets)
- Export Market Analysis (Export Value, Volume, and Key Destination Markets)
- Wholesale Price Trend Analysis and Forecast
- Regulatory Framework
- List of Key Players
- Logistics and Infrastructure
- Seasonality Analysis
- Nigeria
- Production Analysis (Area Harvested, Yield, and Production Volume)
- Consumption Analysis (Consumption Value and Volume)
- Import Market Analysis (Import Value, Volume, and Key Supplying Markets)
- Export Market Analysis (Export Value, Volume, and Key Destination Markets)
- Wholesale Price Trend Analysis and Forecast
- Regulatory Framework
- List of Key Players
- Logistics and Infrastructure
- Seasonality Analysis
- Burkina Faso
Data Sources, Market Sizing, and Validation
Desk Research
Desk research starts by assembling a consistent fact base for cotton area, yields, and country level production, then converting those volumes into value using price and trade cross-checks. Public sources such as FAOSTAT, USDA production and trade briefs, and ITC Trade Map style customs statistics are used alongside national agriculture ministry releases and central bank or IMF macro series to anchor output and the pricing context.
In parallel, we review cotton association and regulator updates where available, plus port and customs notes that explain sudden changes in exports. We also screen company filings, investor presentations, and credible press coverage to understand ginning activity, offtake structures, and policy moves that can affect planted area or farmgate pricing. Where public reporting is delayed, paid subscription databases are used selectively for company financials and intelligence, and another paid source is used for shipment level import and export checks when that triangulation is relevant. The desk sources listed here are illustrative, and additional references were used during the study for data collection, validation, and clarification.
Primary Interviews and Surveys
Primary work is used to pressure test the desk assumptions and translate physical signals into a realistic market value, particularly where pricing and offtake terms vary by country and season. We spoke with growers and cooperatives, ginners, traders, and textile buyers, and we kept the input balanced across major producing and exporting areas in Africa so differences in quality, yields, and pricing could be reflected. The discussions also clarified what to count as cotton market value versus adjacent categories like cottonseed and its oil.
Distribution of primary research fieldwork respondents
| Company type | Respondent position | Region |
|---|---|---|
| Top tier: 27% | CXOs: 19% | |
| Mid tier: 52% | Functional/Unit leaders: 36% | |
| Smaller Players: 21% | Managers: 45% |
Market-Sizing & Forecasting
Sizing starts with a top-down reconstruction that links cotton area harvested and yield trends to production volumes by key countries, then tests those volumes against export availability and domestic use patterns. Once the supply pool is formed, value is derived by applying indicative price series that reflect local wholesale or farmgate movements, then cross-checking against trade unit values and seasonality. The model is supported by selective bottom-up approximations, such as rolling up a sample of ginner throughput and trader channel checks, and then adjusting totals if the implied volumes or prices look out of line.
Inputs that matter most in this market include planted area shifts, yield changes driven by weather and input access, ginning capacity utilization, export share versus domestic use, and annual price direction for key staple grades. Where country level data is patchy, gaps are handled using conservative proxies from nearby markets with similar agronomy, followed by a re-check with interview feedback. Forecasts are built using scenario analysis so policy changes, rainfall variability, and expected price direction are reflected, and then the final path is aligned to the most consistent view shared by primary respondents.
Data Validation & Update Cycle
Outputs are triangulated against independent signals, including production balances, trade totals, and implied price movements, so no single series determines the final number. When a country shows a sharp variance, the drivers are rechecked, followed by a second analyst review that validates formulas, unit conversions, and the logic connecting volume to value. If the mismatch persists, targeted re-contacts are triggered to confirm whether it is a real market shift or a reporting timing issue.
Reports are refreshed annually, and interim updates are made when material events occur, such as major policy changes, supply shocks, or abnormal price swings. Before delivery, a final pass is completed so the latest available statistics and market signals are reflected in the numbers clients receive.
Mordor Intelligence's Africa Cotton Market Size Measured Against Other Published Estimates
Published Africa cotton market values can look different because not everyone counts the same product boundary or uses the same approach to translate tons into USD. Even when the geography is similar, differences show up from the price point chosen, whether trade is netted out or double counted, and how quickly assumptions get refreshed after a season changes.
The table shows a clear spread, and in Mordor Intelligence's model the market value is tied to raw cotton supply and trade signals within Africa, while adjacent value pools like cottonseed and cottonseed oil are not blended into the same total. Another common gap driver is the pricing basis, since some estimates rely on nominal wholesale price constructs or longer forecast windows that smooth near term volatility. Exchange rate timing and the choice of base year also matter, especially when local currencies move quickly against the USD.
Benchmark comparison
| Source | Market Size | Gaps in Research Methodology |
|---|---|---|
| Mordor Intelligence | USD 6.01 B (2025) | |
| Industry Research House A | USD 6.56 B (2025) | This estimate explicitly breaks the market into cotton fiber, cottonseed, and cottonseed oil, which can expand the counted value beyond raw cotton alone. The longer horizon and mixed application scope can also smooth year to year price swings, changing the base year valuation. |
| Trade Data Publisher B | USD 11.50 B (2035) | This figure is a far out value projection for cotton lint and is presented at nominal wholesale prices, so it is not directly comparable to a current year market size. The time horizon, price basis, and focus on a single downstream price construct can inflate the reported USD value versus a nearer term supply and trade anchored model. |
Taken together, the comparison suggests most differences come from what is included in the product scope and the price basis used to convert volumes into value. By keeping the steps traceable to observable production, trade, and pricing indicators, the approach produces a practical number that can be repeated and stress tested as new season data arrives.


Key Questions Answered in the Report
How large will Africa's cotton sector be by 2031?
The Africa cotton market size was valued at USD 6.01 billion in 2025 and estimated to grow from USD 6.27 billion in 2026 to reach USD 7.82 billion by 2031, at a CAGR of 4.53% during the forecast period (2026-2031).
Why are cottonseed crushers gaining importance?
Edible-oil refineries and feed makers are absorbing higher seed volumes, enabling cottonseed revenues to grow 7.0% annually and outpace lint.
What is the biggest supply-side challenge?
Low ginning out-turn ratios veraging 38% versus 42%-44% in advanced markets shave up to USD 150/metric ton from processor margins.
How are brands influencing production practices?
European and United States fashion retailers offer 3-5% price premiums for certified, traceable lint, driving adoption of blockchain and satellite monitoring among exporters.
Page last updated on:






