Market Overview
| Study Period | 2020 - 2031 |
|---|---|
| Forecast Data Period | 2026 - 2031 |
| Base Year Market Size (2025) | USD 630 Billion |
| Market Size (2026) | USD 0.69 Billion |
| Market Size (2031) | USD 1.06 Billion |
| Growth Rate (2026 - 2031) | 9.06% CAGR |
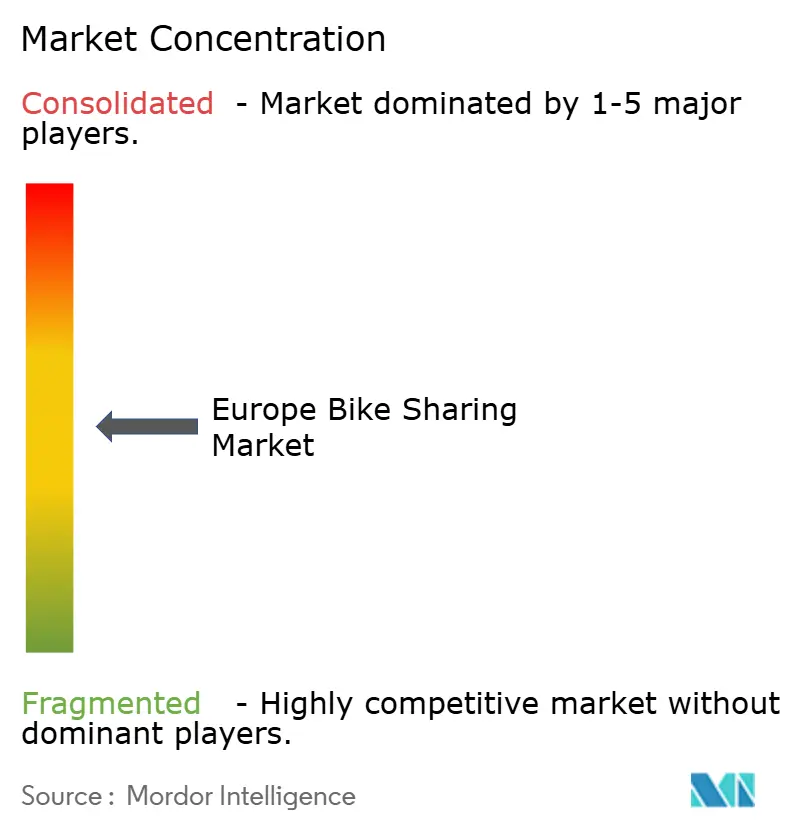
| Market Concentration | Medium |
Major Players *Disclaimer: Major Players sorted in no particular order Image © Mordor Intelligence. Reuse requires attribution under CC BY 4.0. | |

Europe Bike Sharing Market Analysis by Mordor Intelligence
Europe Bike Sharing Market size in 2026 is estimated at USD 690 million, growing from 2025 value of USD 630 million with 2031 projections showing USD 1.06 billion, growing at 9.06% CAGR over 2026-2031. Robust demand for electric fleets, supportive urban-mobility policies and digital booking convenience are keeping growth momentum intact. Accelerating e-bike penetration, the rise of subscription plans tied to corporate mobility budgets and AI-enabled fleet optimisation are improving unit economics and widening the user base. In parallel, ultra-low-emission zones and multi-modal platform integrations are steering commuters, tourists and delivery workers toward shared bicycles.
Key Report Takeaways
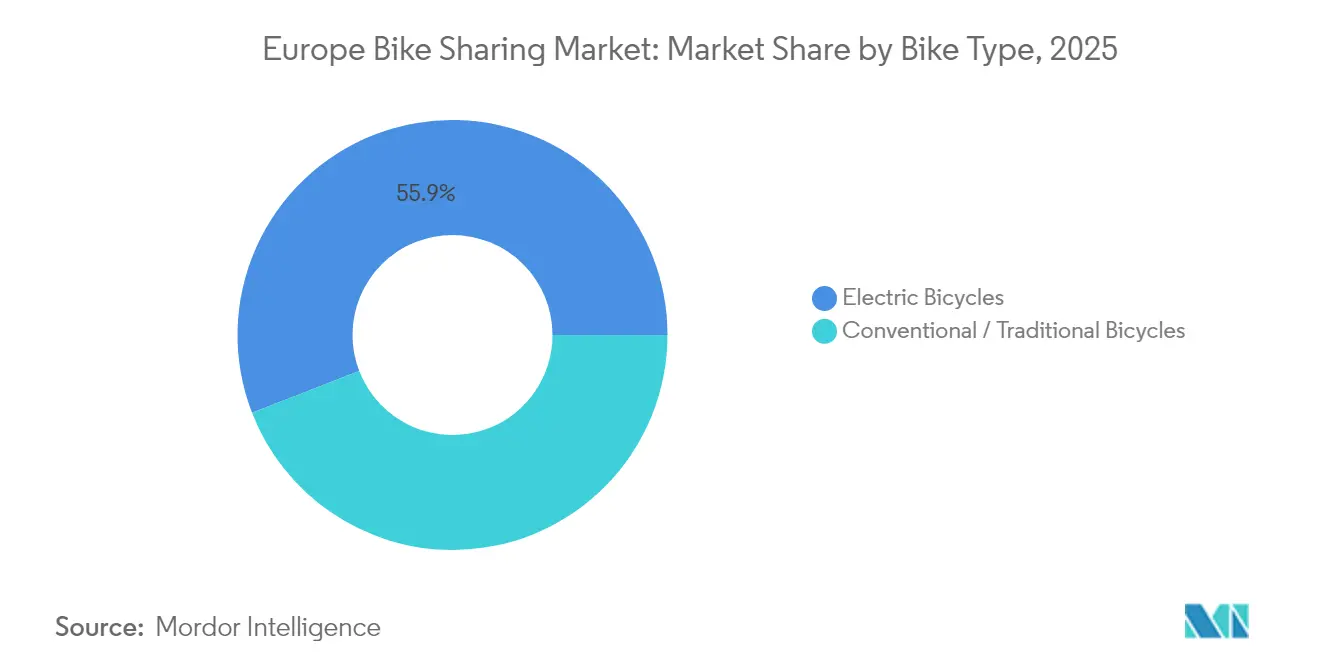
- By bike type, electric bicycles held 55.88% of Europe bike sharing market share in 2025; the segment is tracking a 9.49% CAGR through 2031.
- By sharing system, dockless services led with 68.10% revenue share in 2025, while hybrid formats are expanding at an 8.43% CAGR.
- By booking type, app-based reservations accounted for 81.72% of the Europe bike sharing market size in 2025 and are advancing at a 9.12% CAGR.
- By user profile, commuters dominated with 54.10% share in 2025; delivery and gig workers represent the fastest-growing cohort at a 9.14% CAGR.
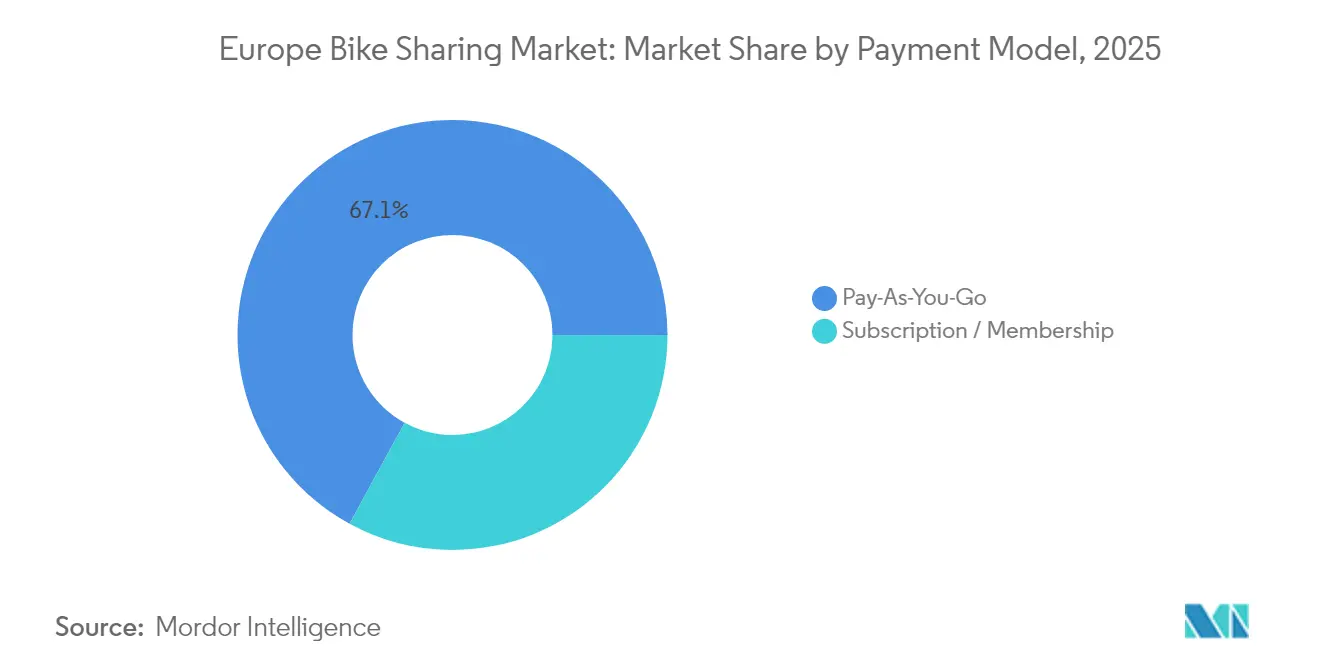
- By payment model, pay-as-you-go retained 67.05% share in 2025, whereas subscriptions are climbing at an 8.91% CAGR.
- By fleet ownership, private operators managed 60.62% of the Europe bike sharing market size in 2025 and post an 8.78% CAGR outlook.
- By country, Germany captured 40.90% revenue share in 2025; the United Kingdom is forecast to record the quickest expansion at a 9.33% CAGR to 2031.
Note: Market size and forecast figures in this report are generated using Mordor Intelligence’s proprietary estimation framework, updated with the latest available data and insights as of 2026.
Europe Bike Sharing Market Trends and Insights
Drivers Impact Analysis*
| Driver | (~) % Impact on CAGR Forecast | Geographic Relevance | Impact Timeline |
|---|---|---|---|
| Accelerating Adoption of E-bikes | +2.1% | Global, with strongest uptake in Germany, Netherlands, France | Medium term (2-4 years) |
| Emergence of Ultra-Low-Emission Urban Zones | +1.8% | EU core cities, expanding to secondary urban centers | Short term (≤ 2 years) |
| Corporate Mobility-Budget Programs | +1.4% | Northern Europe, spreading to Central and Southern Europe | Medium term (2-4 years) |
| AI-driven Dynamic Rebalancing | +1.2% | Technology-advanced markets: Germany, UK, Netherlands, France | Long term (≥ 4 years) |
| EU NextGen Cycling-Infrastructure | +1.0% | EU-wide, with priority funding for urban areas | Long term (≥ 4 years) |
| Tourism Rebound | +0.9% | Tourism-dependent regions: Southern Europe, major capitals | Short term (≤ 2 years) |
| Source: Mordor Intelligence | |||
Accelerating adoption of e-bikes in shared fleets
Operators cite 2–3 times more rides per vehicle, longer average trip length and stronger demand from older or less-fit riders, which jointly lift revenue per asset. Lime invested USD 55 million in 2024 to add 30,000 new e-bikes, prioritising European hubs where terrain or commuting distances limit classic cycling.[1]“Lime Invests USD 55 Million to Grow Global E-Bike Fleet,” Lime, li.meMunicipal incentive schemes in Belgium and France are reinforcing uptake by normalising electric cycling and improving residual battery-charging coverage. As battery prices fall and range improves, operators secure better procurement terms, widening margins in the Europe bike sharing market.
Emergence of ultra-low-emission urban zones
Amsterdam’s January 2025 ban on combustion scooters and vans inside city cores exemplifies how climate policy channels demand toward compliant micro-mobility. Similar regulations in Paris and London expand the captive user pool for bike sharing services and nudge logistics companies into bicycle-based last-mile deliveries. Transport for London’s fine regime of GBP 50-100 for misplaced e-bikes shows local authorities balancing accessibility with public-space order. First movers that can scale fleets quickly inside restricted areas gain defensible shares, anchoring their presence in the Europe bike sharing market.[2]“Dockless Vehicle Parking Guidance,” Transport for London, tfl.gov.uk
Corporate mobility-budget programmes boosting subscriptions
Northern European firms are embedding cycling allowances into remuneration, converting casual riders into locked-in subscribers. Subscription plans rose with smooth revenue streams and raise customer lifetime value. Finnish firm Vapaus attracted EUR 10 million in Series A funding in August 2024 to roll out employee-bike benefits across Scandinavia and Germany.[3]“Vapaus Raises EUR 10 Million to Expand Employee Bike Benefits,” Vapaus, vapaus.io Multiyear corporate contracts guarantee minimum ride volumes and advance ESG goals, further propelling the Europe bike sharing market.
AI-driven dynamic rebalancing improving unit economics
Spatial supply-demand gaps inflate redistribution costs up to two fifth of opex for many operators. Marti Technologies’ February 2024 purchase of Zoba’s predictive platform heralds a shift to data-guided fleet deployment. Real-time insights on weather, events and commuting patterns raise availability, curb theft exposure and optimise maintenance windows. Barcelona’s predictive-maintenance rollout already cuts downtime, supporting higher fleet utilisation. AI capabilities therefore sharpen competitive edges and reduce barriers for smaller rivals in the Europe bike sharing market.
Restraints Impact Analysis*
| Restraint | (~) % Impact on CAGR Forecast | Geographic Relevance | Impact Timeline |
|---|---|---|---|
| Intense Competition from E-scooters | -1.6% | Urban centers across Europe, particularly Germany, France, UK | Short term (≤ 2 years) |
| Vandalism and Theft | -1.3% | UK cities, Eastern European markets, secondary urban areas | Medium term (2-4 years) |
| Capital-Market Tightening Curbing Operator Funding | -1.0% | Global impact, with highest effect on growth-stage operators in competitive markets | Short term (≤ 2 years) |
| Municipal Tender Volatility | -0.8% | Southern and Eastern Europe, cities with frequent political changes | Medium term (2-4 years) |
| Source: Mordor Intelligence | |||
Intense competition from e-scooters & other micro-mobility
Profit-positive e-scooter firms such as Voi Technology are injecting fresh capital to deploy bicycles, crowding curb space and putting price pressure on incumbents. Voi’s plan to release thousands of e-bikes in London in 2025 will intensify mode-choice friction and may drive down per-ride revenue if price wars erupt. Multi-vehicle fleets demand sophisticated demand-allocation algorithms and raise capex needs, testing financial resilience in the Europe bike sharing market. Municipal caps on total vehicles often safeguard incumbents but risk dampening innovation.
Vandalism & theft driving up operating costs
Dockless fleets remain exposed to malicious damage, inflating repair bills to more than one tenth of cost of service in hotspots such as Derby, where Lime exited in September 2024 after extreme vandalism made operations untenable. Higher insurance premiums and hardened bike designs partially mitigate losses but also lift unit costs. Operators therefore focus on geo-fencing, community reporting and defensive hardware, yet the Europe bike sharing market still faces profitability drag where social enforcement is weak.
*Our forecasts treat driver/restraint impacts as directional, not additive. The impact forecasts reflect baseline growth, mix effects, and variable interactions.
Segment Analysis
By Bike Type: Electric models consolidate leadership
Electric bicycles accounted for 55.88% of Europe bike sharing market share in 2025 and are set to widen dominance via a 9.49% CAGR through 2031. Urban riders appreciate longer range and easier hill climbing, while operators earn more rides per asset and benefit from falling battery costs. The Europe bike sharing market size for e-bikes is projected to grow rapidly by 2031, mirroring policy support and city preference for low-sweat commuting. Conventional bicycles remain cost-efficient for very short trips, flatter geographies and tourist hotspots, maintaining a stabilising role in mixed fleets.
Local topography influences fleet mix: hilly Lisbon has already electrified 80% of its public bicycle stock, whereas flat Amsterdam still prefers classic bikes for last-mile hops. The widening procurement pipeline favours mid-drive motor suppliers in Germany and Japan who can deliver modular battery systems. Survey data show 47% of e-bike riders cite fuel-cost avoidance as a buying reason, underscoring macro drivers that translate into higher trip volumes for sharing schemes. Operators continue to pilot cargo e-bikes for delivery workers, opening niche revenue streams inside the Europe bike sharing market.


By Sharing System: Dockless dominates, hybrids gain policy favour
Dockless formats captured 68.10% revenue in 2025 on the promise of user flexibility and rapid rollouts without station hardware. Despite complaints about sidewalk clutter, European municipalities are leaning on designation-zone mandates rather than blanket bans, allowing the Europe bike sharing market to retain the convenience of station-free rentals. The segment shows positive outlook as operators refine geo-fenced parking and AI-guided rebalancing.
Hybrid networks—free-floating bikes that lock to painted bays—are emerging in Paris, Copenhagen and London, winning regulatory goodwill while preserving pick-up spontaneity, and expected to grow at 8.43% CAGR by 2031. Docked schemes such as Vélib’ still thrive in high-density cores, proving that well-funded station models can scale beyond 1,000 hubs when tethered to public-transport passes. The Europe bike sharing market therefore supports a spectrum of infrastructure configurations that align with varying curb-management objectives.
By Booking Type: Mobile-centric usage entrenches
Smartphone apps generated 81.72% of 2025 rides and continue to scale at a 9.12% CAGR to 2031. High 4G coverage and seamless payment links render kiosks secondary except in tourist nodes and among older riders. Rich in-app data allows targeted promotions, carbon-savings dashboards and integration with live bus or rail feeds, keeping riders engaged.
Kiosk and walk-up rentals still serve users lacking mobile payment or requiring printed receipts, yet volumes shrink year on year. Lime’s June 2025 renewal of its Uber tie-in highlights the super-app route to incremental traffic, embedding bicycles inside the largest European ride-hailing market. Data-rich apps improve churn prediction, letting operators tailor retention incentives and operational rosters to peak loads.
By User Profile: Delivery workers fuel incremental demand
Commuters remained core at 54.10% in 2025, producing predictable weekday peaks around 08:00 and 17:30. However, delivery and gig riders exhibit the fastest expansion at a 9.14% CAGR as e-commerce surges and emission-zone mandates push couriers onto bikes. Longer shift-based usage boosts average rental time and raises willingness to pay for battery-swap services.
Tourists and leisure users display strong summer seasonality, requiring fleet relocation toward attractions in Rome, Barcelona and Prague. Corporate plans blur commuter and business-errand trips, extending ride windows into midday. Fine-tuning tariffs for each persona enhances monetisation and supports diversified revenue pillars inside the Europe bike sharing market.
By Payment Model: Subscriptions climb on corporate backing
Pay-as-you-go still generates 67.05% of turnover, reflecting convenience for occasional riders. Yet subscriptions climb at 8.91% CAGR as employers subsidise plans and frequent users seek predictable monthly costs. Donkey Republic’s paying members delivered positive EBIT in 2024, proving the economics of recurring income.
Tiered bundles—weekday commuter passes, unlimited 45-minute rides, or cargo-bike add-ons—improve segmentation and upsell. Dynamic pricing engines test micro-discounts or surge multipliers, balancing fleet availability and profitability. The shift toward memberships cushions revenue volatility and raises stickiness in the European bike-sharing market.
By Fleet Ownership Model: Private operators press efficiency edge
Privately financed fleets controlled 60.62% of rides in 2025 and enjoy an 8.78% CAGR through 2031 as investors favour asset-light concessions that bypass municipal tender cycles. Commercial players invest rapidly in AI tools and hardware renewal to defend margins. Public-private partnerships emerge where cities want coverage in lower-income districts but still value private efficiency.
Municipal systems like Vélib’ and Barcelona Bicing remain critical for mass transit integration yet move slower on tech pilots due to procurement rules. Donkey Republic’s debt facility in January 2025 signals lender confidence in privately run networks with clear cash-flow paths. Ownership diversity keeps the Europe bike sharing market competitive while ensuring service reach.
Geography Analysis
Germany’s 40.90% share in 2025 stems from entrenched cycling norms, 1,000-plus kilometres of segregated lanes in Berlin and Munich and national grants that underwrite charging docks. Integrated journey planners embedded in Deutsche Bahn’s app boost first- and last-mile bike usage alongside rail trips. Expanding corporate subscriptions in Frankfurt and Hamburg further anchor demand, keeping utilisation above 7 rides per bike per day in peak months.
The United Kingdom’s 9.33% CAGR mirrors London’s network expansion from 90 km in 2016 to 390 km by mid-2024 and strict Ultra Low Emission Zone enforcement. Lime’s fleet of more than 10,000 bikes plus Voi’s impending e-bike entry signal escalating rivalry. Outside the capital, Birmingham and Manchester have tendered hybrid-parking pilots to contain sidewalk clutter. Persistently high vandalism rates in some secondary cities oblige operators to trial reinforced frames and community-reward reporting schemes.
France benefits from the Plan vélo et marche 2023-2027, allocating EUR 250 million annually to cycling infrastructure. Paris’ Olympic legacy adds 180 km of new protected lanes, pushing peak daily Vélib’ rides above 210,000 in summer 2025. Lyon, Bordeaux and Strasbourg each integrate bike sharing with tram or metro contactless tickets, expanding the modal share of cycling. Spain, Netherlands and Belgium contribute incremental growth via tourism-heavy hubs, while Italy accelerates fleet electrification in hilly centres such as Turin and Genoa.
Competitive Landscape
Consolidation is reshaping the Europe bike sharing market as scale and technology become prerequisites for profitability. The May 2024 TIER-Dott merger created a 427-city footprint that leverages unified procurement and a common user app. Lime couples global scale with the Uber feed, giving it unparalleled digital reach and data depth. Voi Technology pursues disciplined unit-economics, claiming EUR 132.8 million net revenue and first-time profitability in 2024, while plotting e-bike launches to diversify modal mix.
Regional specialists deepen local moats through municipal partnerships: nextbike’s March 2025 acquisition of VéloCité in Mulhouse adds cross-border synergies with Germany and Switzerland. Donkey Republic exploits its subscription-heavy base to report positive EBIT and secure new debt lines that finance fleet growth. Start-ups such as Vapaus target the corporate benefits niche, creating sticky B2B contracts that bypass consumer churn.
Technology spend defines strategic separation. Marti Technologies’ acquisition of Zoba’s AI engine supercharges predictive rebalancing and component-failure forecasting, raising vehicle utilisation and lowering repair overhead. Operators invest in battery-swap depots to trim charging downtime and in computer-vision parking aids to ease local-authority frictions. While funding conditions tighten, players with positive margins retain access to growth capital, pressuring under-scale rivals to exit or merge within the Europe bike sharing market.
Europe Bike Sharing Industry Leaders
Lime
Tier Mobility
Bolt Technology
Donkey Republic
Voi Technology
- *Disclaimer: Major Players sorted in no particular order

Recent Industry Developments
- June 2025: Lime renewed its multiyear integration with Uber, extending shared-bike visibility across Uber’s European ride-hailing app and reinforcing Lime’s scale-by-platform strategy.
- April 2025: Nextbike Group acquired a Polish bike-share provider, expanding Central European coverage and pooling technology resources to unlock procurement synergies.
- April 2025: Nextbike entered France via the acquisition of the Mulhouse-based VéloCité scheme, deploying 300 e-bikes at 26 stations with a plan to reach 640 bikes across 64 hubs by Jun 2025.


Europe Bike Sharing Market Report Scope
Bike sharing, a sustainable transportation service, enables individuals to rent bicycles and scooters for brief durations. With its affordable pricing structure, this system enhances accessibility, simplifying urban navigation for many.
The European bike-sharing market is segmented by bike type, sharing system, booking type, application type, and country. By bike type, the market is segmented into conventional/traditional bikes and electric bikes (e-bikes). By sharing system, the market is segmented into docked system and dockless system. By booking type, the market is segmented into online booking and offline booking. By application type, the market is segmented into tourism and commuting. By country, the market is segmented into Germany, the United Kingdom, France, Italy, and the Rest of Europe. For each segment, the market sizing and forecast have been done based on the value (USD).
By Bike Type
| Conventional/Traditional Bicycles |
| Electric Bicycles (Pedelec, Speed-Pedelec) |
By Sharing System
| Docked |
| Dockless |
| Hybrid (Station-plus-Free-Floating) |
By Booking Type
| App-Based/Online |
| Kiosk/Walk-Up |
By User Profile
| Commuters |
| Tourists & Leisure Users |
| Delivery/Gig Workers |
By Payment Model
| Pay-As-You-Go |
| Subscription / Membership |
By Fleet Ownership Model
| Municipal-Owned |
| Private-Operator-Owned |
| Public–Private Partnership |
By Country
| Germany |
| United Kingdom |
| France |
| Italy |
| Spain |
| Netherlands |
| Belgium |
| Rest of Europe |
| By Bike Type | Conventional/Traditional Bicycles |
| Electric Bicycles (Pedelec, Speed-Pedelec) | |
| By Sharing System | Docked |
| Dockless | |
| Hybrid (Station-plus-Free-Floating) | |
| By Booking Type | App-Based/Online |
| Kiosk/Walk-Up | |
| By User Profile | Commuters |
| Tourists & Leisure Users | |
| Delivery/Gig Workers | |
| By Payment Model | Pay-As-You-Go |
| Subscription / Membership | |
| By Fleet Ownership Model | Municipal-Owned |
| Private-Operator-Owned | |
| Public–Private Partnership | |
| By Country | Germany |
| United Kingdom | |
| France | |
| Italy | |
| Spain | |
| Netherlands | |
| Belgium | |
| Rest of Europe |


Key Questions Answered in the Report
How large is the Europe bike sharing market in 2026?
Europe bike sharing is valued at USD 690 million, with projections indicating a rise to USD 1.06 billion by 2031.
Which segment is growing fastest within the Europe bike sharing market?
Electric bicycles post the quickest expansion at a 9.49% CAGR, driven by longer range, policy incentives and higher ride frequency.
Why are subscriptions gaining popularity?
Corporate mobility budgets and commuters’ preference for predictable costs are pushing subscription plans, which grow at a 8.91% CAGR while improving operator cash flows.
What is the major regulatory catalyst for bike sharing growth?
The rollout of ultra-low-emission zones in cities such as Amsterdam, Paris and London is steering users toward zero-emission mobility, directly benefitting bike sharing services.
Which European country is expanding most rapidly?
The United Kingdom leads with a 9.33% CAGR through 2031, underpinned by London’s expanded cycling network and supportive enforcement policies.
How are operators tackling vandalism and theft?
They deploy reinforced bike designs, geo-fenced parking, community-reward reporting and AI-based tracking to curb losses and uphold service reliability.
Page last updated on:


