Servo Drives Market Size and Share
Market Overview
| Study Period | 2020 - 2031 |
|---|---|
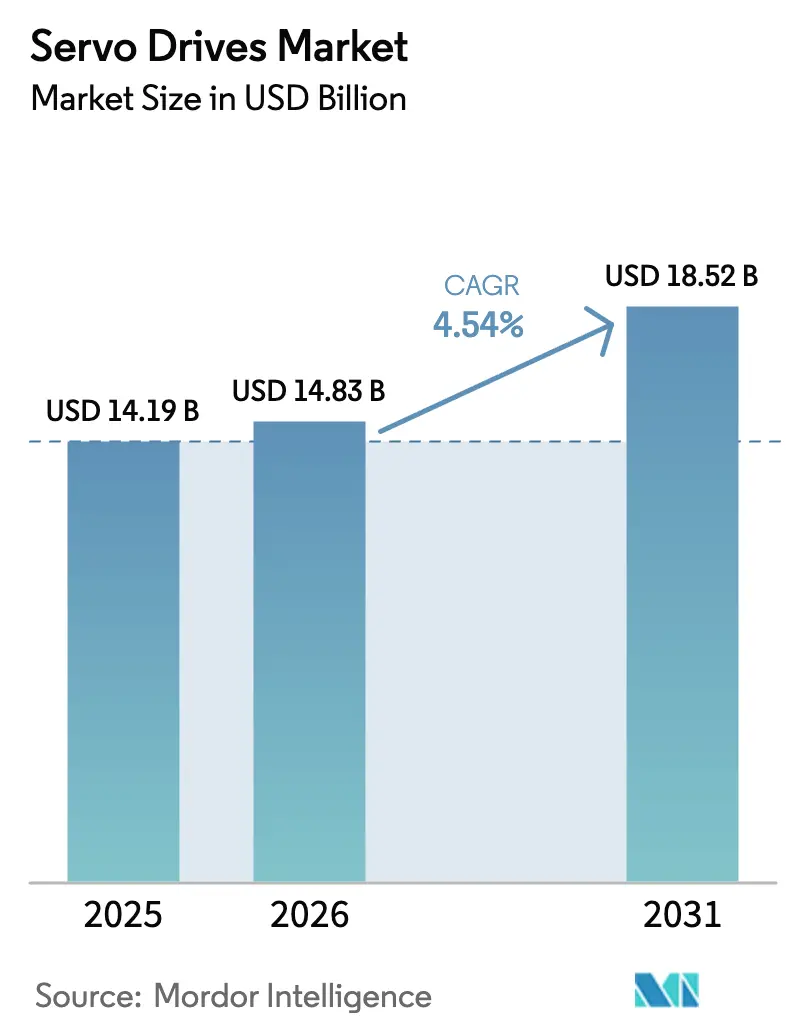
| Market Size (2026) | USD 14.83 Billion |
| Market Size (2031) | USD 18.52 Billion |
| Growth Rate (2026 - 2031) | 4.54% CAGR |
| Fastest Growing Market | Asia-Pacific |
| Largest Market | Asia-Pacific |
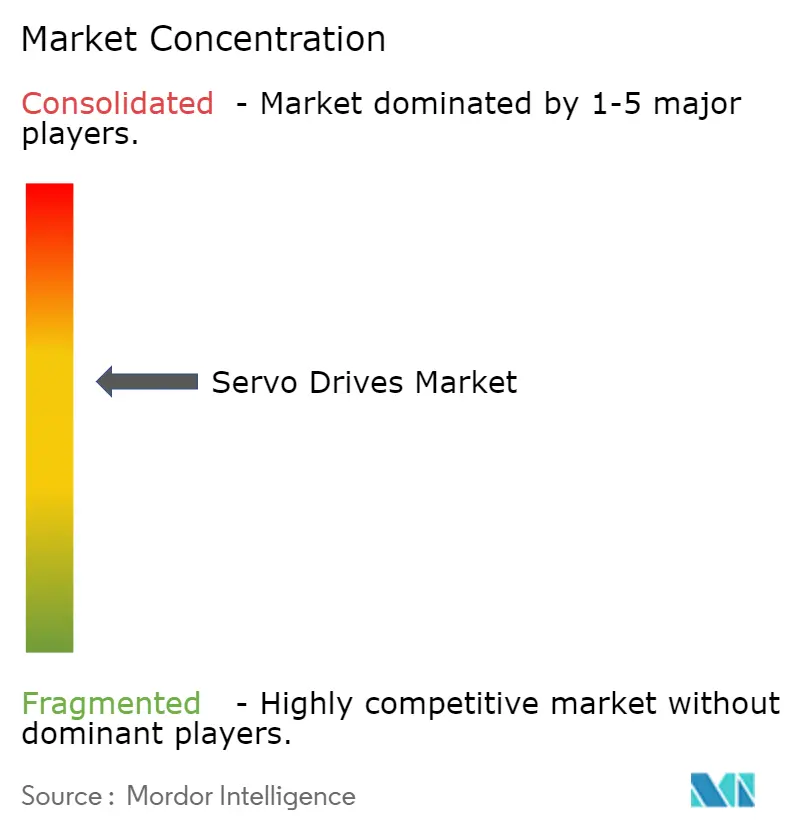
| Market Concentration | Medium |
Major Players
*Disclaimer: Major Players sorted in no particular order Image © Mordor Intelligence. Reuse requires attribution under CC BY 4.0. |
|
Servo Drives Market Analysis by Mordor Intelligence
The Servo Drives market size is expected to grow from USD 14.19 billion in 2025 to USD 14.83 billion in 2026 and is forecast to reach USD 18.52 billion by 2031 at 4.54% CAGR over 2026-2031.
The global servo drives market size stands at USD 14.19 billion in 2025 and is forecast to reach USD 18.01 billion by 2030, advancing at a 4.88% CAGR. Sustained capital spending on factory automation, rising deployment of collaborative robots and relentless semiconductor capacity additions are setting a stable demand foundation. Manufacturers are accelerating migration from legacy field-bus motion control to deterministic Industrial Ethernet, transforming servo drives into edge nodes that collect machine-level data for cloud analytics. In parallel, electric-vehicle battery and e-axle lines are scaling rapidly, pushing servo suppliers toward higher-precision, faster-response solutions suited to clean-room assembly. Industry players are also navigating new tariff regimes and component shortages by diversifying supply chains and adding regional assembly capacity, a shift that opens room for both global incumbents and agile regional challengers.
Key Report Takeaways
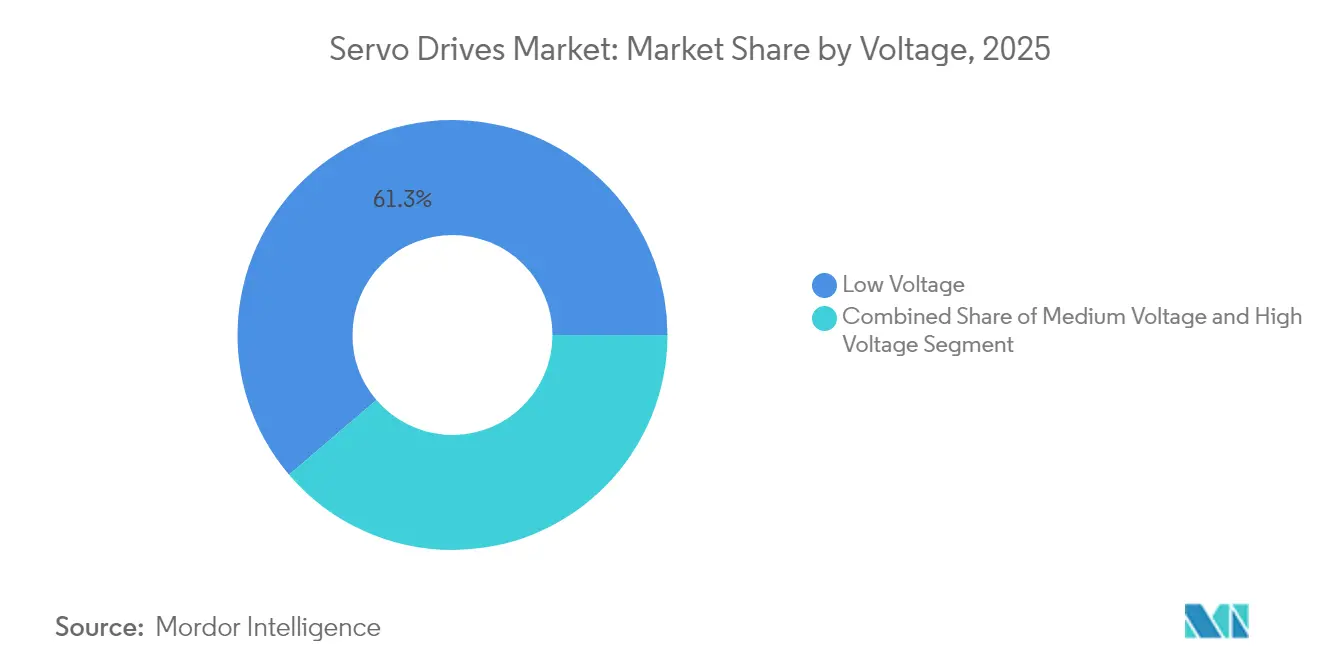
- By voltage, low-voltage (<690 V) systems held 61.25% of servo drives market share in 2025; the segment is tracking a 4.78% CAGR through 2031.
- By motor type, AC architectures led with 76.05% revenue share in 2025, while linear servo systems are poised for the fastest 5.82% CAGR.
- By power output, 5-15 kW units captured the highest growth trajectory at 5.35% CAGR, whereas sub-1 kW products retained 44.25% of the 2025 servo drives market size.
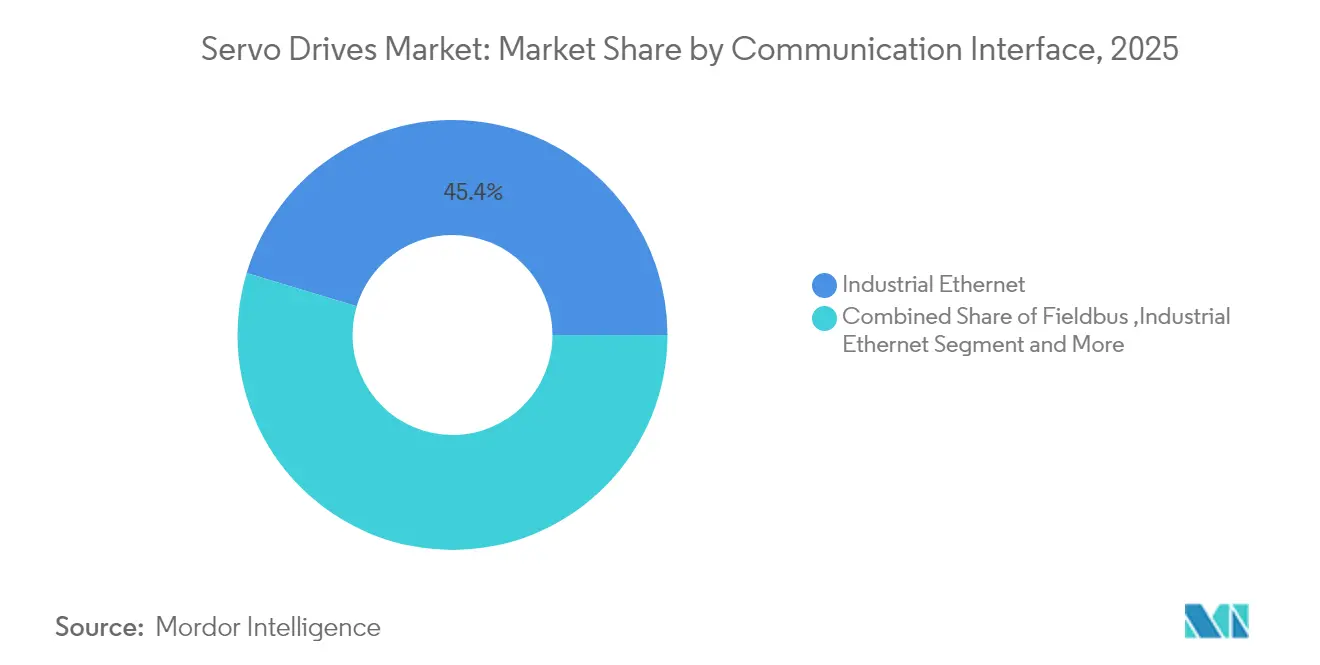
- By communication interface, Industrial Ethernet dominated with 45.35% share in 2025; EtherCAT plus TSN are expanding at 6.68% CAGR.
- By end-user industry, discrete manufacturing represented 40.55% share in 2025; robotics and cobots applications are rising at 4.92% CAGR.
- By application, robotics commanded 37.65% of 2025 revenues and is growing 5.55% annually to 2031.
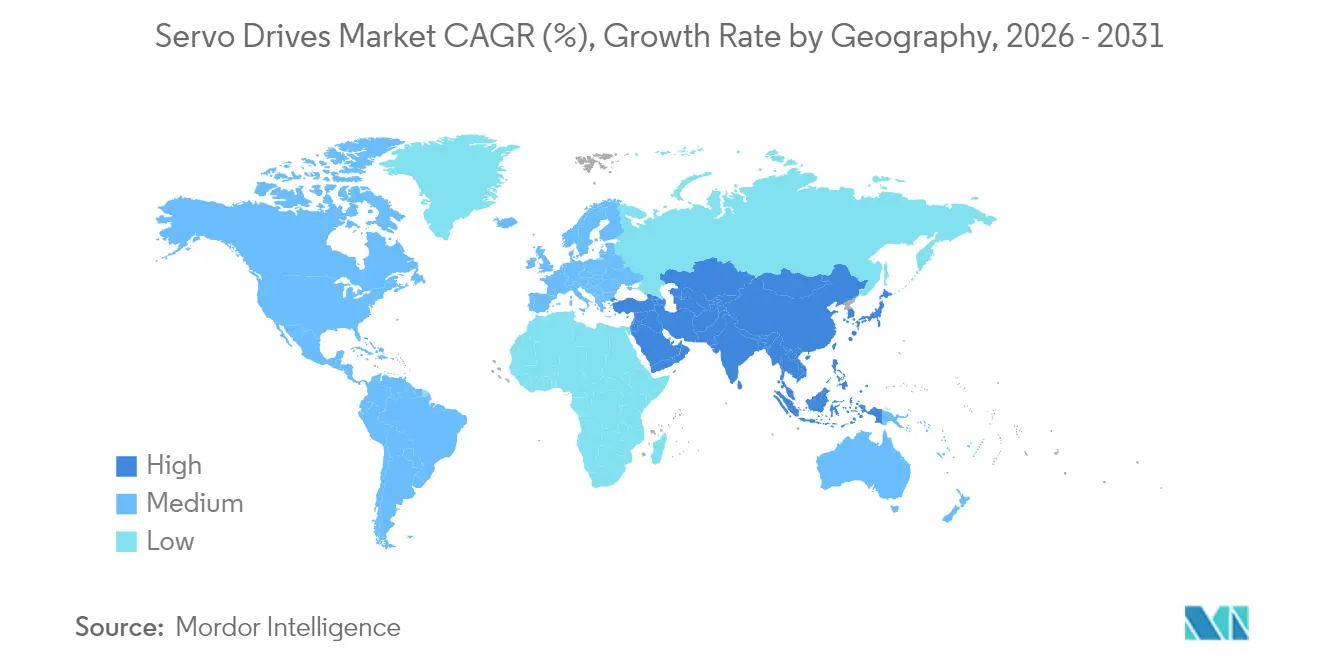
- By geography, Asia-Pacific led with 46.15% 2025 share and is advancing at a 5.87% CAGR.
Note: Market size and forecast figures in this report are generated using Mordor Intelligence’s proprietary estimation framework, updated with the latest available data and insights as of 2026.
Global Servo Drives Market Trends and Insights
Drivers Impact Analysis*
| Driver | (%) Impact on CAGR Forecast | Geographic Relevance | Impact Timeline |
|---|---|---|---|
| Industrial automation & Industry 4.0 uptake | +1.8% | Global; APAC spearheads | Medium term (2-4 years) |
| Electric-vehicle manufacturing expansion | +1.2% | APAC core; spill-over to NA & EU | Medium term (2-4 years) |
| Robotics & collaborative-robot integration | +0.9% | Global; focused in production hubs | Long term (≥ 4 years) |
| Semiconductor equipment automation | +0.7% | APAC core; NA secondary | Short term (≤ 2 years) |
| Energy-efficiency & sustainability mandates | +0.6% | EU leads; global adoption | Medium term (2-4 years) |
| Packaging-machinery automation growth | +0.5% | Global; fueled by e-commerce | Short term (≤ 2 years) |
| Source: Mordor Intelligence | |||
Industrial Automation and Industry 4.0 Adoption
Servo drives are now designed as data-rich, networked devices that feed production metrics into AI tools. Mitsubishi Electric’s multi-protocol connectivity enables instant OPC UA, EtherCAT and CC-Link-IE-TSN interoperability, letting factory operators build condition-monitoring dashboards without extra gateways.[1]Mitsubishi Electric Corporation, “A Toast to Open Connections: How Servo Systems Can Benefit from OPC UA, EtherCAT and CC-Link-IE-TSN,” mitsubishielectric.comSiemens has introduced AI agents that recalibrate motion parameters in real time and boost line productivity by up to 50%.[2]Siemens AG, “Siemens Introduces AI Agents for Industrial Automation,” siemens.comSuch advances are pushing vendors to shift from one-off hardware sales toward recurring, outcome-based service contracts that monetize uptime and energy savings.
Electric Vehicle Manufacturing Expansion
Battery-cell stacking, laser welding and e-axle assembly all rely on micron-level accuracy. EV plants therefore specify servo drives with faster response times and tighter speed ripple. Growing Asian supply-chain hubs—supported by Taiwanese platform developers—are creating concentrated demand for compact, high-performance units that integrate seamlessly with automated guided vehicles on battery lines. Suppliers capable of meeting these high-throughput, clean-room standards are securing multi-year preferred-vendor agreements with global carmakers.
Robotics and Collaborative Robot Integration
Collaborative robots require torque-sensing, integrated-safety drives that can detect human proximity and instantly limit force. As humanoid-robot R&D accelerates, Chinese firms seeking cost-effective solutions are partnering with drive makers that can embed control electronics inside lightweight servo actuators. Rockwell Automation’s tie-up with autonox illustrates how joint controller-drive offerings are shortening deployment times for robot integrators.
Semiconductor Equipment Automation
Wafer handlers and lithography stages demand sub-micron positioning and extreme thermal stability. The CHIPS Act is funnelling grants that anchor new fabs in the United States, opening fresh domestic orders for premium servo drives with nanometer-grade encoders and low-drift feedback loops.[3]Semiconductor Industry Association, “2024 State of the U.S. Semiconductor Industry,” semiconductors.org
Restraints Impact Analysis*
| Restraint | (%) Impact on CAGR Forecast | Geographic Relevance | Impact Timeline |
|---|---|---|---|
| High initial investment & integration cost | -0.8% | Global; hits SMEs hardest | Short term (≤ 2 years) |
| Supply-chain disruption & component scarcity | -0.6% | Global; acute in APAC | Medium term (2-4 years) |
| Skilled-workforce shortage | -0.5% | Developed markets | Long term (≥ 4 years) |
| Rapid technology obsolescence | -0.4% | All regions | Medium term (2-4 years) |
| Source: Mordor Intelligence | |||
High Initial Investment and Integration Complexity
Small manufacturers often postpone automation because servo solutions require dedicated cabling, environmental conditioning and PLC integration. Retrofitting legacy machines also needs specialised engineering, lengthening payback periods. India’s automotive system-innovation survey highlights shortage of turnkey providers that can bundle financing, training and maintenance into a single package—a gap global vendors are beginning to address through subscription models and cloud-hosted diagnostics.
Supply Chain Disruptions and Component Shortages
Encoder ICs and power semiconductors remain vulnerable to geopolitical tariffs. Drive makers are relocating final assembly closer to end markets and dual-sourcing key ASICs. ABB, for example, is expanding a U.S. motion-control line to cut lead times for North-American customers. While these moves cushion immediate shocks, they raise capital-expenditure burdens and can squeeze margins until volumes scale.
*Our forecasts treat driver/restraint impacts as directional, not additive. The impact forecasts reflect baseline growth, mix effects, and variable interactions.
Segment Analysis
By Voltage: Low-Voltage Systems Anchor Growth
Low-voltage units held 61.25% of 2025 revenues and are tracking a 4.78% CAGR through 2031, underpinned by safety rules that cap working voltages on assembly floors. Distributed architectures using multiple compact drives are displacing single high-power cabinets, improving machine modularity and service access. The servo drives market size for sub-690 V products expands further as EU IE2 efficiency mandates stimulate retrofit activity. Rockwell Automation’s IP66-rated ArmorKinetix illustrates how machine builders can eliminate control cabinets and cut cabling by 90%.
Medium- and high-voltage segments remain specialised, serving metals, mining and marine propulsion. Yet stronger silicon-carbide switching devices are nudging efficiency upward, hinting at a longer-term pivot to mid-range 690 V-3.3 kV platforms in energy-intensive industries. Suppliers that bundle regenerative braking and active-front-end functionality will win as plants seek grid-harmonic compliance without extra filters.


By Motor Type: AC Designs Dominate, Linear Drives Accelerate
AC servo systems captured 76.05% of 2025 revenue. Their brushless construction delivers higher power density and near-maintenance-free operation, an advantage magnified by tightening labour pools. Yaskawa’s latest AC lineup adds built-in data-collection channels so users can stream torque signatures into AI dashboards.
Linear drives, while still niche, are clocking the fastest 5.82% CAGR. They remove screw-belt conversions, eliminating backlash and achieving sub-micron repeatability critical for semiconductor pick-and-place and dental-milling machines. The servo drives market share for linear configurations therefore rises steadily as fabs and medical OEMs prioritise cleanliness and positional accuracy.
By Power Output: Mid-Range 5-15 kW Gains Momentum
Under-1 kW products served 44.25% of 2025 demand, powering electronics assembly and lab automation where footprint and efficiency trump raw force. Yet the 5-15 kW band is expanding at 5.35% CAGR, propelled by EV battery-pack handling systems that need more torque without sacrificing responsiveness. Lenze’s IE5/IE7 platform slashes motor losses by 60%, enabling higher power in compact frames suited to this mid-tier segment.
Above 30 kW, mining and metals projects continue to demand ruggedised drives. However, order cycles are long and tied to commodity prices, moderating growth compared with agile mid-range applications.
By Communication Interface: EtherCAT and TSN Steer Digitalisation
Industrial Ethernet commanded 45.35% share in 2025, yet the servo drives market is clearly pivoting to EtherCAT plus TSN, rising 6.68% annually. EtherCAT processes telegrams on the fly, permitting up to 65,535 nodes with micro-second latency-ideal for multi-axis synchronisation in packaging lines. TSN extensions bridge information-technology and operational-technology traffic on a single cable, aligning motion networks with enterprise-wide analytics strategies.
Analog-pulse and legacy field-bus interfaces retain footholds in cost-sensitive retrofits but are gradually phased out as OEMs standardise on Ethernet backbones to enable predictive maintenance.
By End-User Industry: Discrete Manufacturing Leads, Robots Surge
Discrete manufacturing accounted for 40.55% of 2025 revenue on the back of widespread automotive and electronics assembly. Yet collaborative-robot lines, warehouse automation and service-sector uses are tipping share toward the robotics segment, which is advancing at 4.92% CAGR. Servo drives market size devoted to robot joints will therefore rise alongside humanoid R&D, especially in China where start-ups are piloting low-cost torque-dense actuators.
Process industries adopt servo technology more cautiously, prioritising reliability over maximum dynamic performance. Nonetheless, higher demand for sanitary, flexible recipes in food processing gradually lifts penetration rates.
By Application: Robotics Claim the Spotlight
Robotics applications secured 37.65% 2025 share and are growing at 5.55% CAGR. Drives with integrated safety, torque sensing and hollow-shaft designs enable lightweight arm architectures suitable for cobots. Rockwell and Comau’s co-control platform shows how unified programming reduces commissioning time for mixed motion-robot cells.
CNC and metal-cutting uses remain core but mature, while semiconductor equipment commands premium ASPs thanks to stringent accuracy demands. Conveyor and material-handling segments benefit from e-commerce fulfilment build-outs, calling for high-speed indexing and zero-downtime requirements.
Geography Analysis
Asia-Pacific held 46.15% share in 2025 and is accelerating at 5.87% CAGR. China’s servo-motor revenues are set to top RMB 40 billion by 2025, with domestic supplier Inovance already capturing 28.3% share against multinational rivals. Government incentives for high-end equipment, plus aggressive robot adoption at 350 units per 10,000 workers, maintain a virtuous circle where local drive production scales rapidly. India’s Production-Linked Incentive scheme is likewise spurring fresh servo investment in electronics and battery manufacturing.
North America is maturing but strategically vital. CHIPS-Act incentives worth USD 39 billion are underwriting new fabs that will demand ultra-precise drive technology. Tariffs up to 50 % on certain components push OEMs to source regionally, and ABB has already increased U.S. servo-motor output to hedge geopolitical risk.
Europe retains strong engineering know-how and tight energy-efficiency legislation. The EU Ecodesign Directive drives early adoption of IE2-plus variable-speed drives, opening retrofitting opportunities. Bosch’s carbon-neutral factories and remanufacturing programs illustrate a life-cycle ethos that rewards vendors able to refurbish installed bases. Meanwhile, the European Chips Act aims to double regional semiconductor output by 2030 but faces funding hurdles that temper near-term volume prospects.
Other regions, including Latin America and the Middle East, remain nascent but attractive for long-term growth as logistics automation and food-processing investments pick up. Vendors with scalable service networks and multi-language diagnostic tools gain early-mover benefits.

Competitive Landscape
The market shows moderate consolidation, with the top five vendors estimated near 55 % combined share. ABB plans to spin off its Robotics division to sharpen focus on motion products, while Honeywell is unbundling into three units, including Industrial Automation, to streamline capital allocation. These restructurings hint at broader portfolio realignments as companies chase higher-growth, software-infused earnings streams.
Technology convergence is reshaping competitive moats. Siemens embeds AI optimisation in drives; Mitsubishi Electric delivers multi-protocol connectivity; Inovance leverages cost leadership and rapid customisation for Chinese OEMs. Smaller German and Japanese specialists focus on torque-dense, hollow-shaft designs for humanoid robots, carving lucrative niches despite lower volumes.
Strategic alliances multiply. Rockwell pairs drives with Comau robotics; Parker-Hannifin upgrades explosion-proof servo motors to IECEx standards, addressing oil-and-gas brownfield automation. Suppliers are also investing in regional manufacturing and digital twins that ensure quick design-win cycles for machine-builder customers. Those that couple hardware with cloud-based analytics and condition-monitoring services are achieving double-digit service-revenue growth.
Servo Drives Industry Leaders
-
Danfoss
-
Rockwell Automation Inc.
-
Schneider Electric
-
Siemens AG
-
ABB
- *Disclaimer: Major Players sorted in no particular order

Recent Industry Developments
- February 2025: Mitsubishi Electric launched open-network servo solutions supporting OPC UA, EtherCAT and CC-Link-IE-TSN, simplifying AI-driven optimisation workflows.
- February 2025: ABB reported USD 7.8 billion Motion revenues for 2024; more than half of its R&D staff concentrate on digital-solution enhancements.
- January 2025: Parker-Hannifin expanded certification of EY/EX servo motors for explosive zones, addressing heightened safety demand.
- December 2024: Inovance Technology opened a Beijing subsidiary with RMB 300 million capital to accelerate robotics-ready drive R&D
- November 2024: Lenze released IE5/IE7 drives delivering 60 % lower motor losses for intralogistics and packaging


Research Methodology Framework and Report Scope
Market Definitions and Key Coverage
Our study defines the global servo drives market as the sale of closed-loop electronic power amplifiers that modulate current or voltage to control AC, DC, or linear servo motors used for precise position, speed, or torque regulation across industrial and commercial machinery. Hardware covered spans sub-1 kW micro-drives up to >30 kW cabinets and includes embedded feedback and networking interfaces.
Scope exclusion: retrofit repair services and discrete motion controllers without an integrated power stage are outside the current valuation.
Segmentation Overview
-
By Voltage
- Low ( Below 690 V)
- Medium (690 V-3.3 kV)
- High (Above 3.3 kV)
-
By Motor Type
- AC Servo Drives
- DC Servo Drives
- Linear Servo Drives
-
By Power Output
- Below 1 kW
- 1-5 kW
- 5-15 kW
- 15-30 kW
- Above 30 kW
-
By Communication Interface
- Analog/Pulse
- Fieldbus (CANopen, PROFIBUS, DeviceNet)
- Industrial Ethernet (EtherNet/IP, PROFINET, Modbus-TCP)
- EtherCAT and Time-Sensitive Networking
-
By End-user Industry
- Discrete Manufacturing
- Automotive
- Electronics and Semiconductor
- Machine Tools
- Robotics and Cobots
- Packaging Machinery
- Process Industries
- Oil and Gas
- Chemical and Petrochemical
- Food and Beverage
- Water and Wastewater
- Power Generation
- Pulp and Paper
- Metal and Mining
- HVAC and Building Automation
-
By Application
- CNC and Metal-cutting
- Robotics
- Conveyors and Material Handling
- Automated Packaging Lines
- Semiconductor Equipment
- Printing and Textile Machinery
-
Geography
-
North America
- United States
- Canada
- Mexico
-
South America
- Brazil
- Argentina
- Chile
- Rest of South America
-
Europe
- United Kingdom
- Germany
- France
- Italy
- Russia
- Rest of Europe
-
Asia-Pacific
- China
- India
- Japan
- South Korea
- Australia and New Zealand
- Rest of Asia-Pacific
-
Middle East and Africa
- Middle East
- Saudi Arabia
- United Arab Emirates
- Turkey
- Rest of Middle East
-
Africa
- South Africa
- Nigeria
- Egypt
- Rest of Africa
-
North America
Detailed Research Methodology and Data Validation
Primary Research
Analysts interviewed plant engineers, automation OEM product managers, and regional distributors across Asia-Pacific, Europe, and North America. These discussions validated duty-cycle assumptions, price dispersion, and emerging demand pockets (cobots, battery cell lines), and they helped us calibrate gray-area estimates from secondary data.
Desk Research
We gathered foundational data from open-access authorities such as the International Federation of Robotics, UN Comtrade customs shipments, Japan Machine Tool Builders Association, and Eurostat industrial production series, which anchor drive volumes and trade flows. Company 10-Ks, investor decks, and press releases supplied average selling prices, while technical papers in IEEE Xplore and patents accessed through Questel highlighted emerging Ethernet-based control protocols and efficiency mandates. Paid sources like D&B Hoovers and Dow Jones Factiva filled financial or M&A gaps. The sources listed are illustrative; many additional publications and databases informed the desk phase.
In parallel, longitudinal indices, for example, global PMI flashes, semiconductor CAPEX trackers, and EV assembly line additions, were mapped to historical servo drive shipments, giving us trend elasticity that feeds the model.
Market-Sizing & Forecasting
We start with a top-down rebuild that aligns global industrial fixed-asset investment, robotics unit installs, and machine-tool output with observed drive penetration rates. Results are cross-checked through sampled bottom-up roll-ups of leading supplier revenues and channel checks before adjustments. Key variables like average drive ASP, low-voltage share, robot install base, semiconductor equipment orders, and regional energy-efficiency regulations drive our multivariate regression forecast, which extends to 2030. Where supplier data are missing, gaps are bridged using weighted regional shipment ratios derived from customs records.
Data Validation & Update Cycle
Every quarter, our analysts stress-test the model against fresh import data, price trackers, and public earnings. Variances beyond preset thresholds trigger re-contacts with sources, followed by internal peer review. The report is fully refreshed annually, with interim revisions when material events occur.
Why Mordor's Servo Drives Baseline Stands Out for Decision Makers
Published figures often diverge because firms choose dissimilar voltage bands, bundle motors with drives, or freeze currency at different points in the year. We flag these variables upfront so readers grasp why totals vary.
Key gap drivers include: some publishers omit medium-voltage cabinets, others assume constant ASP erosion, and a few project volumes from robotics alone without linking to broader discrete manufacturing. Mordor Intelligence reports the full drive spectrum, applies rolling exchange rates, and refreshes the model each year, which narrows error bands and improves usability.
Benchmark comparison
| Market Size | Anonymized source | Primary gap driver |
|---|---|---|
| USD 14.19 B (2025) | Mordor Intelligence | - |
| USD 2.30 B (2024) | Industry Consultancy A | Focus on sub-5 kW digital units only |
| USD 6.20 B (2024) | Regional Consultancy B | Excludes Asia-Pacific medium-voltage segment |
| USD 10.25 B (2024) | Trade Journal C | Uses fixed 2019 ASP with no inflation adjustment |
In short, our disciplined scoping, variable selection, and yearly refresh give clients a balanced baseline they can trace back to public indicators and firsthand insights, making strategic planning far more dependable.


Key Questions Answered in the Report
What is the current size of the servo drives market?
The servo drives market is valued at USD 14.83 billion in 2026 and is projected to reach USD 18.52 billion by 2031.
Which voltage class dominates the servo drives market?
They deliver deterministic micro-second-level synchronisation and merge operational-technology and IT traffic on a single network, essential for Industry 4.0 analytics.
Which application segment is growing fastest?
Robotics applications show the highest 5.55% CAGR thanks to soaring demand for collaborative and humanoid robots.
Why are EtherCAT and TSN gaining popularity in servo drives?
They deliver deterministic micro-second-level synchronisation and merge operational-technology and IT traffic on a single network, essential for Industry 4.0 analytics.
How are trade tariffs affecting servo drive supply chains?
Tariffs on imported semiconductors and motion components are prompting manufacturers to add regional assembly lines and dual-source critical chips, increasing near-term costs but improving resilience.
What role do energy-efficiency mandates play in drive adoption?
EU Ecodesign rules and corporate carbon targets push plants to replace legacy motors with IE2-plus variable-speed drives, accelerating retrofit projects and favouring vendors with high-efficiency portfolios.
Page last updated on:


