Serverless and Container Sustainability Software Market Size and Share
Market Overview
| Study Period | 2020 - 2031 |
|---|---|
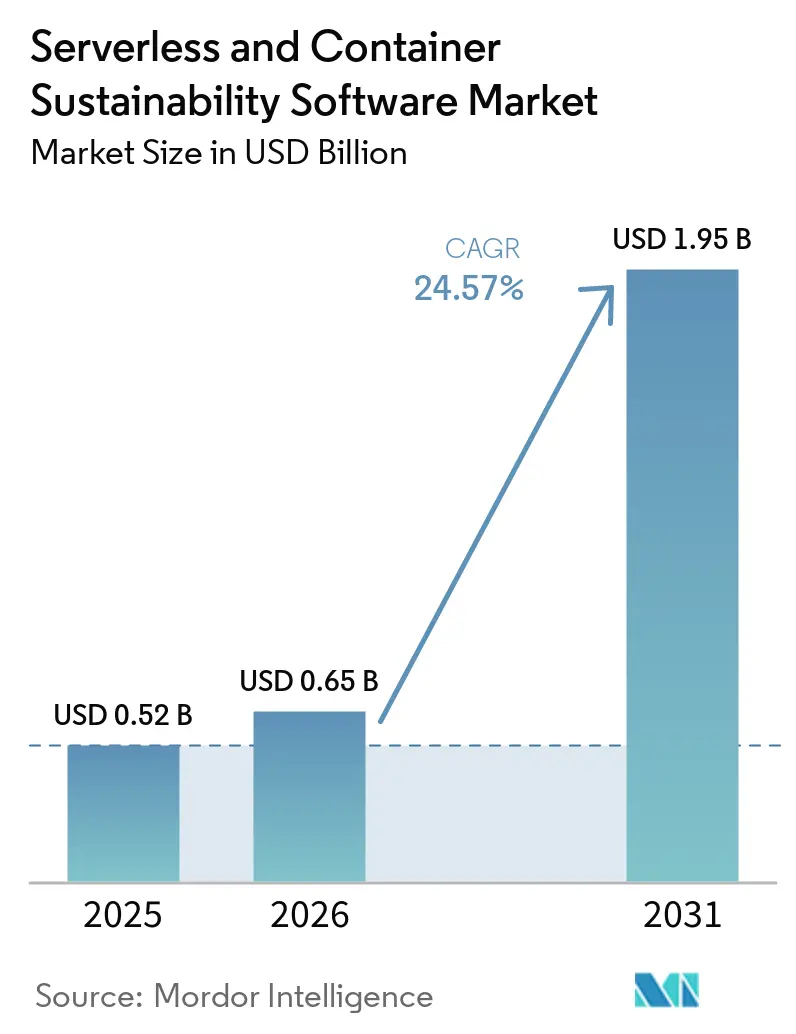
| Market Size (2026) | USD 0.65 Billion |
| Market Size (2031) | USD 1.95 Billion |
| Growth Rate (2026 - 2031) | 24.57% CAGR |
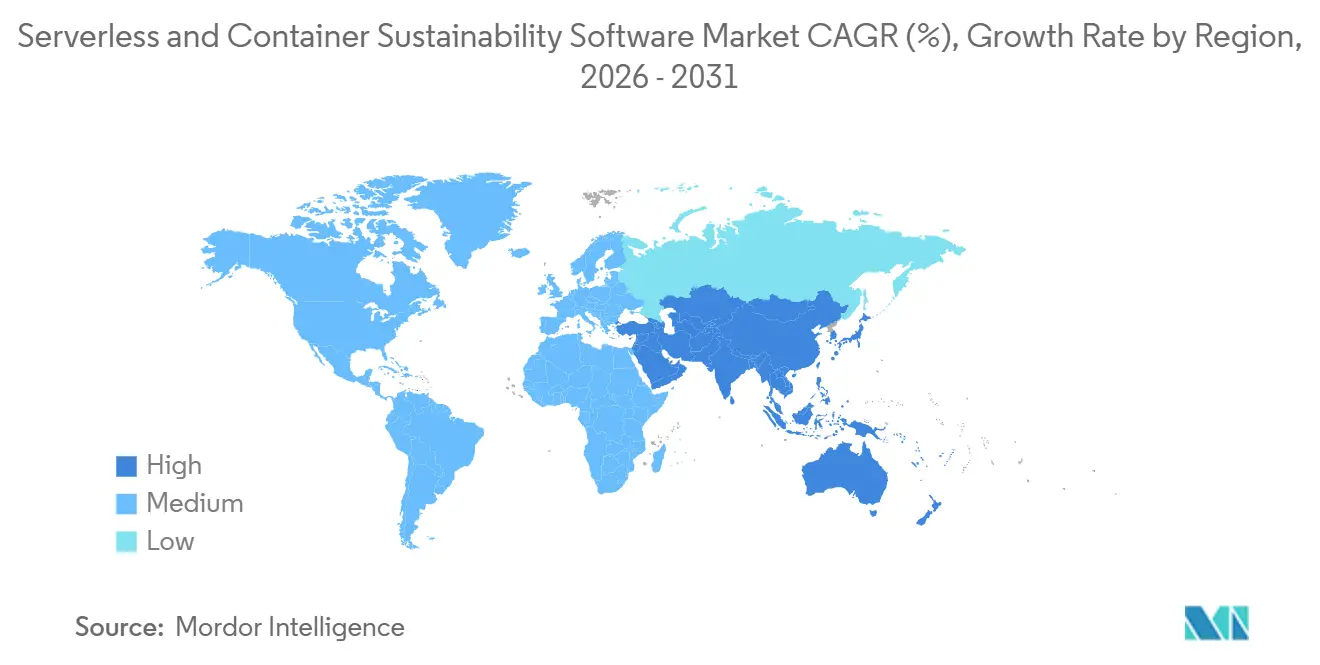
| Fastest Growing Market | Asia-Pacific |
| Largest Market | North America |
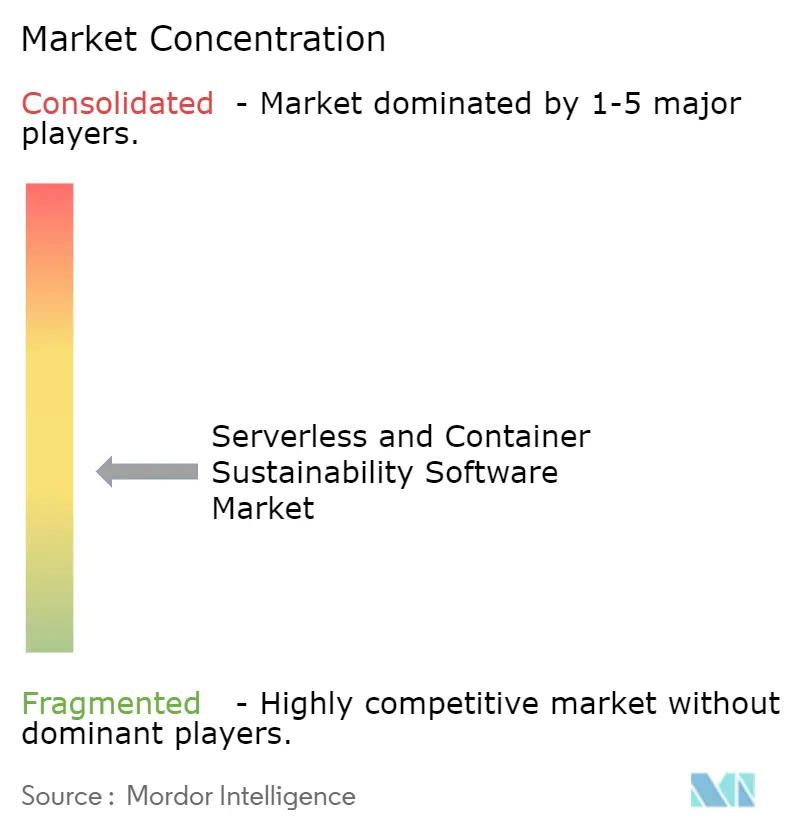
| Market Concentration | Medium |
Major Players *Disclaimer: Major Players sorted in no particular order Image © Mordor Intelligence. Reuse requires attribution under CC BY 4.0. | |
Serverless and Container Sustainability Software Market Analysis by Mordor Intelligence
The serverless and container sustainability software market size was valued at USD 0.52 billion in 2025 and estimated to grow from USD 0.65 billion in 2026 to reach USD 1.95 billion by 2031, at a CAGR of 24.57% during the forecast period (2026-2031). Growth is being supported by the way cloud cost control and sustainability measurement are moving into the same operating workflow across cloud-native enterprises. Workload-level carbon data is now treated more like a live operational input than a year-end reporting exercise, because engineering teams increasingly need it alongside cost, utilization, and performance data. Hyperscalers are also reinforcing this shift by improving carbon attribution models for serverless workloads, making granular reporting more visible and actionable for enterprise buyers. At the same time, the market is gaining space for specialized software vendors as open-source measurement tools are devaluing basic telemetry and pushing commercial platforms toward optimization, audit support, and automated reporting services. The main short-term constraint remains the lack of a fully standardized way to assign emissions to short-lived serverless functions, while budget constraints outside regulated enterprise accounts continue to limit adoption among smaller and less mature buyer groups.
Key Report Takeaways
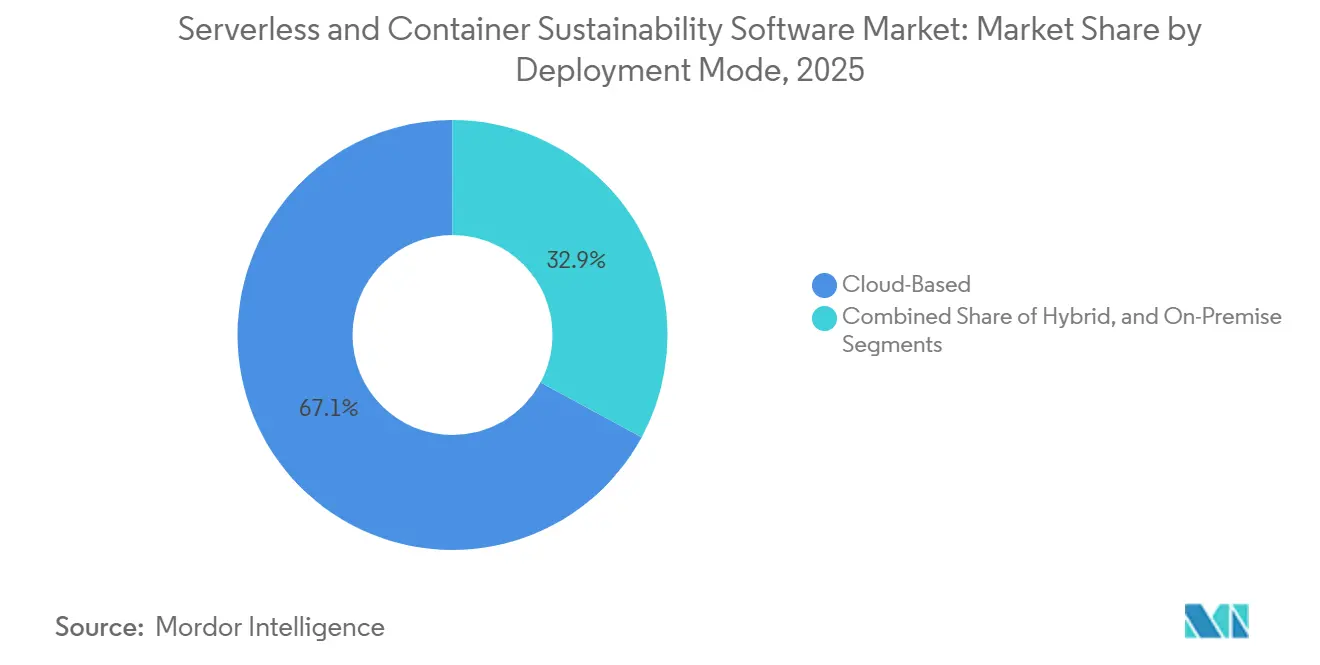
- By deployment mode, cloud-based deployments held 67.12% of the serverless and container sustainability software market share in 2025, while hybrid deployments are projected to expand at a 25.34% CAGR through 2031.
- By component, software captured 72.12% of the serverless and container sustainability software market in 2025, while services are projected to grow at a 26.12% CAGR through 2031.
- By enterprise size, large enterprises accounted for 64.85% of the market in 2025, while SMEs are expected to expand at a 25.89% CAGR through 2031.
- By end-user industry, IT and Telecom held 26.41% of the market in 2025, while Retail and Consumer Goods are projected to advance at a 24.92% CAGR through 2031.
- By geography, North America retained 34.56% of the total market share in 2025, while Asia-Pacific is projected to record the highest CAGR at 27.45% through 2031.
Note: Market size and forecast figures in this report are generated using Mordor Intelligence’s proprietary estimation framework, updated with the latest available data and insights as of January 2026.
Global Serverless and Container Sustainability Software Market Trends and Insights
Drivers Impact Analysis*
| Driver | (~) % Impact on CAGR Forecast | Geographic Relevance | Impact Timeline |
|---|---|---|---|
| Rising Scope 3 Reporting Pressure on Cloud-Native Workloads | +5.2% | Global, with early intensity in North America and EU | Short term (≤ 2 years) |
| FinOps and GreenOps Convergence in Kubernetes Operations | +4.3% | Global, with APAC and North America as primary adoption centers | Medium term (2-4 years) |
| EU CSRD and Digital Reporting Readiness for Cloud Operations | +4.0% | Europe primary, with spillover to APAC and North America multinationals | Short term (≤ 2 years) |
| Serverless Pricing Transparency Improving Sustainability Buy-In | +3.1% | North America and Western Europe | Medium term (2-4 years) |
| Carbon-Aware Scheduling Demand Across Multi-Cloud Estates | +2.6% | North America, Europe, and advanced APAC cloud markets | Medium term (2-4 years) |
| Automated Telemetry Integration With Cloud Observability Stacks | +2.2% | Global, concentrated in cloud-mature enterprise clusters | Long term (≥ 4 years) |
| Source: Mordor Intelligence | |||
Rising Scope 3 Reporting Pressure on Cloud-Native Workloads
Cloud operations are becoming harder for large enterprises to avoid in formal emissions reporting, which is driving demand across the serverless and container sustainability software markets. The revised CSRD framework published by the Council of the European Union in February 2026 applies to companies with more than 1,000 employees and a turnover above EUR 450 million, which the user draft converted to USD 508.5 million, and this continues to put pressure on enterprises to improve the quality of their digital sustainability disclosures.[1]Council of the European Union, “Council Signs Off Simplification of Sustainability Reporting and Due Diligence Requirements to Boost EU Competitiveness,” Council of the European Union, consilium.europa.eu AWS also expanded the operational relevance of cloud emissions data by introducing a unified Sustainability Console that consolidated Scope 1, Scope 2, and Scope 3 reporting into a single place for cloud customers. Once cloud providers make this data available, enterprises still need software that can allocate and audit it at the Kubernetes namespace or serverless function level, and that is where specialized platforms continue to win budget. This creates a pull-through effect, where hyperscaler reporting maturity does not replace third-party tools but instead increases the need for software that makes the data usable across engineering and compliance teams. It also strengthens demand in regulated sectors where audit readiness matters as much as carbon visibility.
FinOps and GreenOps Convergence In Kubernetes Operations
The serverless and container sustainability software market is also being shaped by the convergence of cloud cost governance and carbon management into a single day-to-day discipline. The FinOps Foundation formalized Cloud Sustainability as a framework capability in its 2026 update, thereby recognizing GreenOps as a recognized operating area rather than an informal extension of sustainability work.[2]AWS, “Announcing the AWS Sustainability Console, Programmatic Access, Configurable CSV Reports, and Scope 1-3 Reporting in One Place,” AWS News Blog, aws.amazon.com In Kubernetes environments, pod-level utilization data already used for rightsizing can also support carbon attribution, reducing the need for separate measurement stacks and making adoption easier for engineering teams. Research published in 2025 showed that carbon-aware temporal workload shifting could lower emissions for enterprise processing loads while remaining within configured service limits. This matters commercially because FinOps teams already influence platform purchases, and their involvement shortens sales cycles for software that combines cost and carbon controls. It also favors vendors that can present a single interface for cost efficiency, workload placement, and emissions performance across multi-cluster environments.
EU CSRD and Digital Reporting Readiness For Cloud Operations
European reporting rules continue to drive demand for serverless and container sustainability software, as they push enterprises toward more structured, defensible emissions data. The Council of the European Union confirmed the revised CSRD framework in February 2026, and that change kept cloud-related emissions in focus for large organizations that need formal sustainability disclosures. This has widened software demand beyond simple dashboards and into ingestion, calculation, allocation, and disclosure workflows that general ERP systems do not handle well on their own. A parallel signal came from Japan in March 2026 when NTT Group, together with NEC, Hitachi, and Fujitsu, published an expanded cradle-to-grave CO₂ calculation methodology for software products that covered procurement, development, operation, and disposal. That move extended the logic of software carbon accounting beyond entity-level reporting and closer to the workload and lifecycle level. As a result, buyers are increasingly looking for tools that can connect operational cloud data with formal sustainability reporting requirements in the same system.[3]NTT Group, “Software Lifecycle CO₂ Calculation Rules Extended to Full Lifecycle (Cradle-to-Grave),” NTT News Release, group.ntt
Serverless Pricing Transparency Improving Sustainability Buy-In
Serverless economics are helping the serverless and container sustainability software market by enabling billing transparency, making carbon waste easier to explain within the enterprise. A 2025 peer-reviewed study found that serverless platforms reached 80-90% CPU utilization compared with 60-70% for virtual-machine-based systems, and it documented case evidence of 50% energy reductions through lower idle capacity. That cost and efficiency linkage gives CIOs and engineering leaders a clearer case for funding carbon measurement tools, since wasted compute can be framed as both a financial and an emissions problem. The Green Software Foundation also showed how very high invocation volumes can make small attribution errors meaningful, noting controlled-condition measurements of 0.305 grams of CO₂e per request for 1 million function invocations. This is important because it raises the value of platforms that can measure at the function level rather than only at the aggregate service level. It also supports commercial demand for analytics that can tie optimization actions directly to both carbon and cloud spend outcomes.
Restraints Impact Analysis*
| Restraint | (~) % Impact on CAGR Forecast | Geographic Relevance | Impact Timeline |
|---|---|---|---|
| Incomplete Emissions Attribution for Ephemeral Serverless Execution | -2.1% | Global, most acute in hyperscaler-dominant markets, including North America and Western Europe | Short term (≤ 2 years) |
| Limited Standardization of Workload-Level Carbon Methodologies | -1.8% | Global, affecting all geographies attempting cross-cloud reporting | Medium term (2-4 years) |
| Low Budget Priority Outside Regulated Enterprise Accounts | -1.3% | South America, Africa, and mid-market segments globally | Medium term (2-4 years) |
| Data Quality Gaps Across Multi-Cloud And Hybrid Telemetry Sources | -0.9% | APAC hybrid deployments and EU multi-cloud enterprises | Long term (≥ 4 years) |
| Source: Mordor Intelligence | |||
Incomplete Emissions Attribution For Ephemeral Serverless Execution
A core limitation for the serverless and container sustainability software market is that serverless functions do not run inside stable and isolated compute boundaries. BSR noted in its Scope 3 work on software companies that comparable and consistent cloud emissions accounting remains difficult because use-phase measurement often relies on indirect assumptions rather than direct workload tracing.[4]BSR, “Accounting for Scope 3 Use-Phase Emissions for Software Companies,” BSR, bsr.org Research presented at SoCC 2024 using the FaasMeter framework improved allocation accuracy via Shapley value decomposition across concurrent function invocations, but the method also introduced computational overhead, making real-time deployment at scale harder. This leaves vendors in a difficult position, as strong claims about attribution precision can expose them to audit risk when customer outputs differ from hyperscaler methods. The problem is even sharper in regulated industries where buyers want tools that can survive assurance reviews, not just produce directional estimates. Until guidance becomes more consistent at the function level, methodological uncertainty will continue to slow procurement confidence.
Limited Standardization of Workload-Level Carbon Methodologies
The serverless and container sustainability software market also faces a clear ceiling from the lack of a common cross-cloud methodology. Cloud providers still use different attribution approaches, and that makes it hard for enterprises running Kubernetes and serverless workloads across multiple platforms to generate internally consistent inventories. BSR highlighted this broader comparability problem for software-related emissions, and the gap remains relevant because entity-level frameworks still do not define precise container-granularity allocation rules. In practice, this forces buyers to normalize data themselves before they can use it in a unified reporting workflow, and that burden falls most heavily on companies without strong in-house data engineering resources. The lack of standardization creates room for vendors with normalization capabilities, but it also limits wider adoption because non-standard outputs are harder to audit and harder to compare. That tension supports short-term differentiation, but it restrains broader market expansion until shared rules become more mature.
*Our forecasts treat driver/restraint impacts as directional, not additive. The impact forecasts reflect baseline growth, mix effects, and variable interactions.
Segment Analysis
By Deployment Mode: Cloud-First Architecture Anchors Market, Hybrid Models Expand Fastest
Cloud-based deployments held 67.12% of the serverless and container sustainability software market share in 2025, which reflected the natural benefit of placing measurement tools in the same environment as the workloads they monitor. This model reduces telemetry delay, avoids unnecessary data egress, and works more directly with cloud-provider APIs that supply emissions factors and usage information. The cloud-first architecture also aligns with how many enterprises already run serverless functions and containerized applications, making deployment faster and reducing integration friction. Hybrid deployments are projected to expand at a 25.34% CAGR through 2031 in the serverless and container sustainability software market, as regulated enterprises connect on-premises Kubernetes clusters with cloud-based analytics layers. That pattern is strongest in sectors such as healthcare and financial services, where data residency rules make full cloud centralization less practical.
On-premises deployments remained smaller, but they still carried strategic weight in government and defense environments where air-gapped infrastructure limited the use of cloud-based tools. For vendors, this means hybrid success depends on telemetry agents that can run at the edge, keep collecting data without steady cloud access, and upload records later when synchronization is allowed. The competitive split is becoming clearer: API-led platforms that pull existing hyperscaler carbon data, and instrumentation-led platforms that place collectors directly into Kubernetes clusters for more granular attribution. The first approach often wins on speed, while the second tends to matter more in multi-cloud estates with mixed container and serverless execution. As enterprise environments become more distributed, buyers are placing greater value on unified control planes that can aggregate sustainability metrics across multiple clusters and operating locations.


By Component: Software Dominates While Managed Services Grow At Premium Rates
Software captured 72.12% of the serverless and container sustainability software market in 2025, supported by demand for monitoring, analytics, optimization, dashboarding, and emissions reporting modules. This lead reflected the fact that most spending still centered on the product layer, where enterprises wanted direct visibility into container efficiency and workload-level carbon outputs. At the same time, services are projected to grow at a 26.12% CAGR through 2031 because many customers still need help configuring telemetry, normalizing multi-cloud data, and connecting outputs to formal reporting processes. Carbon-aware scheduling tools remain one of the strongest software growth areas, and CarbonFlex research published in 2025 showed a 57% reduction in emissions relative to a carbon-agnostic baseline through continuous learning over historical cluster data. Reporting tools are also rising quickly because enterprises need software that can turn engineering telemetry into disclosure-ready outputs rather than stopping at operational dashboards.
Open-source tooling is changing where vendors can defend margins. CNCF’s Kepler project continued to improve the basic measurement layer, and version 0.11.4 added GPU power metrics in February 2026 alongside its existing container and pod-level monitoring capabilities. That is pushing commercial providers toward higher-value areas such as optimization logic, multi-cloud normalization, and audit-ready reporting. The services side is also moving beyond setup work and toward managed GreenOps support, where vendors maintain telemetry, update factors, and help prepare disclosures over time. This shift should improve revenue stability for vendors because embedded service relationships are harder for customers to replace once the operational workflow is in place.
By Enterprise Size: Large Enterprises Lead In Spend, Mid-Market Closes The Gap
Large enterprises accounted for 64.85% of the serverless and container sustainability software market in 2025, underscoring how much adoption still follows formal compliance triggers and the challenges posed by large-scale cloud complexity. These buyers often operate across several business units, many cloud accounts, and large microservice estates, so the value of software increases rapidly once reporting or assurance requirements arise. Small and medium enterprises are expected to grow at a 25.89% CAGR through 2031 as cloud-native SaaS companies face rising sustainability scrutiny from customers, investors, and larger enterprise partners. This growth also reflects a market gap for lower-cost, easier-to-deploy tools that support engineering teams with limited sustainability staff. In that sense, the serverless and container sustainability software industry is beginning to widen beyond its early base of highly regulated large enterprises.
The SME opportunity has become more visible as some vendors are now building simpler offers focused on regulatory readiness and carbon reporting. Osapiens announced its EASY START portfolio in 2026 to address SME reporting requirements, including CSRD and carbon footprint management, following USD 100 million in financing in 2025 and achieving unicorn status. That move suggests vendors see a broader customer base forming outside the largest accounts. Large enterprises, however, are not buying uniformly, because some prefer specialist Kubernetes sustainability tools while others favor broader sustainability suites or embedded GreenOps functions inside existing FinOps environments. This keeps pressure on specialist vendors to integrate with larger enterprise platforms rather than relying only on standalone positioning.

By End-User Industry: IT And Telecom Sets The Benchmark As Retail Accelerates Fast
IT and Telecom held 26.41% of the serverless and container sustainability software market in 2025 because the sector already runs the kind of cloud-native architecture that these tools are built to measure. High adoption of microservices, Kubernetes clusters, and observability tooling made this sector a natural first market for vendors focused on workload-level emissions. Retail and Consumer Goods is projected to expand at a 24.92% CAGR through 2031 as e-commerce backends become more containerized and large brand ecosystems place more weight on carbon transparency. That mix of technical change and external reporting pressure is widening the addressable market for serverless and container sustainability software across customer-facing digital businesses. Industrial manufacturing and energy utilities also present solid demand because their regulatory exposure is high, and many of their IT environments combine legacy systems with modern cloud analytics.
BFSI follows a different pattern because many institutions remain more focused on financed emissions than on direct cloud operations, which limits near-term spending to infrastructure and reporting teams rather than enterprise-wide deployment. Healthcare and public sector adoption has been slower, largely because procurement cycles are longer and operating models are more constrained. Transportation and logistics are becoming more relevant as routing and warehouse systems move to containerized, event-driven architectures that create measurable serverless execution footprints. Other end-user groups, including education, media, and professional services, have mature cloud architectures in selected pockets but still limited sustainability tooling penetration. That creates a visible pool of delayed demand that is likely to emerge as disclosure expectations spread more broadly across corporate buyers.
Geography Analysis
North America held 34.56% of the serverless and container sustainability software market share in 2025, supported by early cloud maturity, high concentrations of serverless workloads, and the broader adoption of FinOps practices. California rules, such as SB 253 and SB 261, also strengthened the need for large filers to improve operational emissions visibility across cloud environments, which helped support spending on specialized software. The FinOps Foundation further reinforced regional momentum when it formally positioned GreenOps within its 2026 framework update, which gave cloud carbon optimization a clearer home inside enterprise operating models. Canada and Mexico contributed through cross-border enterprise procurement tied to U.S.-led ESG programs, even though local regulatory intensity remained lower than in the United States and the European Union. The region maintained its commercial lead, but European software vendors continued to exert pressure, as they were positioned close to buyers making CSRD-related purchasing decisions.
Europe remained the strongest regulatory demand center for the serverless and container sustainability software market because disclosure obligations pushed buyers toward systems that could connect cloud activity with formal sustainability reporting. The revised CSRD framework, confirmed in February 2026, maintained this pressure on large in-scope enterprises and supported demand for more structured emissions workflows. Germany, the United Kingdom, France, and the Netherlands stood out as the most active markets for enterprise adoption, as cloud-specific modules were increasingly evaluated alongside broader sustainability platforms. Germany-based academic work published in 2025 also reinforced the technical case for greener cloud operations by linking serverless technologies, scalable microservices, and efficient data management with measurable carbon reductions. This helped keep Europe at the center of demand for software that combines engineering telemetry with audit-ready reporting output.
Asia-Pacific is projected to expand at a 27.45% CAGR through 2031, making it the fastest-growing region in the serverless and container sustainability software market. China is a major part of that growth because listed companies are moving under stronger sustainability reporting expectations by 2026, while Singapore continues to provide a strong regional baseline for climate disclosure. India and South Korea are also contributing through rapid containerization across technology-intensive sectors, which expands the installed base that eventually needs workload-level monitoring and carbon reporting. Japan sent an important signal of standardization in March 2026 when NTT Group, NEC, Hitachi, and Fujitsu published a cradle-to-grave CO₂ calculation methodology for software products under a nationally recognized framework. South America, the Middle East, and Africa remained smaller markets, with adoption held back by implementation complexity and fewer deployment partners for Kubernetes-native tooling, although Brazil and Saudi Arabia showed the strongest regional momentum.

Competitive Landscape
The serverless and container sustainability software market remained moderately fragmented in 2026, with no single vendor controlling the full stack from workload telemetry to disclosure output. Competition was taking shape across three broad groups, including specialist carbon management platforms, larger enterprise sustainability suites, and open-source communities built around the cloud-native ecosystem. This structure kept the market active because buyers often compared deep Kubernetes telemetry with the broader reporting and assurance capabilities of enterprise sustainability platforms. Open-source pressure also mattered because it reduced the value of basic measurement features and forced commercial vendors to compete more on analytics, optimization, and workflow automation. That is why platform depth now matters more than simple carbon visibility in much of the serverless and container sustainability software market.
Several vendors used product moves in 2025 and 2026 to widen their positions. Persefoni expanded its enterprise reach in October 2025 by acquiring Diligent Corporation’s carbon accounting customer base and integrating its carbon management tools with Diligent’s governance and compliance ecosystem. Osapiens expanded its mid-market customer base in 2026 with its EASY START portfolio for SME regulatory reporting and carbon footprint management. Intelex also released its Q2 2026 product update, featuring AI-powered automation for EHS compliance workflows and expanded API endpoints, demonstrating that broader platform vendors were continuing to improve adjacent automation capabilities. These moves suggest that competition is not only about emissions measurement but also about how well vendors can integrate into broader compliance and operational software environments.
There is still meaningful white space across the serverless and container sustainability software market. One gap is precise emissions attribution for short-lived serverless functions that run at a granularity below that of many existing provider tools. Another is carbon-aware scheduling across multi-cloud Kubernetes estates where optimization must not disrupt service targets, an area supported by recent academic work on intelligent workload placement. A third is easier-to-deploy software for SMEs without dedicated DevOps or sustainability teams, which is why simpler packaging and managed services are becoming increasingly relevant. Watershed’s release of Open CEDA in May 2025 also showed that some vendors are trying to gain an advantage by building on stronger emissions data foundations rather than relying solely on front-end reporting tools. Vendors that can sit above the commoditizing measurement layer and deliver normalization, optimization, and automated disclosure are likely to have the strongest pricing power.
Serverless and Container Sustainability Software Industry Leaders
Watershed Technology, Inc.
Persefoni AI, Inc.
Plan A Sustainable Technologies GmbH
Normative AB
Greenly SAS
- *Disclaimer: Major Players sorted in no particular order

Recent Industry Developments
- March 2026: NTT Group, in collaboration with NEC, Hitachi, and Fujitsu, published a Cradle-to-Grave CO₂ calculation methodology for the full software product lifecycle - covering procurement, development, operation, and disposal - enabling workload-level carbon accounting aligned with Japan's Ministry of Economy, Trade and Industry's Carbon Footprint Guidelines. This establishes a nationally recognized standard for operational software emissions that influences enterprise sustainability software procurement in Japan.
- March 2026: SINAI Technologies released Q1 2026 platform updates focused on reducing manual data collection friction, automating ESG data ingestion, and expanding supplier engagement tools for decarbonization planning. The updates reflect a strategic orientation toward reducing sustainability team operational burden and integrating carbon management with financial planning workflows.
- October 2025: Persefoni AI acquired Diligent Corporation's carbon accounting customer base, forming a strategic partnership to integrate Persefoni's carbon management capabilities with Diligent's governance and compliance ecosystems. The deal expanded Persefoni's enterprise footprint and added a governance-layer distribution channel for its CSRD-native sustainability reporting product.
- September 2025: Watershed launched an AI-powered Product Carbon Footprint tool enabling enterprises to generate upstream product-level PCFs with material traceability and what-if procurement scenario modeling, extending the platform's Scope 3 measurement beyond spend-based approximations.


Global Serverless and Container Sustainability Software Market Report Scope
The Serverless and Container Sustainability Software market refers to platforms and services that enable organizations to measure, monitor, and optimize the environmental impact of serverless computing and containerized workloads. These solutions include container sustainability analytics, Kubernetes energy monitoring, carbon-aware scheduling, resource optimization engines, sustainability dashboards, and emissions reporting tools. By integrating sustainability intelligence into cloud-native architectures, these systems help enterprises reduce energy consumption, lower carbon footprints, and align IT operations with ESG and decarbonization goals.
The Serverless and Container Sustainability Software market report is segmented by Deployment (Cloud-Based, Hybrid, and On-Premises), Component (Software [container sustainability analytics, Kubernetes energy monitoring, carbon-aware scheduling, resource optimization engines, sustainability dashboards, emissions reporting tools], and Services), Enterprise Size (Large Enterprises, and Small and Medium Enterprises), End-user Industry (Industrial Manufacturing, Energy and Utilities, BFSI, Retail and Consumer Goods, IT and Telecom, Healthcare and Life Sciences, Government and Public Sector, Transportation and Logistics, and Other End-user Industries), and Geography (North America, South America, Europe, Asia-Pacific, Middle East, and Africa). The Market Forecasts are Provided in Terms of Value (USD).
| Cloud-Based |
| Hybrid |
| On-Premises |
| Software | Container sustainability analytics |
| Kubernetes energy monitoring | |
| Carbon-aware scheduling | |
| Resource optimization engines | |
| Sustainability dashboards | |
| Emissions reporting tools | |
| Services |
| Large Enterprises |
| Small and Medium Enterprises |
| Industrial Manufacturing |
| Energy and Utilities |
| BFSI |
| Retail and Consumer Goods |
| IT and Telecom |
| Healthcare and Life Sciences |
| Government and Public Sector |
| Transportation and Logistics |
| Other End-user Industries |
| North America | United States |
| Canada | |
| Mexico | |
| South America | Brazil |
| Argentina | |
| Rest of South America | |
| Europe | Germany |
| United Kingdom | |
| France | |
| Italy | |
| Spain | |
| Russia | |
| Netherlands | |
| Rest of Europe | |
| Asia-Pacific | China |
| Japan | |
| India | |
| South Korea | |
| Australia and New Zealand | |
| Rest of Asia-Pacific | |
| Middle East | Saudi Arabia |
| United Arab Emirates | |
| Rest of Middle East | |
| Africa | South Africa |
| Nigeria | |
| Rest of Africa |
| By Deployment | Cloud-Based | |
| Hybrid | ||
| On-Premises | ||
| By Component | Software | Container sustainability analytics |
| Kubernetes energy monitoring | ||
| Carbon-aware scheduling | ||
| Resource optimization engines | ||
| Sustainability dashboards | ||
| Emissions reporting tools | ||
| Services | ||
| By Enterprise Size | Large Enterprises | |
| Small and Medium Enterprises | ||
| By End-user Industry | Industrial Manufacturing | |
| Energy and Utilities | ||
| BFSI | ||
| Retail and Consumer Goods | ||
| IT and Telecom | ||
| Healthcare and Life Sciences | ||
| Government and Public Sector | ||
| Transportation and Logistics | ||
| Other End-user Industries | ||
| By Geography | North America | United States |
| Canada | ||
| Mexico | ||
| South America | Brazil | |
| Argentina | ||
| Rest of South America | ||
| Europe | Germany | |
| United Kingdom | ||
| France | ||
| Italy | ||
| Spain | ||
| Russia | ||
| Netherlands | ||
| Rest of Europe | ||
| Asia-Pacific | China | |
| Japan | ||
| India | ||
| South Korea | ||
| Australia and New Zealand | ||
| Rest of Asia-Pacific | ||
| Middle East | Saudi Arabia | |
| United Arab Emirates | ||
| Rest of Middle East | ||
| Africa | South Africa | |
| Nigeria | ||
| Rest of Africa | ||


Key Questions Answered in the Report
What is the current and forecast value of the serverless and container sustainability software market?
The serverless and container sustainability software market was valued at USD 0.52 billion in 2025, is estimated at USD 0.65 billion in 2026, and is forecast to reach USD 1.95 billion by 2031, growing at a 24.57% CAGR.
What is driving adoption of software for serverless and container sustainability?
Adoption is being driven by the convergence of cloud cost management and sustainability accounting, growing Scope 3 reporting pressure, and the need for workload-level emissions visibility in cloud-native operations.
Which deployment model leads this space today?
Cloud-based deployments led with 67.12% share in 2025 because the tooling sits close to the workloads, cloud APIs, and telemetry sources needed for fast measurement and reporting.
Which customer group is expanding the fastest?
SMEs are projected to grow at a 25.89% CAGR through 2031 as lower-cost tools and rising disclosure expectations make adoption more relevant outside the largest regulated enterprises.
Which end-user sector is creating the largest demand?
IT and Telecom held the largest share at 26.41% in 2025 because it already runs dense microservices, Kubernetes estates, and cloud-native observability environments that need this type of software.
Which region is expected to grow the fastest through 2031?
Asia-Pacific is projected to grow at a 27.45% CAGR through 2031, supported by tighter reporting expectations, rapid containerization, and stronger software carbon accounting activity in markets such as China, India, South Korea, and Japan.
Page last updated on:


