Server Microprocessor Market Size and Share
Market Overview
| Study Period | 2020 - 2031 |
|---|---|
| Market Size (2026) | USD 20.66 Billion |
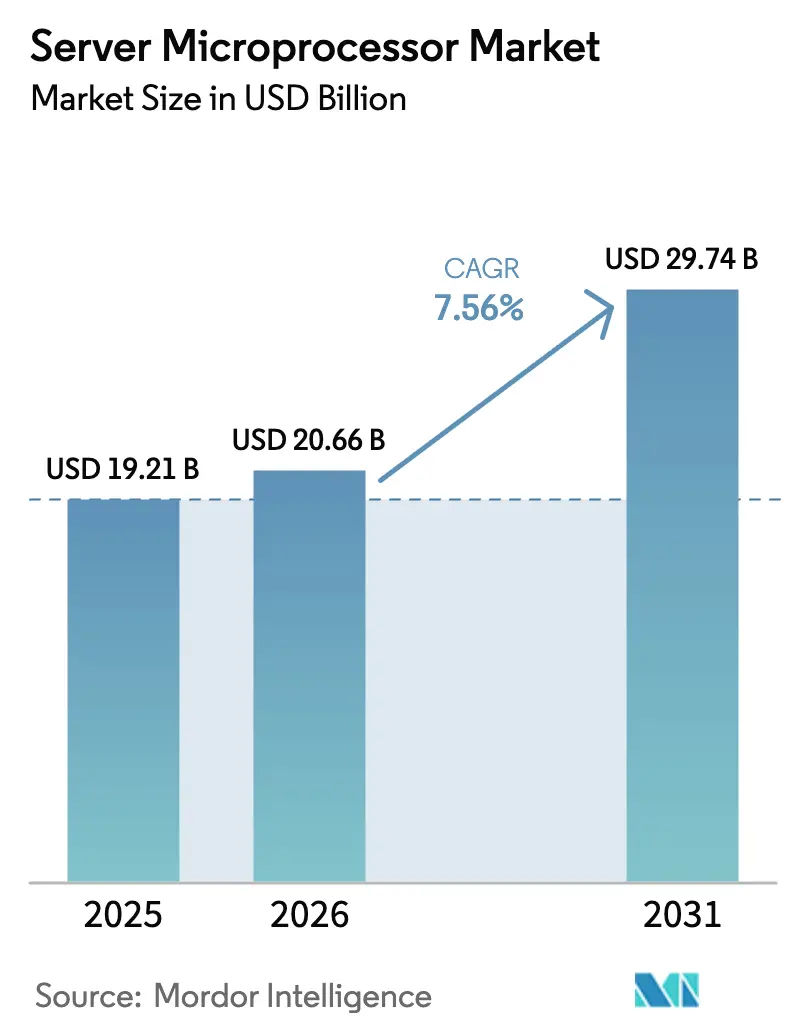
| Market Size (2031) | USD 29.74 Billion |
| Growth Rate (2026 - 2031) | 7.56% CAGR |
| Fastest Growing Market | Asia-Pacific |
| Largest Market | North America |
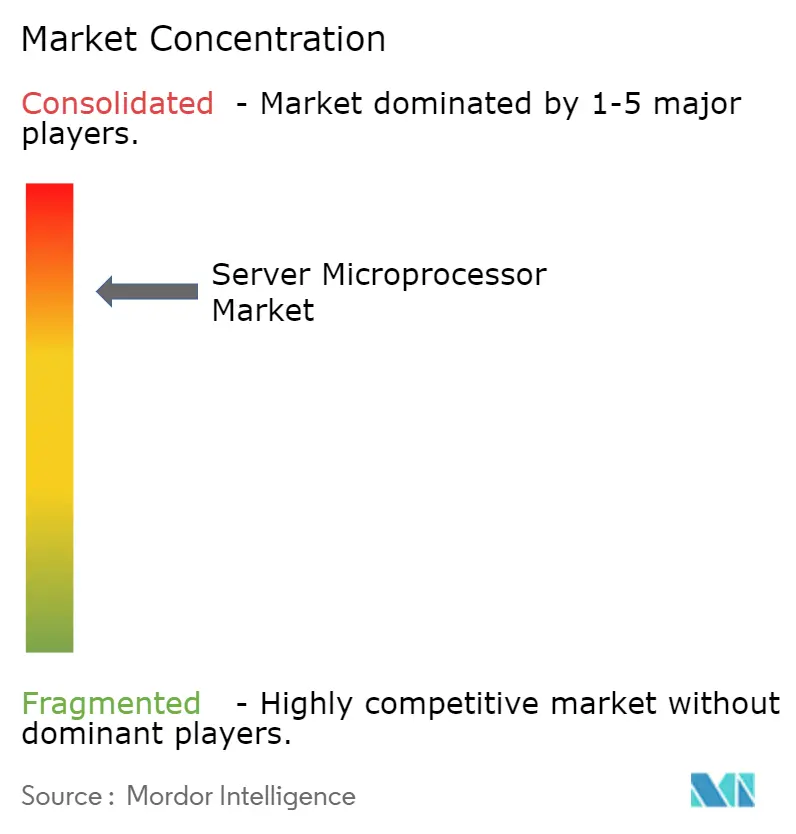
| Market Concentration | High |
Major Players *Disclaimer: Major Players sorted in no particular order Image © Mordor Intelligence. Reuse requires attribution under CC BY 4.0. | |
Server Microprocessor Market Analysis by Mordor Intelligence
The Server Microprocessor Market size is projected to expand from USD 19.21 billion in 2025 and USD 20.66 billion in 2026 to USD 29.74 billion by 2031, registering a CAGR of 7.56% between 2026 to 2031. Momentum comes from generative AI, edge-computing roll-outs, and state-funded chip-sovereignty programs that are reshaping procurement criteria toward performance-per-watt and supply-chain transparency. Architectural heterogeneity is accelerating, with hyperscale buyers mixing scalar CPUs, tensor GPUs, and custom ASICs inside a single rack to curb energy use and software licensing fees. High-core Arm designs and emerging RISC-V options are moving into production as hyperscalers look for royalty-free alternatives to x86 while telecom operators deploy low-power processors in thousands of 5G edge nodes. Foundry dynamics remain pivotal; sub-7-nanometer volume already exceeds half of shipments and will dominate new capacity additions through 2031 as TSMC, Samsung, and Intel race to scale 3-nanometer output.
Key Report Takeaways
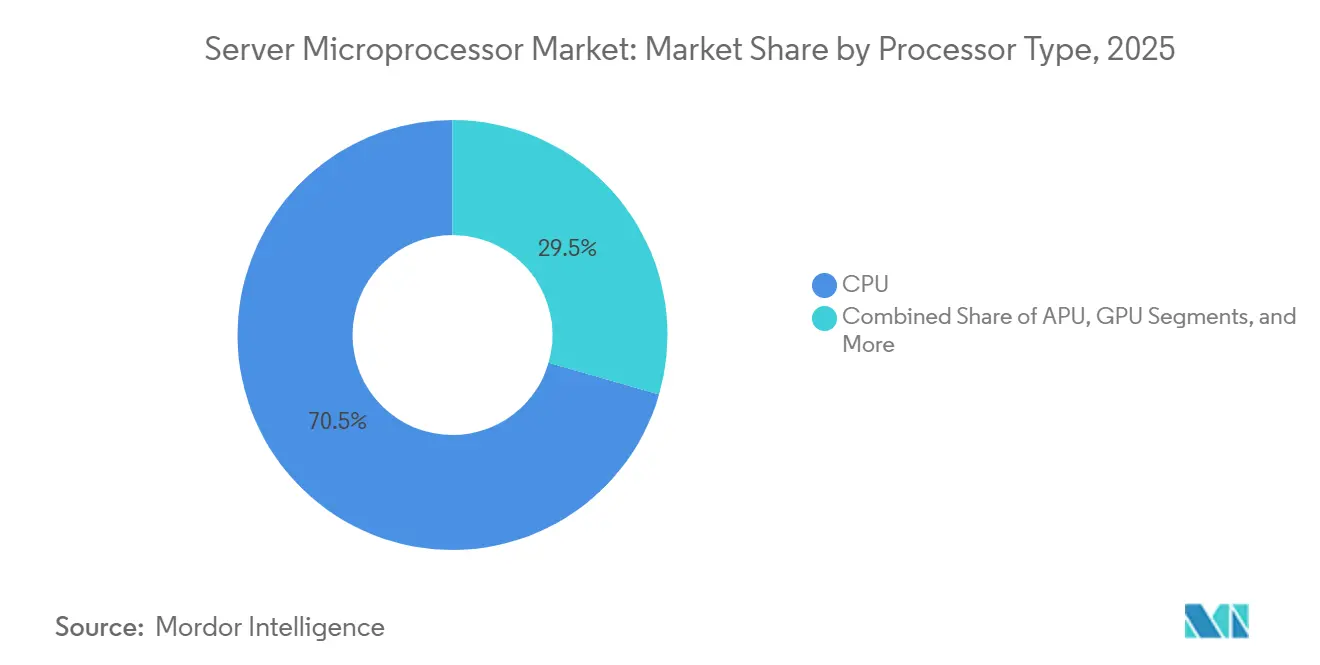
- By processor type, CPUs captured 70.53% of server microprocessor market share in 2025 while GPUs are forecast to expand at an 8.72% CAGR to 2031.
- By instruction-set architecture, x86 held 64.91% share in 2025; RISC-V is projected to post the fastest 7.97% CAGR through 2031.
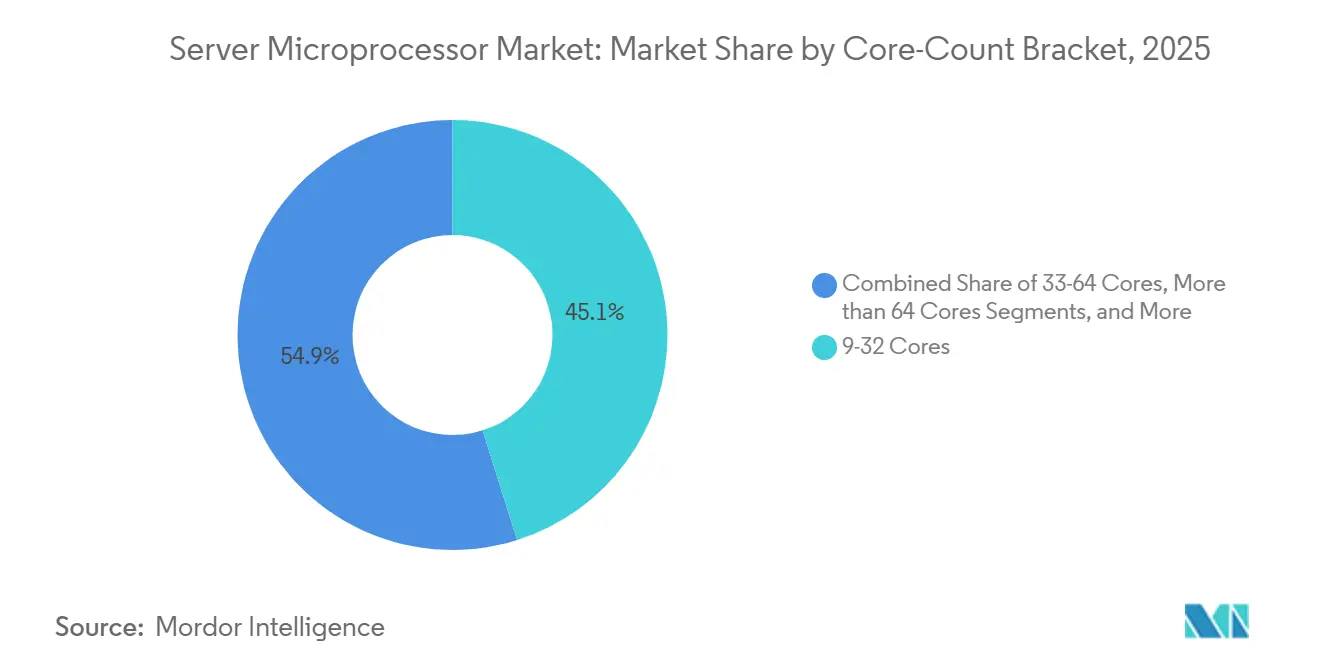
- By core-count bracket, 9-32-core processors accounted for 45.13% of shipments in 2025, whereas designs above 64 cores will grow at an 8.22% CAGR.
- By fabrication node, Less than or Equal to 7nm devices commanded 52.69% of 2025 volume and are expected to rise at a 7.83% CAGR.
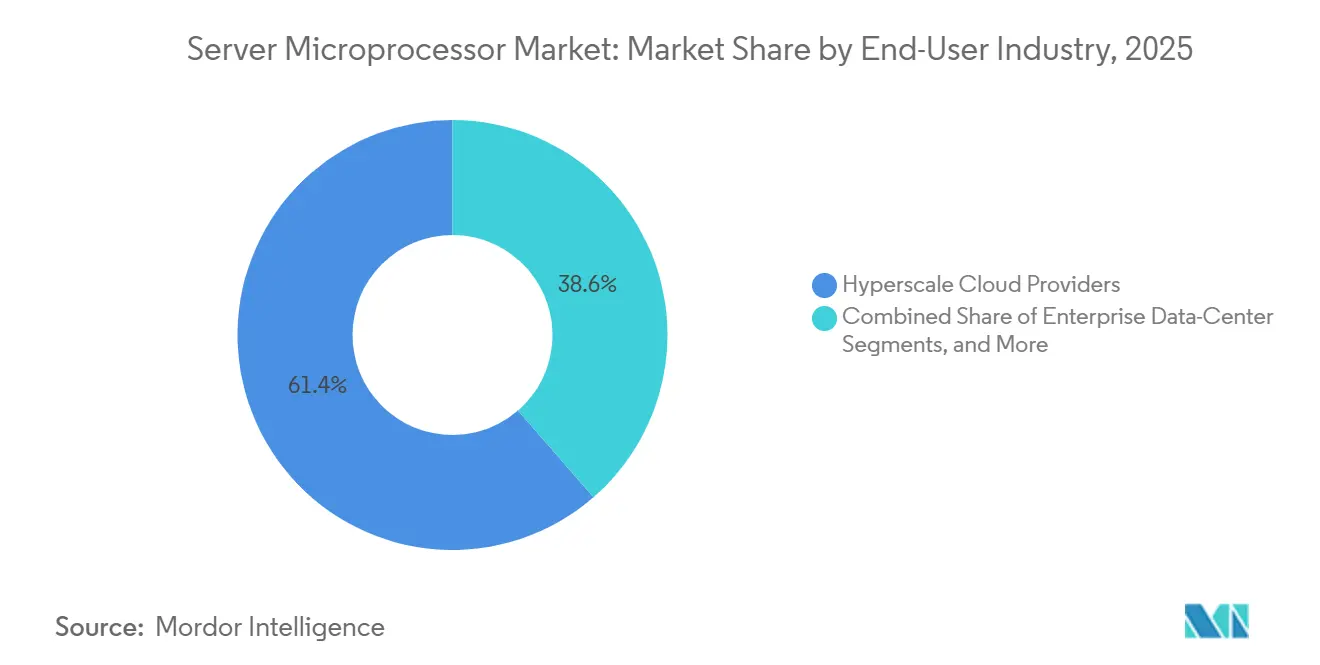
- By end-user industry, hyperscale cloud players generated 61.38% of 2025 demand, but telecom and edge operators should lead growth at an 8.02% CAGR.
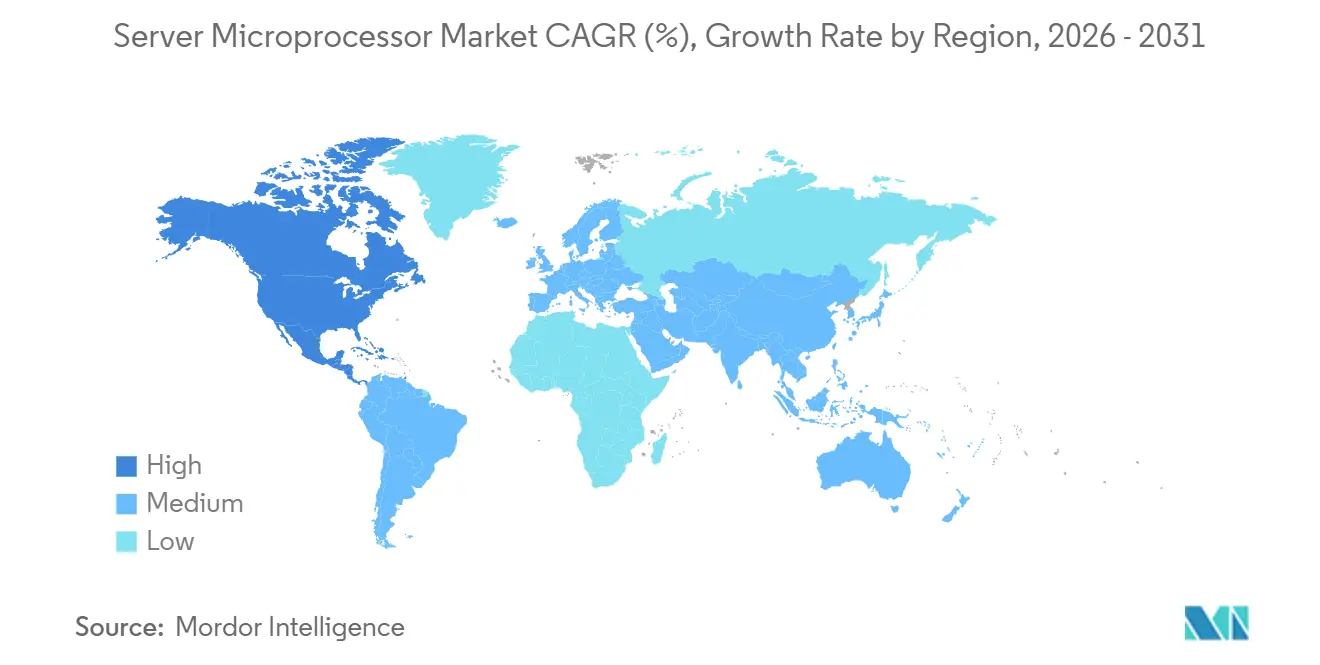
- By geography, North America represented 39.52% share in 2025, while Asia-Pacific is set to grow at a 9.11% CAGR.
Note: Market size and forecast figures in this report are generated using Mordor Intelligence’s proprietary estimation framework, updated with the latest available data and insights as of January 2026.
Global Server Microprocessor Market Trends and Insights
Drivers Impact Analysis*
| Driver | (~) % Impact on CAGR Forecast | Geographic Relevance | Impact Timeline |
|---|---|---|---|
| Rising Demand for High-performance, Energy-efficient CPUs | +1.2% | Global, with concentration in North America and Asia-Pacific hyperscale zones | Medium term (2-4 years) |
| Expansion of Hyperscale Data-centers Worldwide | +2.1% | Global, led by North America, Asia-Pacific core markets, spillover to Middle East | Long term (≥ 4 years) |
| Cloud-based AI/ML Workload Proliferation | +1.8% | Global, with North America and Asia-Pacific leading AI infrastructure deployment | Medium term (2-4 years) |
| 5G-enabled Edge-computing Roll-outs | +1.0% | Asia-Pacific, Europe, North America telecom operators | Medium term (2-4 years) |
| Chiplet-based Modular Design Adoption | +0.9% | Global, concentrated in North America and Taiwan design ecosystems | Long term (≥ 4 years) |
| Government Semiconductor-sovereignty Programs | +1.3% | North America (CHIPS Act), Europe (Chips Act), Asia-Pacific (China, India, Japan) | Long term (≥ 4 years) |
| Source: Mordor Intelligence | |||
Rising Demand for High-Performance, Energy-Efficient CPUs
Data-center operators are linking procurement directly to performance-per-watt metrics because energy now represents more than 30% of total cost of ownership in hyperscale facilities. Vendors have responded with silicon fabricated at 3 nanometers that cuts wattage by a third while doubling vector throughput. AWS Graviton4 instances show 30% better price-performance over comparable x86 virtual machines, validating Arm-based designs in mainstream cloud workloads.[1]Amazon Web Services, “Graviton4 Performance Overview,” aws.amazon.com Intel’s Xeon 6 Sierra Forest variant relies exclusively on efficiency cores to hit a 205-watt TDP target, supporting sustainability mandates without major code rewrites. Telecom operators substituting outdoor cabinets for air-conditioned halls are demanding even tighter envelopes, so chipmakers are integrating on-package voltage regulators and dynamic power-gating functions. These shifts ensure that the server microprocessor market continues to migrate toward architectures optimized for watts rather than pure clock speed.
Expansion of Hyperscale Data Centers Worldwide
More than 900 hyperscale facilities entered service during 2024-2025, and cumulative capital expenditure topped USD 200 billion, led by operators locating campuses near low-cost renewable energy grids in Saudi Arabia, India, and the Nordics. Rack designs emphasize multi-socket boards that host CPU, GPU, and network acceleration tiles on one interposer, tightening thermal coupling and demanding advanced packaging expertise. AWS, Google, and Meta have each shifted at least 1/3 of their new web-serving capacity to Arm-based processors that promise lower silicon bill of materials. Emerging markets are mandating local data residency under converging privacy laws, so operators must replicate compute clusters regionally, further expanding total socket demand. As this footprint grows, the server microprocessor market benefits from volume elasticity and a broader price band.
Cloud-Based AI and ML Workload Proliferation
Generative AI inference queries grew fourfold in 2025, overwhelming existing CPU fleets and accelerating GPU and custom accelerator purchases. Training runs now exceed 10^25 floating-point operations, demanding clusters of thousands of accelerators linked by high-speed fabrics. This dynamic forces general-purpose CPUs to relinquish certain workloads while still orchestrating data movement and storage, anchoring their relevance in heterogeneous systems. Intel Gaudi 3 and Google TPU v5 illustrate the economic incentive for purpose-built silicon, yet orchestration overhead keeps a significant share of capital budgets pointed at multi-core server CPUs. Providers that offer flexible, mix-and-match chiplets can satisfy rapid AI iteration timelines, thereby sustaining price premiums and maintaining high utilization across physical racks.
5G-Enabled Edge-Computing Roll-outs
Telecom carriers are installing thousands of micro-data centers at cell-tower sites to meet sub-20-millisecond latency targets for automotive and industrial automation workloads.[2]Verizon Communications, “5G Edge Compute Platform,” verizon.com Each edge node consumes no more than 3 kilowatts, limiting thermal budgets and favoring Arm-based or RISC-V designs that optimize instruction fetch and branch prediction for low power. Processors with integrated Ethernet and AI inferencing engines eliminate the need for add-on cards, trimming cost and board area. Regulatory frameworks that restrict cross-border data transfers amplify demand for localized compute, pushing cloud service providers to mirror core datasets across national boundaries. This dispersion away from centralized data halls diversifies socket mix and elevates the server microprocessor market presence in emerging economies.
Restraint Impact Analysis*
| Restraint | (~) % Impact on CAGR Forecast | Geographic Relevance | Impact Timeline |
|---|---|---|---|
| Declining On-prem Enterprise Server Budgets | -0.8% | Global, concentrated in North America and Europe enterprise IT segments | Short term (≤ 2 years) |
| Ongoing Semiconductor Supply-chain Disruptions | -1.1% | Global, with acute impact in Asia-Pacific manufacturing hubs | Medium term (2-4 years) |
| Escalating Licensing Costs of Proprietary ISAs | -0.6% | Global, affecting x86 and Arm licensees | Medium term (2-4 years) |
| Strict Data-center Sustainability Regulations | -0.7% | Europe (EU Energy Efficiency Directive), North America (state-level mandates) | Long term (≥ 4 years) |
| Source: Mordor Intelligence | |||
Ongoing Semiconductor Supply-Chain Disruptions
TSMC’s 3 nanometer lines ran at 85% utilization in Q3 2025, yet wafer demand exceeded supply by 20%, lengthening lead times to 16 weeks. Export restrictions on EUV tools block Chinese fabs from matching leading-edge nodes, fragmenting capacity, and raising risk premiums on contingency inventory. Samsung’s gate-all-around ramp and Intel’s 18-angstrom plan remain subscale, so a single earthquake or geopolitical flare-up could choke more than half of global server chip output. Vendors pass surcharges straight into contract pricing; AMD’s Q2 2025 gross margin slid 200 basis points due to expedited wafer fees. Design teams are splitting dies into smaller chiplets made on mature nodes, but that strategy increases packaging complexity and yields new sources of delay.
Strict Data-Center Sustainability Regulations
The EU Energy Efficiency Directive requires all new European data centers to post power-usage effectiveness below 1.3 by 2027 and publish waste-heat recovery plans. California’s Title 24 caps server idle draw at 50 watts for dual-socket boards, effectively disqualifying older x86 SKUs from state contracts. These rules accelerate the shift to liquid cooling, adding USD 150-USD 200 per rack-unit in capital cost. Processors such as Intel Xeon 6 Sierra Forest use a core-dense layout to meet idle budgets, but reduced single-thread performance obliges software rewrites. Meanwhile, hyperscalers levy internal carbon charges that penalize products without verifiable Scope-3 emission disclosures, forcing chipmakers to publish cradle-to-gate lifecycle audits and source renewable power for fabs.
*Our forecasts treat driver/restraint impacts as directional, not additive. The impact forecasts reflect baseline growth, mix effects, and variable interactions.
Segment Analysis
By Processor Type: Accelerators Reshape Workload Allocation
GPU shipments expanded at an 8.72% CAGR during 2026-2031 and cut into the CPU’s 70.53% revenue lead as AI inference migrated to tensor engines, a trend that will keep the server microprocessor market in transition through 2031. GPUs like NVIDIA Blackwell now deliver 20 petaflops FP4 performance while paired with Arm-based Grace CPUs over NVLink, enabling rack designs that beat sub-1.3 PUE targets. FPGAs remain niche in unit terms but are critical for encryption offload and compression, trimming CPU cycles by 30% for cloud operators. Integrated APU designs are a winning edge in appliance slots where fans and discrete cards are impractical. ASIC accelerators from Google and AWS achieve 2-3 times better performance per watt than GPUs for specific inference patterns.
Heterogeneous chiplet packages enable vendors to slot CPUs, GPUs, and network dies under a single heat spreader, shaving mask costs and improving time-to-market. The server microprocessor industry therefore pivots from monolithic core count races to mixed-die portfolio strategies that maximize silicon area efficiency. Legacy CPU revenues are flattening, but the overall server microprocessor market continues to grow because accelerators carry higher average selling prices. Procurement teams are evaluating total rack cost rather than socket price, enabling vendors that deliver integrated stacks to secure multiyear supply agreements.


By Instruction-Set Architecture: Open ISAs Challenge Royalty Models
x86 retained 64.91% share in 2025 and remains the compatibility anchor for enterprise software, yet Arm captured a quarter of new sockets, and RISC-V is projected to grow at a 7.97% CAGR on a royalty-free model that resonates with hyperscalers. Qualcomm’s USD 1.5 billion Ventana acquisition signaled traditional mobile leaders entering the server space to hedge against rising Arm license fees. China’s preference for open governance aligns with its semiconductor sovereignty objectives, so domestic vendors are betting on RISC-V for cloud build-outs.
The competitive narrative now hinges on ecosystem tooling and long-tail software support rather than front-end performance, positioning low-cost RISC-V boards as credible for microservices and caching tiers. Arm’s success in bespoke cloud silicon threatens merchant suppliers on margin, but it validates the diversity of design and ensures that the server microprocessor market avoids single-vendor lock-in. Standardization groups are aligning firmware interfaces across ISAs to shorten application migration times, which should keep the server microprocessor industry dynamic through the forecast period.
By Core-Count Bracket: Density Outweighs Clock Speed
Processors with 9-32 cores delivered 45.13% of 2025 shipments, serving mainstream enterprise workloads, yet the segment above 64 cores will compound at 8.22% as microservices architecture uses horizontal scaling for throughput.[3]Ampere Computing, “AmpereOne 192-Core Launch,” amperecomputing.com AmpereOne’s 192-core design offers 40% better performance per watt than a dual-socket x86 system, making it the benchmark for scale-out compute. Mid-range 33-64-core chips satisfy balanced workloads running mixed databases and virtualization, while ≤8-core models now occupy edge gateways and industrial controllers.
High-core Arm and RISC-V silicon uses simpler out-of-order pipelines that enable aggressive power-gating, satisfying idle power ceilings imposed by new regulations. Vendors are easing software adaptation by providing compiler flags and scheduler patches that optimize thread affinity across hundreds of cores. These developments ensure that the server microprocessor market maintains volume growth even as single-thread performance gains plateau.
By Fabrication Process Node: Sub-7 Nanometer Becomes Norm
Devices fabricated at ≤7 nanometers represented 52.69% of 2025 output and are projected to expand at 7.83% CAGR, underpinning most of the future server microprocessor market size. TSMC’s N3E yields an 18% speed lift or 32% power cut over N5, which AMD exploits in its EPYC 9005 series. Samsung’s gate-all-around nodes promise similar gains but face qualification delays, limiting server design wins.
Intel aims to sample 18-angstrom products in 2026, introducing backside power delivery to reduce voltage droop and support higher frequencies within the same thermal envelope. Foundry subsidies in the United States, Europe, and Japan intend to diversify geographic risk, yet cost differentials versus Asia remain 30-40% higher, so fabs must secure long-term wafer agreements to be competitive. Consequently, the server microprocessor market will likely consolidate around three foundry ecosystems that can afford multi-billion-dollar lithography tools.
By End-User Industry: Edge Operators Spur Next Growth Wave
Hyperscale clouds accounted for 61.38% of 2025 demand, but telecom and edge deployments will register the highest 8.02% CAGR as 5G slicing and ultra-low-latency applications proliferate. Verizon, AT&T and Deutsche Telekom are rolling out micro-data centers that rely on Arm-based sockets due to their lower power envelopes. Enterprise data-center budgets continue to migrate to consumption models, reducing direct server procurement and shifting revenue toward public cloud infrastructure.
High-performance computing remains a small share of sockets but commands premium pricing because national labs prioritize FP64 throughput. Regulatory frameworks restricting Chinese equipment in European 5G networks indirectly channel demand toward Western silicon vendors, cushioning margins. This varied demand profile ensures the server microprocessor market remains resilient across economic cycles.
Geography Analysis
North America generated 39.52% of 2025 revenue, bolstered by more than USD 80 billion in annual hyperscale capital expenditure from AWS, Azure, Google Cloud and Meta. CHIPS Act incentives worth USD 52.7 billion aim to reshore 20% of leading-edge logic by 2030, yet domestic wafer costs remain up to 40% higher than Asian fabs, pressuring gross margins. Canada and Mexico add incremental volume through back-end assembly and test operations that leverage USMCA trade provisions.
Asia-Pacific is projected to post the fastest 9.11% CAGR, driven by China’s domestic Arm and RISC-V initiatives, India’s USD 12.7 billion AWS investment and Southeast Asia’s neutral colocation growth AWS. Chinese hyperscalers such as Alibaba and Tencent already deploy in-house 128-core Arm processors, demonstrating technology parity despite export controls.[4]Alibaba Cloud, “Yitian 710 Architecture,” alibabacloud.com Japan and South Korea focus on memory and foundry services rather than server CPU design, but still benefit from regional stimuli targeting chip sovereignty.
Europe, South America, the Middle East, and Africa collectively hold under one-quarter of demand yet are expanding as data-sovereignty laws force local storage of sensitive workloads. The EU’s EUR 43 billion Chips Act funds fabs in Germany and Italy, though the region still relies on Asian contract manufacturing for most server processors. The Middle East’s NEOM campus and UAE AI investments require liquid-cooled racks due to ambient temperatures, adding cost premiums but fostering regional specialization. South American growth hinges on improved fiber infrastructure, while Africa’s nascent market leans on refurbished x86 equipment until grid reliability improves.

Competitive Landscape
Intel, AMD, and NVIDIA together captured a high share of the 2025 server microprocessor market revenue, indicating high concentration. Intel experienced a decline in dominance within x86 sockets in Q2 2025 as AMD’s chiplet-based EPYC lineup delivered significantly better performance per dollar, leading to increased adoption by hyperscalers exploring Arm alternatives. NVIDIA’s introduction of the Grace CPU alongside Hopper and Blackwell GPUs is shifting AI budgets toward package-level solutions, reducing the addressable CPU pool for competitors.
Arm’s royalty model pressures merchant vendors but empowers hyperscalers to design in-house chips such as AWS Graviton4 and Microsoft Cobalt 100. RISC-V startups like SiFive and Tenstorrent leverage zero licensing fees and UCIe chiplet standards to compete on specialized workloads, attracting venture capital and M&A interest from Qualcomm and Samsung. Patent activity indicates innovation migrating from transistor scaling to advanced packaging, with more than 200 UCIe filings in 2024 alone.
Regulatory constraints fragment the landscape; U.S. export controls on advanced AI accelerators push Chinese actors to develop domestic substitutes, while sustainability mandates favor vendors that publish full Scope 3 audits. Consequently, the server microprocessor market will likely evolve toward a multi-architecture equilibrium where performance, energy and compliance co-define competitive advantage.
Server Microprocessor Industry Leaders
Advanced Micro Devices, Inc.
Intel Corporation
NVIDIA Corporation
Arm Ltd.
Broadcom Inc.
- *Disclaimer: Major Players sorted in no particular order

Recent Industry Developments
- October 2025: Intel sampled its 18-angstrom RibbonFET test chips to strategic partners, marking a milestone toward 2027 volume production.
- June 2025: Qualcomm completed the USD 1.5 billion Ventana acquisition to secure RISC-V server IP and a 300-engineer team.
- March 2025: Intel launched Xeon 6 Granite Rapids and Sierra Forest, fabricated on Intel 3, targeting cloud-native instances with 2.5× better performance per watt.
- March 2025: NVIDIA unveiled the Blackwell architecture, pairing the B200 GPU with the Grace CPU for 20 petaflops FP4 inference capability.
- February 2025: AMD announced EPYC 9005 “Turin”, featuring 192 Zen 5 cores on TSMC N3E that outperform Xeon 6 in virtualization benchmarks by 30%.


Global Server Microprocessor Market Report Scope
The Server Microprocessor Market Report is Segmented by Processor Type (APU, CPU, GPU, FPGA, ASIC Accelerators), Instruction-Set Architecture (x86, ARM, RISC-V, Power, SPARC and Others), Core-Count Bracket (Less than or Equal to 8 Cores, 9-32 Cores, 33-64 Cores, Greater than 64 Cores), Fabrication Process Node (Less than or Equal to 7nm, 8-14nm, 15-28nm, Greater than 28nm), End-User Industry (Hyperscale Cloud, Enterprise, Telecom/Edge, HPC, Other), and Geography. The Market Forecasts are Provided in Terms of Value (USD).
| APU |
| CPU |
| GPU |
| FPGA |
| ASIC Accelerators |
| x86 |
| ARM |
| RISC-V |
| Power |
| SPARC and Others |
| Consumer Electronics |
| Less Than or Equal to 8 Cores |
| 9-32 Cores |
| 33-64 Cores |
| More than 64 Cores |
| Less Than or Equal to 7 nm |
| 8-14 nm |
| 15-28 nm |
| More than 28 nm |
| Hyperscale Cloud Providers |
| Enterprise Data-Centers |
| Telecom/ Edge Operators |
| HPC and Supercomputing |
| Other End-User Industries |
| North America | United States |
| Canada | |
| Mexico | |
| South America | Brazil |
| Argentina | |
| Rest of South America | |
| Europe | Germany |
| United Kingdom | |
| France | |
| Italy | |
| Spain | |
| Rest of Europe | |
| Asia-Pacific | China |
| Japan | |
| India | |
| South Korea | |
| ASEAN | |
| Rest of Asia-Pacific | |
| Middle East | Saudi Arabia |
| United Arab Emirates | |
| Rest of Middle East | |
| Africa | South Africa |
| Nigeria | |
| Rest of Africa |
| By Processor Type | APU | |
| CPU | ||
| GPU | ||
| FPGA | ||
| ASIC Accelerators | ||
| By Instruction-Set Architecture | x86 | |
| ARM | ||
| RISC-V | ||
| Power | ||
| SPARC and Others | ||
| Consumer Electronics | ||
| By Core-Count Bracket | Less Than or Equal to 8 Cores | |
| 9-32 Cores | ||
| 33-64 Cores | ||
| More than 64 Cores | ||
| By Fabrication Process Node | Less Than or Equal to 7 nm | |
| 8-14 nm | ||
| 15-28 nm | ||
| More than 28 nm | ||
| By End-User Industry | Hyperscale Cloud Providers | |
| Enterprise Data-Centers | ||
| Telecom/ Edge Operators | ||
| HPC and Supercomputing | ||
| Other End-User Industries | ||
| By Geography | North America | United States |
| Canada | ||
| Mexico | ||
| South America | Brazil | |
| Argentina | ||
| Rest of South America | ||
| Europe | Germany | |
| United Kingdom | ||
| France | ||
| Italy | ||
| Spain | ||
| Rest of Europe | ||
| Asia-Pacific | China | |
| Japan | ||
| India | ||
| South Korea | ||
| ASEAN | ||
| Rest of Asia-Pacific | ||
| Middle East | Saudi Arabia | |
| United Arab Emirates | ||
| Rest of Middle East | ||
| Africa | South Africa | |
| Nigeria | ||
| Rest of Africa | ||


Key Questions Answered in the Report
What is the current value of the server microprocessor market?
The server microprocessor market size reached USD 20.66 billion in 2026 and is projected to expand to USD 29.74 billion by 2031.
Which processor type is growing fastest?
GPUs are growing the quickest, posting an 8.72% CAGR as AI workloads migrate from general-purpose cores to specialized accelerators.
How will RISC-V impact future server designs?
RISC-V chips are gaining traction with a 7.97% CAGR because their royalty-free model enables custom extensions that suit cloud workloads.
Which region will lead growth to 2031?
Asia-Pacific is set to record the highest 9.11% CAGR, buoyed by China’s domestic initiatives and India’s hyperscale investments.
How are sustainability rules affecting processor roadmaps?
Power-usage effectiveness caps and idle-draw limits in the EU and California push vendors to prioritize performance per watt and adopt liquid cooling.
What role do chiplets play in cost reduction?
Chiplet-based modular designs cut mask expenses by reusing small dies, enabling faster iterations and reducing non-recurring engineering outlays.
Page last updated on:


