Sensor Fusion Market Size and Share
Market Overview
| Study Period | 2020 - 2031 |
|---|---|
| Market Size (2026) | USD 10.04 Billion |
| Market Size (2031) | USD 18.21 Billion |
| Growth Rate (2026 - 2031) | 12.65% CAGR |
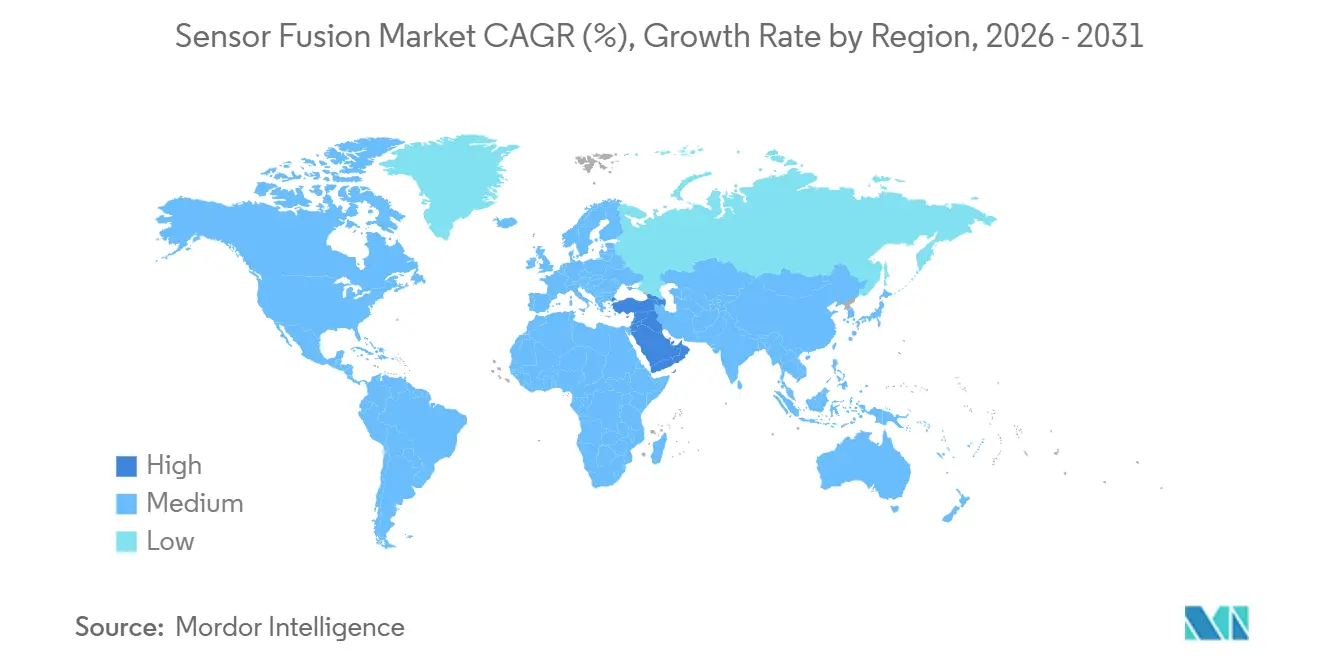
| Fastest Growing Market | Middle East |
| Largest Market | Asia Pacific |
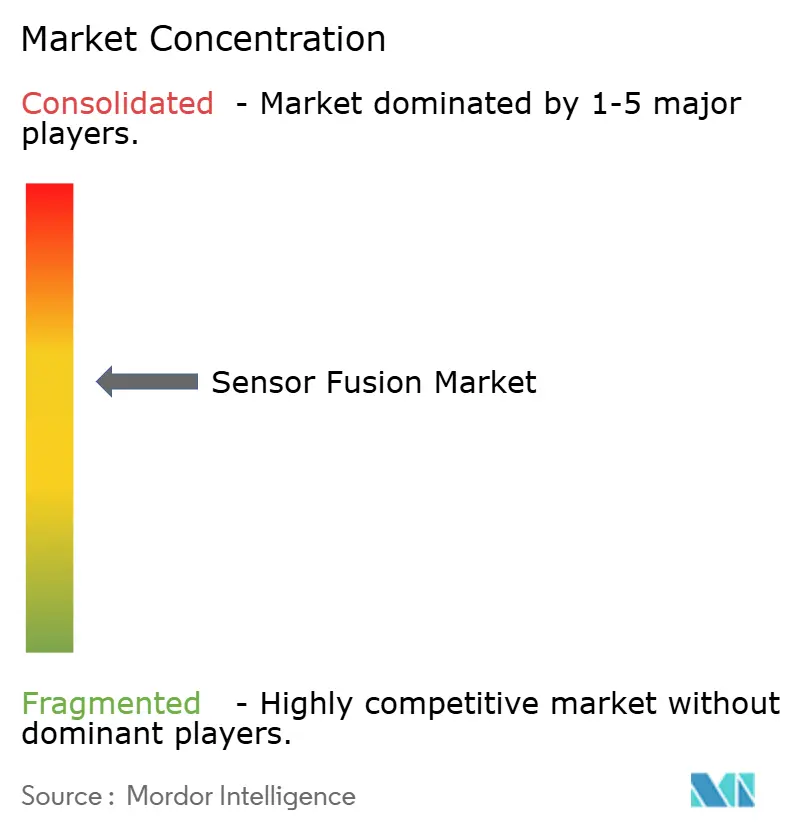
| Market Concentration | Medium |
Major Players *Disclaimer: Major Players sorted in no particular order Image © Mordor Intelligence. Reuse requires attribution under CC BY 4.0. | |
Sensor Fusion Market Analysis by Mordor Intelligence
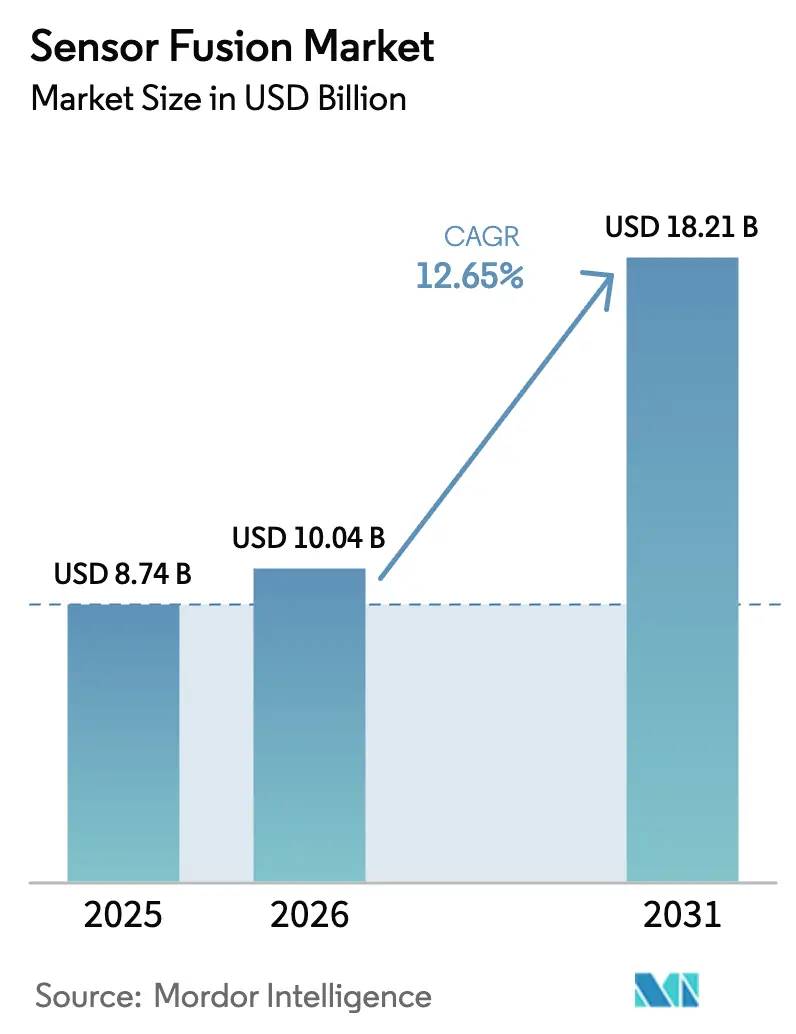
The sensor fusion market size was valued at USD 8.74 billion in 2025 and estimated to grow from USD 10.04 billion in 2026 to reach USD 18.21 billion by 2031, at a CAGR of 12.65% during the forecast period (2026-2031). Sustained cost reductions in solid-state LiDAR, rising Euro NCAP safety mandates, and breakthroughs in edge-AI silicon are shifting original-equipment budgets toward integrated multi-sensor suites that combine cameras, radar, LiDAR, and inertial units in a single stack. Vehicle manufacturers are standardizing sensor-fusion hardware across entire platforms to avoid redesign costs, while consumer-electronics brands adopt on-device inference to cut cloud latency and comply with privacy regulations. Intensifying competition among tier-one suppliers and semiconductor leaders is compressing hardware margins, a trend offset by growth in subscription-based fusion software and over-the-air feature unlocks. Capital inflows into imaging-radar and software-defined LiDAR start-ups are accelerating innovation cycles, reducing time-to-market for new modalities and enhancing redundancy strategies.
Key Report Takeaways
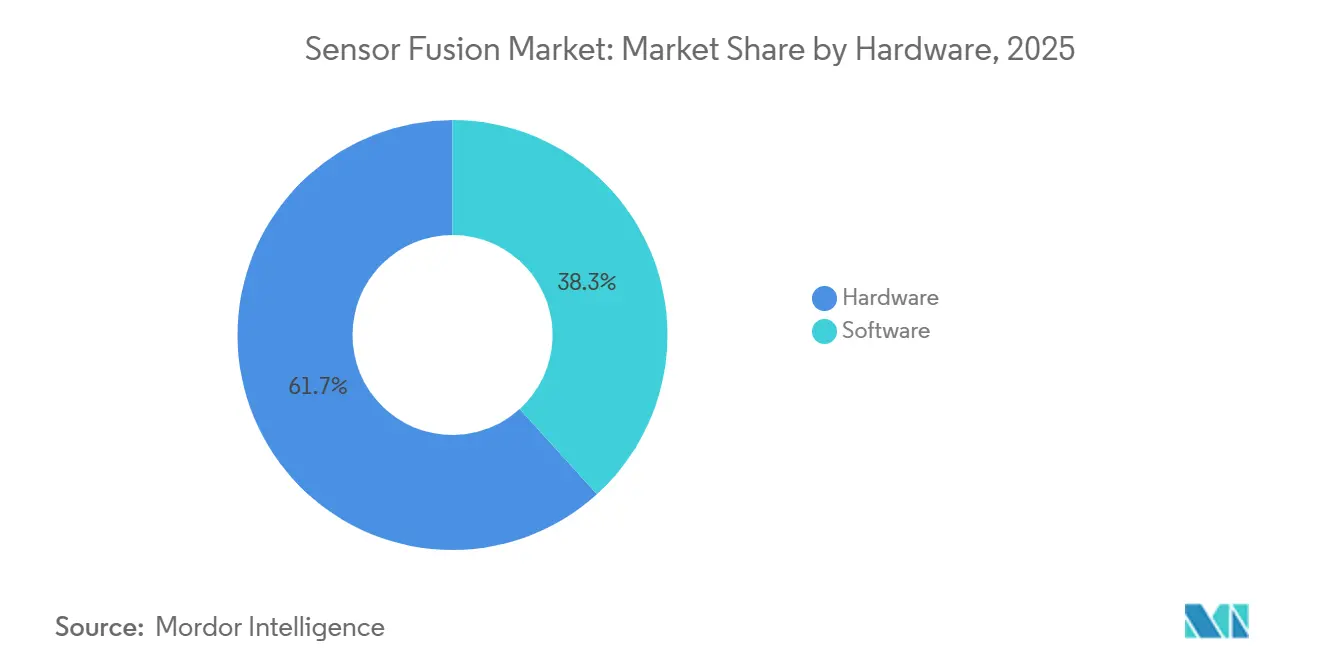
- By offering, hardware led with 61.73% share of the sensor fusion market size in 2025, whereas software is expanding at a 12.68% CAGR through 2031.
- By fusion method, radar-camera solutions commanded 43.56% of sensor fusion market share in 2025, while LiDAR-camera combinations are projected to grow at a 12.72% CAGR to 2031.
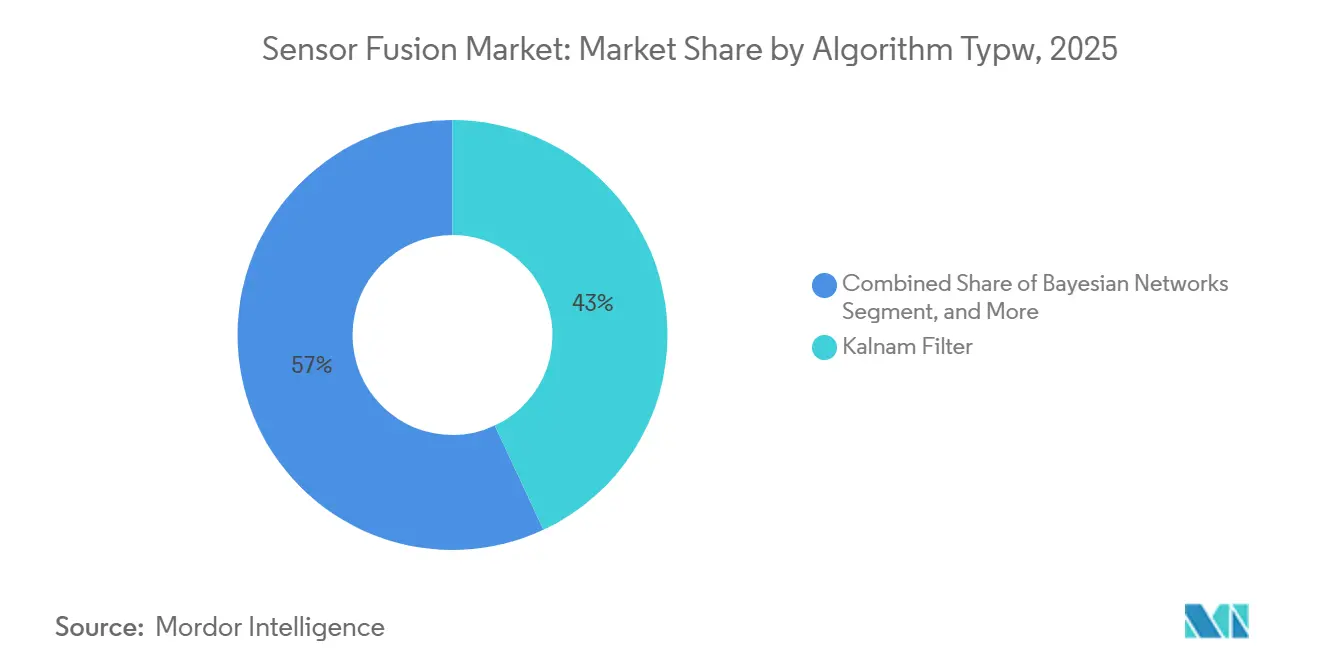
- By algorithm type, Kalman filters held 37.92% share in 2025, yet neural-network models are advancing at a 12.66% CAGR during 2026-2031.
- By application, ADAS generated 49.83% of 2025 revenue, but Level 3-5 autonomous platforms are forecast to rise at a 12.78% CAGR.
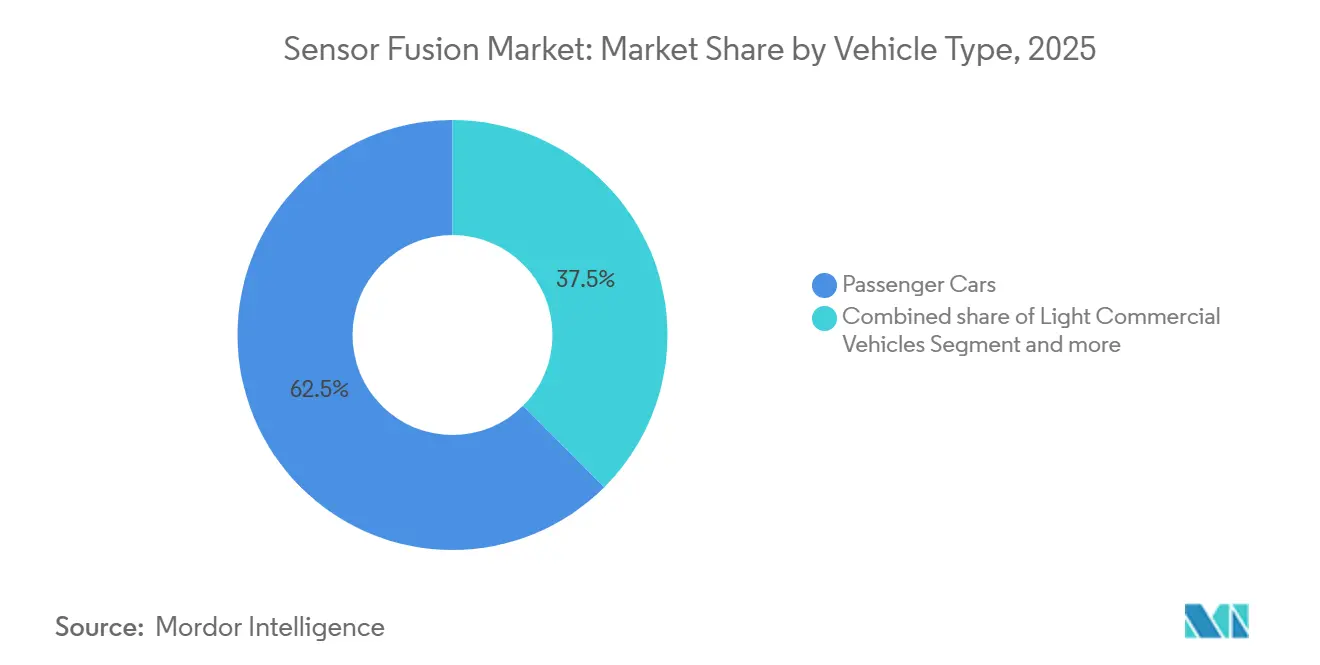
- By vehicle type, passenger cars accounted for 62.48% of 2025 revenue, while other autonomous vehicles are expected to record a 12.73% CAGR.
- By geography, Asia Pacific led with 40.81% revenue share in 2025, whereas the Middle East is poised for the fastest 12.75% CAGR through 2031.
Note: Market size and forecast figures in this report are generated using Mordor Intelligence’s proprietary estimation framework, updated with the latest available data and insights as of January 2026.
Global Sensor Fusion Market Trends and Insights
Drivers Impact Analysis*
| Driver | (~) % Impact on CAGR Forecast | Geographic Relevance | Impact Timeline |
|---|---|---|---|
| Mandate of sensor fusion for Euro NCAP 5-star ratings accelerating European OEM adoption | +2.3% | Europe, with spillover to North America and Asia Pacific | Short term (≤ 2 years) |
| Solid-state LiDAR cost decline enabling multi-sensor suites in mid-segment cars across China | +2.1% | Asia Pacific core, expanding to South America and Middle East | Medium term (2-4 years) |
| Edge-AI chip advancements allowing real-time multi-modal fusion in mobile and XR devices | +1.9% | Global, with early adoption in North America and Asia Pacific | Medium term (2-4 years) |
| Deployment of AMR robots in smart factories demanding high-accuracy sensor fusion | +1.7% | Asia Pacific and Europe, with emerging traction in North America | Long term (≥ 4 years) |
| Defense modernization programs funding multi-sensor targeting and navigation systems in Middle East | +1.5% | Middle East, with selective adoption in Asia Pacific and Africa | Long term (≥ 4 years) |
| Integration of V2X data streams into fusion stacks to unlock L4 autonomous driving in United States | +1.6% | North America, with pilot deployments in Europe and Asia Pacific | Long term (≥ 4 years) |
| Source: Mordor Intelligence | |||
Mandate Of Sensor Fusion For Euro NCAP 5-Star Ratings Accelerating European OEM Adoption
Euro NCAP’s 2026 protocols require radar-camera or LiDAR-camera integration to secure a 5-star score, driving immediate redesigns of volume models by European brands. Volkswagen confirmed that all post-2026 MEB launches will carry radar-camera fusion, eliminating single-sensor architectures. Tier-one suppliers with certified middleware are capturing design wins as automakers seek turnkey compliance. The regulation’s global ripple effect is evident in exports to Asia Pacific and South America, where reuse of Euro-spec platforms minimizes engineering divergence. This policy shift entrenches multi-sensor redundancy as a baseline rather than a premium option.
Solid-State LiDAR Cost Decline Enabling Multi-Sensor Suites in Mid-Segment Cars
Hesai is committed to sub-USD 500 solid-state LiDAR by late 2026, leveraging silicon-photonics and volume scaling. BYD already deploys LiDAR-camera-radar arrays in sedans below USD 25,000, widening adoption beyond luxury tiers. Geely’s Galaxy program mirrors this strategy, prompting European and North American peers to accelerate solid-state roadmaps. China’s domestic output is projected to top 2 million LiDAR units annually by 2027, establishing supply-chain leverage that reinforces the region’s leadership in affordable ADAS penetration.
Edge-AI Chip Advancements Allowing Real-Time Multi-Modal Fusion in Mobile and XR Devices
Qualcomm’s Snapdragon 8 Gen 3 integrates a 15-TOPS neural engine that executes multimodal fusion on-device, reducing latency by up to 90% compared to cloud pipelines. Apple’s Vision Pro and Meta’s Quest 3 deliver sub-20 ms motion-to-photon delays through similar approaches, enabling immersive spatial computing without external beacons. On-device inference also supports compliance with GDPR and China’s privacy laws, as raw sensor data remains local. These advancements open the sensor fusion market to smartphones, headsets, and wearables that previously relied on single-sensor solutions.
Deployment of AMR Robots in Smart Factories Demanding High-Accuracy Sensor Fusion
Autonomous mobile robots in automotive and electronics plants depend on centimeter-level localization that fuses LiDAR, stereo vision, IMUs, and ultra-wideband signals. ABB reported 99.7% uptime across its 2025 AMR fleet by isolating faulty sensor inputs through Kalman-based fusion.[1]ABB Robotics Division, “Annual Report 2025,” global.abb The International Federation of Robotics forecasts more than 1.2 million AMRs by 2027, with Europe and Asia Pacific leading installations. Multi-sensor fusion also underpins human-robot collaboration, allowing AMRs to predict worker trajectories and adjust routes dynamically.
Restraints Impact Analysis*
| Restraint | (~) % Impact on CAGR Forecast | Geographic Relevance | Impact Timeline |
|---|---|---|---|
| Lack of uniform fusion architecture standards hindering interoperability | -1.8% | Global, with acute impact in Europe and North America | Medium term (2-4 years) |
| High computational overhead raising BoM for non-automotive IoT devices | -1.5% | Asia Pacific and North America, affecting consumer electronics and industrial segments | Short term (≤ 2 years) |
| Limited LiDAR penetration in emerging markets restricts multi-modal fusion adoption | -1.2% | South America, Africa, and select Asia Pacific regions | Long term (≥ 4 years) |
| Data-privacy and cyber-security concerns around cloud-aided sensor fusion pipelines | -1.1% | Europe and North America, with emerging relevance in Asia Pacific | Medium term (2-4 years) |
| Source: Mordor Intelligence | |||
Lack of Uniform Fusion Architecture Standards Hindering Interoperability
SAE guidelines for ADAS sensor interfaces remain voluntary, while AUTOSAR, ROS 2, and proprietary stacks compete for dominance.[2]SAE International, “Recommended Practice for ADAS Sensor Interfaces,” sae.org Automakers incur higher engineering costs when swapping sensor suppliers, and over-the-air updates demand time-consuming revalidation across divergent protocols. Industry consortia are pursuing open formats, yet consensus on data timing and failure-mode handling is not expected before 2028, slowing cross-platform scalability.
High Computational Overhead Raising Bill-Of-Materials For Non-Automotive IoT
Real-time fusion often needs 10-50 TOPS of processing. Automotive OEMs absorb USD 500-800 chips such as Nvidia Orin, but drones and smart appliances target silicon below USD 50. Texas Instruments’ AWR2944 integrates on-chip fusion acceleration, though its USD 30-40 price point still strains mass-market economics.[3]Texas Instruments, “AWR2944 Automotive Radar Datasheet,” investor.ti.com The result is a bifurcated market where premium devices adopt full multi-sensor stacks, while entry-level products revert to single-modality sensing.
*Our forecasts treat driver/restraint impacts as directional, not additive. The impact forecasts reflect baseline growth, mix effects, and variable interactions.
Segment Analysis
By Offering: Hardware Anchors Revenue While Software Drives Margin Expansion
Hardware captured 61.73% of 2025 revenue across the sensor fusion market, reflecting the capital intensity of radar, LiDAR, camera, and IMU modules that constitute the physical sensing layer. Radar modules priced between USD 50 and USD 150 dominate ADAS because of robust all-weather capabilities, whereas solid-state LiDAR, still above USD 500 per unit, is reserved for Level 3-5 programs requiring redundancy. Imaging sensors benefit from smartphone-scale economies, enabling multi-camera arrays at sub-USD 10 each. The sensor fusion market size attributed to hardware is set to increase steadily but at a slower pace than software.
Software is projected to outpace hardware with a 12.68% CAGR through 2031 as OEMs shift to over-the-air feature unlocks and subscription models. Platforms such as Mobileye SuperVision charge licensing fees per vehicle, converting one-off hardware sales into recurring revenue. ISO 26262 validation tools further enhance margins, with automakers spending USD 5-10 million per platform to certify fusion stacks. This dynamic positions software as the prime value-capture layer inside the sensor fusion industry.


By Fusion Method: Radar-Camera Dominates But LiDAR-Camera Gains Momentum
Radar-camera pairing represented 43.56% of sensor fusion market share in 2025 by combining radar’s velocity accuracy with camera-based object classification. Continental’s ARS540 4D radar extends elevation resolution, enhancing performance in cluttered urban settings CONTINENTAL.COM. LiDAR-camera fusion, supported by sub-USD 500 solid-state units, is forecast to record the fastest 12.72% CAGR. Mercedes-Benz and Stellantis deploy Valeo’s SCALA 3 LiDAR to unlock Level 3 functions, underscoring the technology’s migration from prototypes to series production.
Three-sensor frameworks that integrate radar, LiDAR, and cameras remain niche, limited to premium robotaxi programs where redundancy trumps cost. Conversely, IMU-GPS fusion is entrenched in drones and smartphones due to minimal bill-of-materials impact. As solid-state LiDAR pricing converges with imaging-radar, mid-segment vehicles are expected to embrace hybrid approaches, expanding the sensor fusion market footprint beyond luxury tiers.
By Algorithm Type: Neural Networks Challenge Kalman Filter Primacy
Kalman filters held 37.92% share in 2025, favored for deterministic outputs that simplify functional-safety audits. Their low computational burden suits mid-range microcontrollers, preserving cost efficiency. Yet transformer-based models like BEVFormer deliver superior edge-case handling and are scaling rapidly as automotive chips surpass 200 TOPS. The sensor fusion market size linked to neural-network inference is predicted to grow fastest through 2031.
Bayesian networks provide an interpretable bridge between Kalman and deep learning, attracting applications where explainability and probabilistic reasoning are vital. GNSS-INS hybridization remains dominant in aviation and maritime markets, where centimeter accuracy justifies high-end inertial units. The algorithm landscape is diverging toward a dual-stack future that marries certifiable filters for safety-critical control with neural networks for perception and prediction.

By Application: Autonomous Driving Leads Growth Beyond ADAS Saturation
ADAS contributed 49.83% of revenue in 2025, underpinned by regulatory requirements and fleet-safety programs. However, penetration already exceeds 75% in mature markets, limiting upside. Level 3-5 autonomous platforms are forecast to achieve a 12.78% CAGR, catalyzed by UNECE WP.29 approvals for conditional-automation systems. The sensor fusion market size attributed to autonomous drive will therefore outstrip ADAS from 2028 onward.
Consumer-electronics devices, especially XR headsets, captured a rising share as on-device fusion removed reliance on cloud processing. Robotics, industrial automation, and defense collectively formed 32% of revenue, with defense applications commanding premium pricing due to mission-critical reliability standards. Cross-sector technology transfer accelerates algorithm refinement as lessons from automotive migrate to drones and AMRs.
By Vehicle Type: Passenger Cars Retain Scale While Non-Road Platforms Accelerate
Passenger cars generated 62.48% of 2025 revenue and remain the volume anchor for the sensor fusion market. Euro NCAP mandates and China’s new-energy policies drive multi-sensor adoption even in sub-USD 20,000 segments. Light commercial vehicles follow, propelled by e-commerce fleets demanding driver-assist features to reduce collision insurance premiums.
Other autonomous vehicles, including delivery robots and agricultural equipment, are projected for the highest 12.73% CAGR. Labor shortages and rising input costs justify the USD 10,000-50,000 sensor-suite investment per unit. Heavy commercial trucks and buses trail adoption due to disparate regional regulations, but forthcoming U.S. and European mandates on blind-spot and cross-traffic alerts will narrow the gap by 2029.
Geography Analysis
Asia Pacific generated the largest regional revenue in 2025 at 40.81%, anchored by China’s aggressive ADAS penetration, Japan’s robotics ecosystem, and South Korea’s semiconductor supply chain. China alone accounted for 58% of regional turnover, driven by BYD, Geely, and NIO standardizing multi-sensor suites across their electric vehicles. Government incentives that tie subsidies to Level 2 functionality further expand uptake, while domestic LiDAR capacity strengthens price competitiveness for local automakers.
Europe accounted for a fair share of global revenue in 2025, benefiting from stringent Euro NCAP and General Safety Regulation mandates that require multi-modal sensing. Germany led regional demand, with Volkswagen, BMW, and Mercedes-Benz integrating fusion stacks at the platform level to amortize R&D across multiple brands. The sensor fusion market in Europe is projected to maintain steady growth as regulatory scope broadens to include commercial vehicles and motorcycles by 2028.
North America held a considerable share in 2025, driven by U.S. automakers’ voluntary ADAS commitments and allocations of 5.9 GHz V2X spectrum. The Middle East, though smaller today, is forecast for the fastest 12.75% CAGR through 2031 as the United Arab Emirates and Saudi Arabia channel defense budgets into autonomous assets requiring robust fusion. South America and Africa collectively captured a small share of revenue, constrained by lower vehicle ownership and limited LiDAR supply chains, yet mining and agriculture automation is opening targeted opportunities.

Competitive Landscape
The sensor fusion market is moderately concentrated; the top 10 vendors controlled roughly more than half of the 2025 revenue. Bosch, Continental, and Valeo leverage vertically integrated radar, camera, and middleware portfolios to win turnkey platform deals with legacy automakers seeking fast-track compliance. NXP, Infineon, and STMicroelectronics compete via automotive-grade processors that bundle ISO 26262-certified software, while Nvidia and Qualcomm focus on high-performance compute for Level 3-5 autonomy, where 200-plus TOPS throughput is mandatory.
Start-ups such as Arbe Robotics and LeddarTech are unbundling hardware and software, allowing smaller OEMs to mix-and-match sensors without vendor lock-in. Arbe’s 4D imaging radar offers LiDAR-level point-cloud density at one-third the cost, securing 2026 design wins with Chinese brands. LeddarTech’s software-defined LiDAR decouples perception algorithms from hardware, enabling automakers to switch suppliers without major code rewrites. Patent filings rose 18% year-over-year in 2024, with neural-network fusion, failure-mode isolation, and multi-modal calibration as hot areas, underscoring accelerating innovation cycles.
Strategic collaborations intensified through 2025. Valeo partnered with Qualcomm to integrate SCALA 3 LiDAR onto Snapdragon Ride Flex, targeting turnkey Level 3 solutions. Nvidia’s Orin chip locked in 25 automaker programs spanning Level 2+ to Level 3, while Renesas launched the ASIL-D-qualified R-Car V4H to serve Japanese and European OEMs. Funding rounds, such as Arbe’s USD 75 million Series C led by Temasek, signal investor confidence in imaging-radar pathways that reduce dependence on expensive LiDAR.
Sensor Fusion Industry Leaders
Robert Bosch GmbH
Continental AG
NXP Semiconductors N.V.
STMicroelectronics N.V.
Infineon Technologies AG
- *Disclaimer: Major Players sorted in no particular order

Recent Industry Developments
- June 2025: Nvidia disclosed 25 automaker design wins for its Orin SoC supporting 254 TOPS neural-network throughput.
- May 2025: Arbe Robotics closed a USD 75 million Series C round to scale production of its 4D imaging radar.
- April 2025: Continental introduced the ARS540 4D radar with 300 m range and on-chip fusion acceleration.
- March 2025: BYD extended its Eye of God multi-sensor system to 21 models priced below USD 25 000.


Research Methodology Framework and Report Scope
Market Definitions and Key Coverage
Our study defines the sensor fusion market as the revenues generated from hardware-plus-embedded-software units that combine data from at least two heterogeneous sensors, most commonly camera, radar, LiDAR, ultrasonic, or inertial modules, to deliver a unified perception output for advanced driver-assistance systems (ADAS) and higher-level autonomous mobility. According to Mordor Intelligence, the base year is 2024 and the model values 2025 sales at USD 8.75 billion.
Scope Exclusion: Stand-alone single-sensor modules and cloud-only analytics suites that never integrate on-board sensor signals are outside scope.
Segmentation Overview
- By Offering
- Hardware
- Software
- By Fusion Method
- Radar + Camera Fusion
- LiDAR + Camera Fusion
- Radar + LiDAR Fusion
- IMU + GPS Fusion
- 3-Sensor Fusion (Camera + Radar + LiDAR)
- By Algorithm Type
- Kalman Filter (EKF, UKF)
- Bayesian Networks
- Neural Network, Deep Learning
- GNSS, INS Integration
- By Application
- Advanced Driver Assistance Systems (ADAS)
- ACC
- AEB
- ESC
- FCW
- Lane-Keep Assist (LKA)
- Autonomous Driving (Level 3-5)
- Consumer Electronics (AR, VR, Smartphones, Wearables)
- Robotics and Drones
- Industrial Automation and Smart Manufacturing
- Defense and Aerospace
- Advanced Driver Assistance Systems (ADAS)
- By Vehicle Type
- Passenger Cars
- Light Commercial Vehicles
- Heavy Commercial Vehicles
- Other Autonomous Vehicles
- By Geography
- North America
- United States
- Canada
- Mexico
- Europe
- Germany
- United Kingdom
- France
- Italy
- Spain
- Rest of Europe
- Asia-Pacific
- China
- Japan
- South Korea
- India
- Rest of Asia-Pacific
- South America
- Brazil
- Argentina
- Rest of South America
- Middle East
- Saudi Arabia
- United Arab Emirates
- Turkey
- Rest of Middle East
- Africa
- South Africa
- Nigeria
- Egypt
- Rest of Africa
- North America
Detailed Research Methodology and Data Validation
Primary Research
Analysts next interview Tier-1 ADAS suppliers, perception-stack software leads, automotive semiconductor strategists, and regional homologation experts across North America, Europe, and Asia Pacific. These conversations validate attach-rate assumptions, sensor-suite cost trajectories, and regulatory timing, while filling gaps that desk sources leave open.
Desk Research
We rely first on authoritative, non-paywalled datasets such as UNECE Regulation 157 filings, Euro NCAP test results, the World Bank's motor-vehicle parc series, and UN Comtrade shipment codes for cameras, radars, and LiDARs. Trade association white papers from ACEA and SAE, peer-reviewed IEEE journal articles on perception architectures, and company disclosures mined through D&B Hoovers and Dow Jones Factiva enrich the baseline. Newsflow on component ASP trends is screened daily. This list is illustrative; dozens of additional documents inform the evidence file.
Market-Sizing & Forecasting
Top-down reconstruction begins with light-vehicle production and selected off-highway platforms, applies weighted attach rates for multi-sensor suites, and then multiplies by blended sensor-fusion controller ASPs. We corroborate totals with selective bottom-up checks, Tier-1 quarterly revenues, and sampled BOM roll-ups to fine-tune outliers. Key variables include global vehicle output, ADAS penetration by SAE level, sensor ASP erosion curves, LiDAR cost roadmaps, and regional safety-mandate deadlines. A multivariate regression-based forecast projects 2026-2030 demand under baseline, conservative, and accelerated-automation scenarios, letting analysts adjust for policy or supply shocks. Gap areas in sparse bottom-up datapoints are bridged with Monte-Carlo ranges reviewed by subject experts.
Data Validation & Update Cycle
Model outputs pass variance checks against independent indicators such as microcontroller shipments and radar unit export volumes. Senior reviewers sign off only after anomalies are resolved. Reports refresh annually, with mid-cycle updates when material events, such as regulation, major recall, or cost inflection, occur; an analyst re-verifies numbers before client delivery.
Why Our Sensor Fusion Baseline Commands Reliability
Published estimates often differ because providers pick distinct scopes, base years, and adoption curves. We acknowledge the spread yet maintain that Mordor's disciplined definition, multi-source variables, and yearly refresh yield a steadier compass for planners.
Key gap drivers include differing inclusion of non-automotive devices, single-year currency conversion choices, aggressive sensor-price decline assumptions, and refresh cadences exceeding twenty-four months elsewhere.
Benchmark comparison
| Market Size | Anonymized source | Primary gap driver |
|---|---|---|
| USD 8.75 Bn (2025) | Mordor Intelligence | - |
| USD 5.36 Bn (2024) | Global Consultancy A | Vehicle-only scope and 2024 FX rates, limited primary validation |
| USD 6.88 Bn (2025) | Market Publisher B | Counts MEMS sensors exclusively, assumes linear ASP fall |
| USD 7.63 Bn (2025) | Industry Forecasting C | High-growth scenario without segment splits, three-year update cycle |
Differences above show how variant scopes and untested assumptions inflate or compress totals. Mordor Intelligence grounds its baseline in transparent variables, cross-checks, and timely revisions, giving decision-makers a figure they can trace and trust.


Key Questions Answered in the Report
How large will the sensor fusion market be by 2031?
It is projected to reach USD 18.21 billion by 2031, expanding at a 12.65% CAGR from 2026.
Which segment grows fastest within sensor fusion offerings?
Software is forecast to expand at a 12.68% CAGR as over-the-air updates and subscriptions gain traction.
Why is LiDAR-camera fusion gaining adoption?
Solid-state LiDAR prices are falling toward sub-USD 500, making LiDAR-camera stacks affordable for mid-segment vehicles.
Which region posts the quickest growth?
The Middle East is predicted to rise at a 12.75% CAGR through 2031, driven by defense investments.
What is the main restraint for consumer-electronics adoption?
Arbe Robotics and LeddarTech are notable for imaging-radar and software-defined LiDAR platforms that reduce integration costs..
Who are emerging disruptors in sensor fusion hardware?
The Sensor Fusion Market size was valued at USD 8.75 billion in 2025 and is estimated to grow from USD 10.02 billion in 2026 to reach USD 18.22 billion by 2030, at a CAGR of 15.80% during the forecast period (2026-2030).
Page last updated on:


