Semi-Trailer Market Size and Share
Market Overview
| Study Period | 2019 - 2031 |
|---|---|
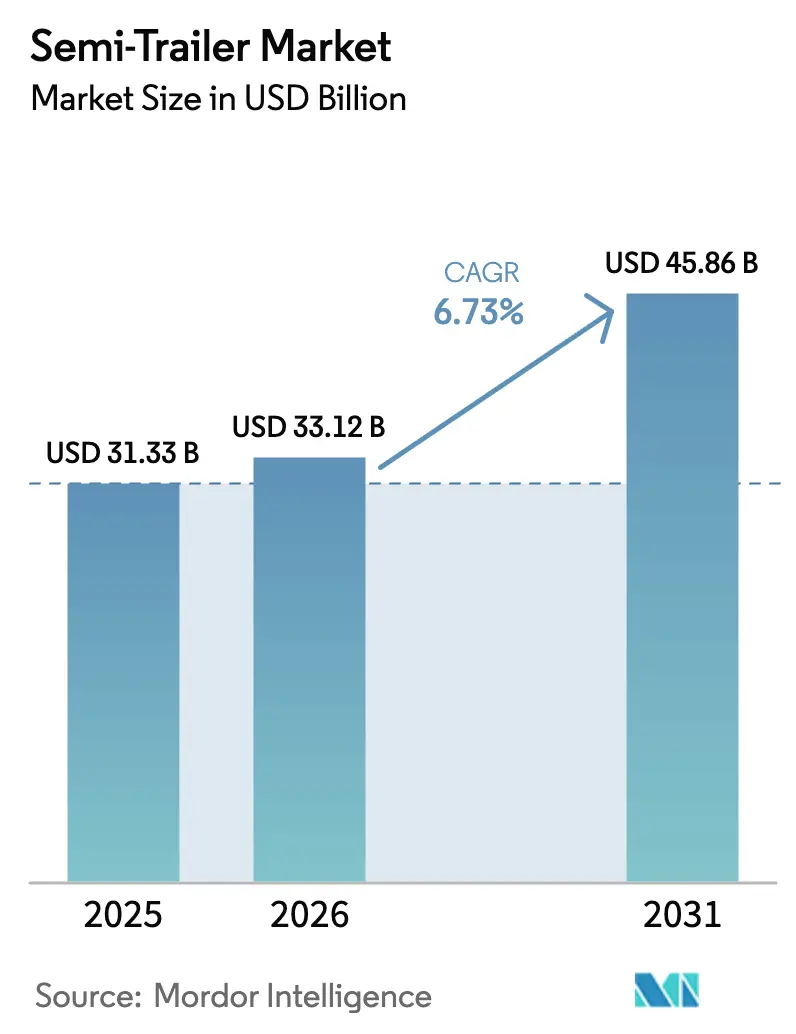
| Market Size (2026) | USD 33.12 Billion |
| Market Size (2031) | USD 45.86 Billion |
| Growth Rate (2026 - 2031) | 6.73% CAGR |
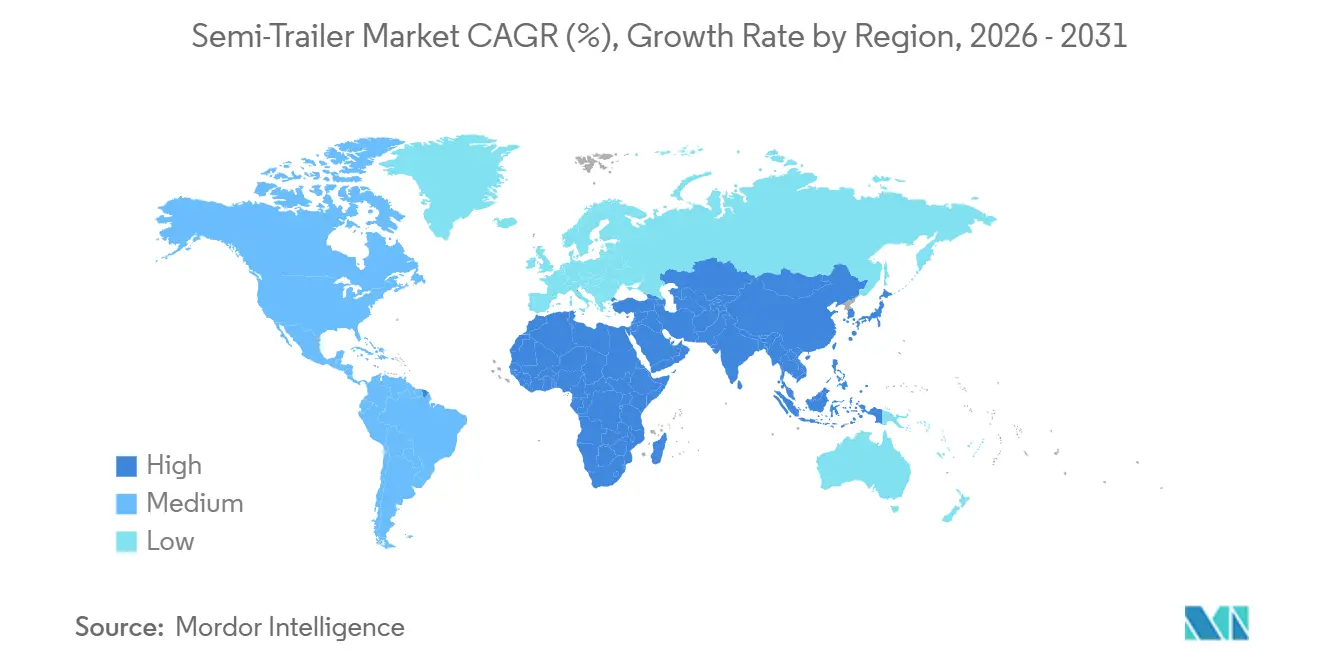
| Fastest Growing Market | Asia-Pacific |
| Largest Market | Europe |
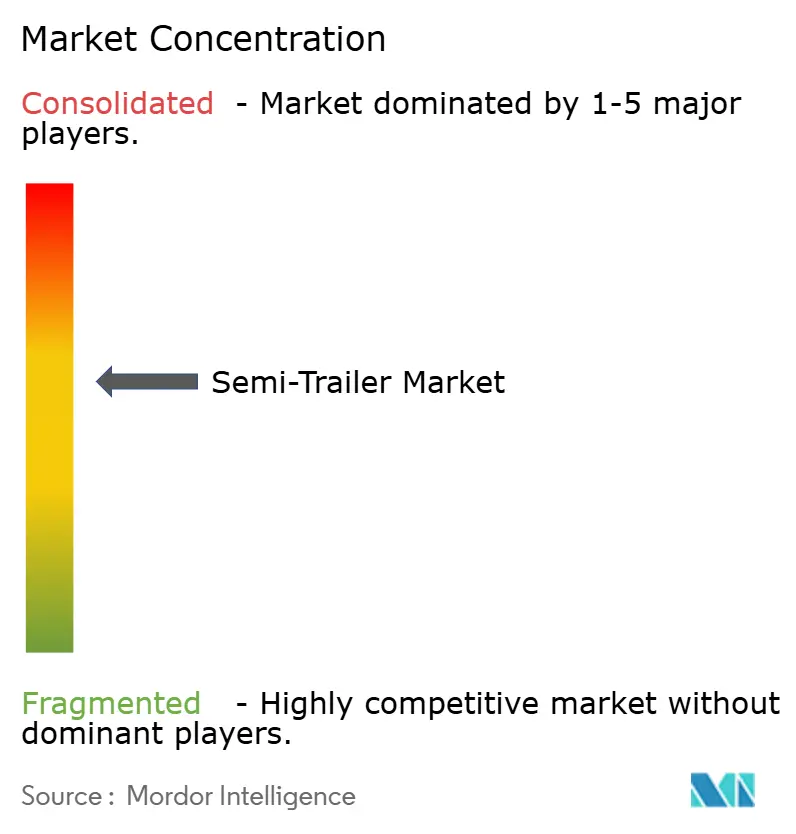
| Market Concentration | Medium |
Major Players
*Disclaimer: Major Players sorted in no particular order Image © Mordor Intelligence. Reuse requires attribution under CC BY 4.0. |
|
Semi-Trailer Market Analysis by Mordor Intelligence
The semi-trailer market size is projected to expand from USD 31.33 billion in 2025 and USD 33.12 billion in 2026 to USD 45.86 billion by 2031, registering a CAGR of 6.73% between 2026 and 2031. Solid demand stems from e-commerce parcel surges, expanding cold-chain mandates, and infrastructure stimulus in high-growth economies. At the same time, volatile steel prices and elevated borrowing costs curb near-term fleet renewal. Fleet operators are weighing the upfront price of electrified axles, lightweight composites, and telematics against total-cost-of-ownership savings that vary by payload density and regional duty cycles. Manufacturers that pair modular body designs with predictive maintenance analytics are securing purchase orders from logistics firms seeking to minimize downtime. Competitive positioning, therefore, hinges on technology rollouts, warranty length, and financing flexibility rather than chassis price alone. Asia-Pacific buyers, in particular, are prioritizing ISO-compliant container chassis to navigate multimodal corridors that link ports, rail yards, and industrial parks.
Key Report Takeways
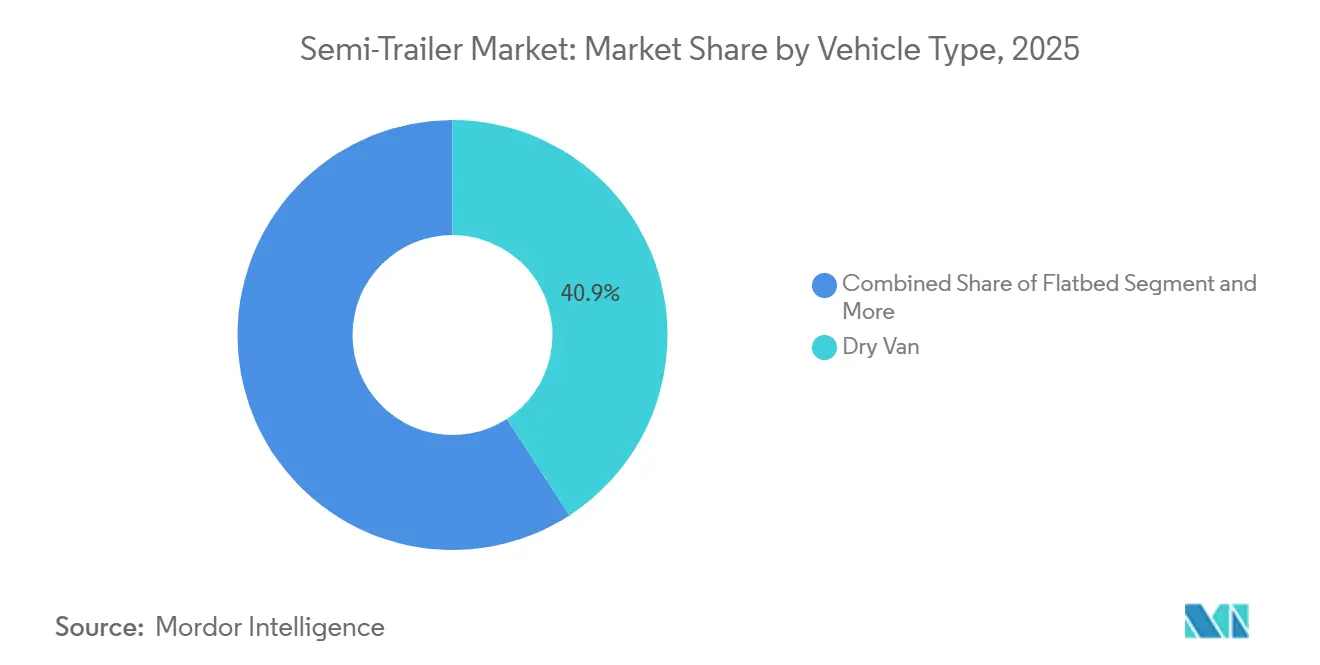
- By vehicle type, dry vans commanded a 40.85% share of the semi-trailer market in 2025, whereas refrigerated units are forecasted to expand at a 7.92% CAGR through 2031.
- By tonnage, the 25 to 50 tons bracket accounted for 42.61% of the semi-trailer market size in 2025, while trailers weighing less than 25 tons are expected to post the highest CAGR of 8.32% through 2031.
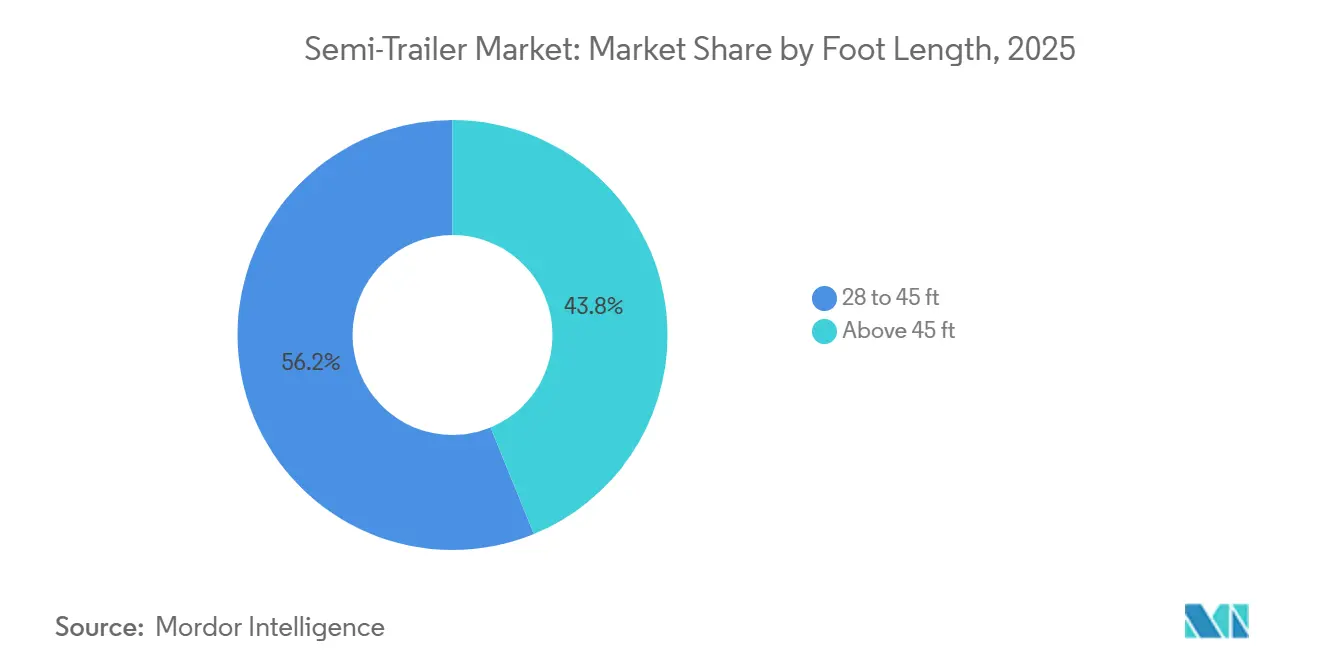
- By foot length, 28 to 45 ft trailers captured 56.19% revenue share in 2025, whereas above 45 ft configurations are advancing at an 8.12% CAGR to 2031.
- By end-use industry, transportation and logistics accounted for 40.12% of the market size in 2025; cold-chain logistics is expected to post the fastest growth at a 9.22% CAGR to 2031.
- By geography, Asia-Pacific led with 35.87% of the global market size in 2025; the Middle East and Africa region is projected to record the highest CAGR at 7.42% through 2031.
Note: Market size and forecast figures in this report are generated using Mordor Intelligence’s proprietary estimation framework, updated with the latest available data and insights as of January 2026.
Global Semi-Trailer Market Trends and Insights
Drivers Impact Analysis*
| Driver | (~)% Impact on CAGR Forecast | Geographic Relevance | Impact Timeline |
|---|---|---|---|
| E-Commerce Freight Boom | +1.8% | Global, with concentration in North America, Europe, and APAC urban corridors | Medium term (2-4 years) |
| Expansion of Cold-Chain Logistics | +1.5% | Global, led by North America and Europe for pharmaceuticals; APAC for perishables | Long term (≥ 4 years) |
| Trailer Telematics Adoption | +1.2% | North America and Europe (ELD mandates); emerging adoption in APAC and MEA | Short term (≤ 2 years) |
| Infrastructure Stimulus | +1.0% | APAC (China, India), MEA (Saudi Arabia, UAE), South America (Brazil, Argentina) | Long term (≥ 4 years) |
| Electrified Regenerative-Axle Trailers | +0.8% | North America and Europe (early adopters); pilot programs in APAC | Medium term (2-4 years) |
| 60-Ft Dry-Van Rules | +0.5% | United States (state-level pilots), Canada | Medium term (2-4 years) |
| Source: Mordor Intelligence | |||
E-Commerce Freight Boom
In 2025, logistics firms responded to a significant year-over-year surge in parcel and less-than-truckload volumes by procuring more dry vans and curtain-siders. Amazon bolstered its capacity by adding proprietary trailers, achieving notable reductions in per-mile operating costs over a multi-year amortization. Walmart's regional fulfillment centers in the United States Midwest require sub-45-ft trailers with roll-up doors to enhance dock throughput. The push for urban last-mile delivery is driving the adoption of sub-28-ft trailers, which can navigate restricted streets more adeptly than their larger counterparts. A slight increase in the United States' e-commerce sales mix translates into a substantial rise in annual trailer trips, intensifying production schedules for North American OEMs. Consequently, manufacturers offering modular interiors and quick-swap axle kits command a pricing premium, even amidst commodity challenges.
Expansion of Global Cold-Chain Logistics
The World Health Organization's 2024 guidance requires continuous temperature monitoring for biologics and vaccine shipments, a mandate that drives demand for multi-zone reefer trailers equipped with dual evaporators. Carrier Transicold’s Vector eCool electric unit, updated in 2025 with a second-generation model, eliminates diesel generators and reduces annual operating costs per trailer by a significant margin [1]"Carrier Transicold Introduces Powerful Enhancements for its Electric Vector TRU Family at ACT 2025," Carrier, carrier.com. The United States' imports of fresh produce from Mexico and Central America advanced in 2025, deepening cross-border reefer flows and supporting standardized trailer specifications between NAFTA partners. Europe’s Farm-to-Fork strategy, which aims to reduce food waste by 50% by 2030, is driving the development of controlled-atmosphere trailers that can modulate oxygen and carbon dioxide levels [2]"Farm to Fork strategy," European Commission, ec.europa.eu. Although these units cost significantly more than legacy reefers, carriers recoup the premium through higher contractual rates and lower insurance deductibles.
Trailer Telematics and Real-Time Visibility Adoption
The FMCSA electronic logging device rule laid the digital foundation, yet 2025 introduced a second adoption wave focused on trailer-centric telematics that transmit axle-load, tire-pressure, and brake-wear data every 15 minutes. Wabash National outfitted thousands of trailers with its OnTrac platform, enabling dispatchers to reroute assets and avoid overweight penalties. European fleets are integrating similar hardware to conform to tachograph requirements under the Mobility Package I, effective in 2026. Trailer-mounted GPS immobilizers helped reduce North American thefts significantly in 2025, according to TAPA, strengthening the economic case for telematics. Predictive diagnostics significantly minimize maintenance spend and extend asset life by up to 3 years, reshaping lifecycle planning assumptions.
Infrastructure Stimulus in Emerging Economies
India’s Gati Shakti National Master Plan injected huge investments to build multimodal freight corridors, accelerating demand for ISO-compliant chassis that economically transfer containers between rail and road. China’s Belt and Road Initiative earmarked over USD 100 billion for new cross-border highways, directly boosting flatbed and container-chassis orders. Saudi Arabia’s NEOM megaproject aims to more than quadruple the country's annual container throughput to 40 million TEUs by 2030, thereby increasing tanker and refrigerated trailer requirements for petrochemical and food exports. Brazil’s Rota 2030 tax incentives, extended through 2027, encouraged local OEMs to expand capacity, thereby curbing reliance on imports.
Restraints Impact Analysis*
| Restraint | (~)% Impact on CAGR Forecast | Geographic Relevance | Impact Timeline |
|---|---|---|---|
| Capex and Interest-Rate Burden | -0.9% | Global, with acute pressure in North America and Europe due to elevated borrowing costs | Short term (≤ 2 years) |
| Volatile Steel and Aluminum Prices | -0.7% | Global, particularly affecting manufacturers in North America, Europe, and China | Medium term (2-4 years) |
| Sparse Charging Infra | -0.4% | North America and Europe (early-stage deployment); limited infrastructure in APAC and MEA | Long term (≥ 4 years) |
| Weight/Length Regulatory Limits | -0.3% | Europe (Directive 96/53/EC compliance); spillover effects in markets aligning with EU standards | Long term (≥ 4 years) |
| Source: Mordor Intelligence | |||
High Capex and Interest-Rate Burden
In late 2025, U.S. benchmark rates remained elevated, though the Federal Reserve reduced the target range on December 10, 2025, to 3.5%–3.75%. This decision significantly reduced the monthly lease costs for standard 53-ft dry vans compared to previous years. In response, small fleets, already grappling with slim profit margins, extended their replacement cycles by a few years. Similarly, the European Central Bank's parallel actions made regional fleets cautious, particularly concerning reefer and tanker units with higher price points. A notable drop in leasing company order books in H1 2025 underscored their sensitivity to borrowing costs. While emerging markets mitigated the impact through state-backed loan schemes, global OEM revenue forecasts remained closely aligned with shifts in monetary policy.
Volatile Steel and Aluminum Prices
In 2025, hot-rolled coil prices on the LME fluctuated significantly, while aluminum prices also ranged widely. Manufacturers without hedging contracts faced substantial additional material costs per unit. However, they partially countered this by switching to high-strength, low-alloy steel. Chinese OEMs, benefiting from state subsidies and vertically integrated supply chains, can offer notable price advantages on comparable dry vans. Meanwhile, smaller producers in South America chose to postpone planned capacity expansions, waiting for price stability, thereby prolonging tight supply conditions.
*Our forecasts treat driver/restraint impacts as directional, not additive. The impact forecasts reflect baseline growth, mix effects, and variable interactions.
Segment Analysis
By Vehicle Type: Dry Van Dominance Meets Cold-Chain Acceleration
Dry vans captured 40.85% of the semi-trailer market share in 2025, reflecting broad use across retail, consumer goods, and general freight routes. Refrigerated trailers, however, are projected to grow at a 7.92% CAGR by 2031, a pace that outpaces every other configuration as biologics distribution and the fresh-food trade intensify. Flatbeds gain cyclical boosts from construction and heavy-machinery projects tied to global infrastructure programs, while lowboys remain niche solutions for over-dimensional cargo such as wind-turbine components. Tanker demand is skewed toward the petrochemical and bulk liquid segments, especially in shale-rich North America. In contrast, curtain-sider popularity spreads from Europe into high-volume Asian e-commerce hubs that value rapid side loading.
Carrier Transicold shipped significantly more reefer units in 2025, confirming that cold-chain fleets are willing to invest in premium hardware when service-level agreements mandate minimal spoilage. Dry-van pricing faces pressure from commoditization, prompting OEMs to differentiate themselves through aerodynamic side skirts, boat tails, and fuel-saving tires. Flatbed and lowboy producers now market modular deck systems that scale without regulatory recertification, appealing to carriers that traverse multiple jurisdictions. Curtain-sider momentum in Asia follows Japan’s revised vehicle act, which legalizes side loading and should add several thousand units annually. Tanker innovations include stainless-steel linings and multi-compartment shells that support chemical-to-food-grade backhauls, improving load factors.


By Tonnage: Mid-Range Dominance and Lightweight Momentum
The 25-to-50-ton segment accounted for 42.61% of the semi-trailer market size in 2025, favored for mid-haul corridors where axle-weight rules converge on this optimal weight range. Trailers under 25 tons are expanding fastest, with an 8.32% CAGR driven by urban delivery mandates and lightweight aluminum frames that avoid congestion pricing. The 51-to-100-ton bracket serves mining and heavy-industry corridors in Australia and Canada, while platforms exceeding 100 tons remain specialized assets that require escort vehicles and route permits. Lightweight designs shave 800–1,200 kg from tare, allowing additional cargo with no axle penalty and yielding 3-4% fuel savings.
Europe’s revised Weights and Dimensions Directive, effective in 2026, grants an additional one-ton payload allowance for Euro VI trailers, accelerating the adoption of aluminum. Schmitz Cargobull projects incremental lightweight orders annually through 2028, predominantly in the European Union—mid-range tonnage benefits from standardized parts, which ease maintenance logistics for fleets operating on time-critical lanes. Heavy-haul segments face infrastructure restrictions; many South American bridges impose 40-ton weight limits, forcing partial loads or costly permits. Tri-axle and quad-axle layouts that disperse weight more evenly are gaining traction to protect pavement integrity and unlock regulatory tolerance.
By Foot Length: Compact Standards and Extended-Length Innovation
Trailers sized 28–45 ft accounted for 56.19% of revenue share in 2025, aligned with legacy dock geometry and maneuverability requirements in crowded distribution zones. Units above 45 ft are rising at an 8.12% CAGR as North American jurisdictions pilot 60-ft dry vans to reduce trip frequency and cut carbon emissions per ton-mile. Compact lengths dominate urban realms with tight alleyways and parking scarcity, whereas extended units dominate interstate corridors with ample terminal space. Sliding tandems and extendable axles enable fleets to adjust their length to meet state-specific regulations, eliminating the need for multiple chassis SKUs.
In the United States, several states now allow 60-ft vans, which offer a significantly larger payload than traditional 53-ft models. This change yields significant fuel savings for mid-sized carriers across their route networks. However, retrofitting facilities poses a challenge: many docks need to widen their door spacing, which involves considerable costs per site. In Europe, the length cap on trailers limits innovation. Meanwhile, the Asia-Pacific region presents a mixed scenario: China permits longer trailers on select highways, but Japan imposes stricter length restrictions on most trailers. On the innovation front, compact units are now featuring carbon-fiber wall panels, reducing their overall weight. At the same time, extended-length trailers are incorporating rear-steer axles, improving their turning radius and enhancing operational capabilities.
By End-Use Industry: Logistics Leadership and Cold-Chain Surge
Transportation and logistics operators accounted for 40.12% of the market size in 2025, utilizing dry vans and flatbeds for general freight, parcel, and less-than-truckload applications. Cold-chain logistics outperforms with a 9.22% CAGR through 2031, driven by the need for continuous temperature assurance in biologics and for compliance with fresh food regulations. Food and beverage remains a core vertical, spanning both reefer and dry-van carriage for packaged goods and bulk inputs. Construction and mining users rely on flatbeds and lowboys for moving heavy equipment. At the same time, agricultural fields use grain hoppers and livestock trailers that comply with animal welfare regulations. Manufacturing distributes components via a mixed fleet of dry vans, flatbeds, and curtain-siders.
Walmart's commitment to local produce has prompted food and beverage companies to adopt multi-temperature compartments, enabling them to transport chilled and frozen goods in a single trip. In the construction sector, players are turning to extendable flatbeds to avoid the need for over-dimensional permits. Meanwhile, agricultural carriers are experimenting with climate-controlled livestock trailers equipped with real-time animal health sensors to ensure compliance with EU welfare regulations. Retailers and e-commerce businesses are opting for high-cube vans with built-in conveyor belts, enabling order consolidation on the move and reducing final-mile delivery times by up to 20%.
Geography Analysis
Asia-Pacific accounted for 35.87% of 2025 global revenue, underpinned by China’s Belt and Road corridors connecting inland provinces to Central Asia and by India’s National Logistics Policy. The region reflects heightened demand for cold-chain logistics of vaccines and perishables, as well as infrastructure upgrades in second-tier Chinese cities and Southeast Asian export zones. Japan’s legal approval of side-loading curtain-siders is expected to lift annual regional demand by several thousand units. Australia’s iron-ore sector continues to purchase heavy-duty flatbeds for millions of tons of mining output, and Southeast Asian e-commerce growth favors compact 28-ft vans maneuverable on narrow urban roads.
The Middle East and Africa are expected to register the fastest growth at 7.42%, driven by port expansions and free-zone incentives, which stimulate cross-border freight. Dubai’s Jebel Ali extension added 5 million TEU capacity by 2027, while Saudi Arabia’s NEOM hub invites specialized tanker and reefer fleets. Turkey’s role as a bridge into Europe drove a substantial rise in refrigerated-trailer registrations in 2025, fueled by agro-food exports. South Africa’s rail modernization promotes container-chassis demand that integrates with intermodal terminals, trimming highway congestion and cutting logistics costs. Infrastructure limitations persist in sub-Saharan corridors, yet concessional finance packages and public-private partnerships are gradually narrowing the gap.
North America is growing due to fleet maturity, but it also receives policy boosts from 60-ft dry-van pilots. EPA Phase 3 trailer emissions rules, effective 2027, oblige aerodynamic skirts and low-rolling-resistance tires, reshaping purchase specs. Canada’s zero-emission sales mandates foster compatibility with regenerative axles in electric tractors. Europe's expansion is hampered by strict weight-length limits and elevated interest rates that stretch replacement horizons. South America's rise is supported by Brazil’s Rota 2030 tax relief for domestic trailers and by Argentina’s shale logistics, which require specialized tankers.

Regulatory Landscape
Semi-trailer design, safety, and compliance requirements are tightening alongside decarbonization rules for heavy-duty transport systems. In the European Union, Regulation (EU) 2024/1610 extends CO2 reduction requirements to trailers through type-approval style frameworks and the validation of CO2-reducing technologies, pushing OEMs toward aerodynamics, lightweighting, and electrified trailer functions that can be credited in certification models. The EU further clarified compliance mechanics for 2025-2029 with Regulation (EU) 2026/1046 on emission credit calculation, while the Council of the European Union adopted targeted flexibility for manufacturers under Regulation (EU) 2019/1242 during the same 2025-2029 reporting window, shaping how fleets and OEMs sequence spec upgrades.
In the United States, FMCSA has continued to refine Federal Motor Carrier Safety Regulations affecting trailer equipment and compliance burden. Final rules published in February 2026 removed the requirement for rear impact guard certification labels or markings, while keeping the underlying safety performance requirements. The rules also created an exception (effective March 23, 2026) to the prohibition on gravity and syphon fuel feeds for certain auxiliary pumps (5 gallons or less) mounted on trailer chassis or beds. Alongside these updates, global harmonization continues through UNECE WP.29 regulations and global technical regulations, which many markets reference when aligning technical performance and safety expectations for trailers used in cross-border freight.
Value Chain Analysis
The semi-trailer value chain begins with upstream inputs such as hot-rolled steel, aluminum, tires, axles, braking systems, lighting, refrigeration units for reefers, and fast-growing electronics including telematics devices, sensors, and EBS diagnostics. OEMs convert these inputs through fabrication and assembly steps, including frame welding, panel forming, insulation and refrigerated unit integration, finishing and painting, and compliance testing. Distribution runs through direct sales to large fleets and 3PLs, dealers for SME customers, and increasingly through multi-year framework procurement that bundles hardware with digital services, maintenance support, and financing.
In 2025-2026, value capture has shifted toward integrated platforms and secured capability footprints through partnerships and equity moves. Schmitz Cargobull took a 48% stake in GT Trailers (March 2025) to combine expertise in superstructures, refrigerated solutions, and tarpaulin systems. Waberer’s Group and BPW Group signed a strategic partnership (June 2026) pairing BPW axle technology with telematics (2,200 idem units) as part of a 2026 fleet renewal, reflecting demand for connected-trailer packages. The chain also includes specialized programs where end-use requirements shape supplier participation and certification pathways, including Rheinmetall and Nooteboom Trailers cooperating (March 2026) to develop and industrialize military heavy equipment trailer solutions for production in Romania, and hybridization initiatives for heavy-duty combinations such as MLG and Mick Murray Welding forming a joint venture (July 2026) to develop a hybrid-electric road train.
Competitive Landscape
Global semi-trailer supply is moderately concentrated. Incumbents are shifting from steel-intensive chassis to aluminum and composites that reduce tare weight by 10%–15% and comply with forthcoming greenhouse gas regulations. Larger OEMs are vertically integrating their telematics and refrigeration subsidiaries to offer turnkey solutions, securing multi-year contracts with 3PLs. Smaller entrants counter by offering rapid customization for e-commerce fleets, emphasizing lead-time agility and low minimum order quantities.
Technological differentiation is intensifying. Hyliion launched an electric axle retrofit kit that promises significant fuel savings without requiring a new tractor, targeting North America’s installed base of millions of trailers. Chinese manufacturers benefit from state subsidies and integrated steel supply, which enables them to offer price discounts that pressure Western OEM margins. In response, incumbents highlight their service networks, warranty terms, and adherence to ISO 9001 standards.
Strategic risks center on monetary policy and volatility in raw materials. Interest rates above 4% increase leasing expenses, especially for SMEs, while hot-rolled coil price fluctuations of USD 700–950 per ton distort budgeting. OEMs with long-term steel contracts or in-house fabrication mitigate margin erosion. Electrified regenerative-axle adoption remains constrained by sparse charging infrastructure, yet pilot projects with national fleets indicate growing momentum. Autonomous-ready trailers that incorporate V2V interfaces and redundant braking systems are under field trials, positioning early movers for future platooning regulations.
Semi-Trailer Industry Leaders
-
Schmitz Cargobull AG
-
Krone GmbH & Co. KG
-
Hyundai Translead
-
Wabash National Corporation
-
Great Dane LLC
- *Disclaimer: Major Players sorted in no particular order

Market Opportunities and Future Outlook
Production localization and capacity additions are creating room for OEMs that can deliver shorter lead times and higher customization while meeting tightening safety and emissions-linked specifications. In North America, Hyundai Translead announced plans to build two manufacturing facilities in Will County, Illinois, with a USD 450 million investment intended to lift U.S. trailer production capacity by 2027. Reitnouer ramped operations at a new 450,000-square-foot manufacturing and fabricating facility in Pennsylvania following a USD 60 million investment (May 2026). Separately, Stoughton Trailers expanded refrigerated manufacturing capability via an Evansville facility reconfiguration that increased reefer floor space by 87% (March 2026), supporting reefer availability for cold-chain demand tied to continuous temperature monitoring requirements.
In Europe, compliance-led spec changes and regulatory debate are accelerating differentiation around verified CO2-reducing technologies, telematics, and lightweight construction. Schmitz Cargobull started operations at a new assembly plant in Oradea, Romania (March 2026) for curtainsiders and tippers, strengthening regional supply for high-volume general freight and construction-linked cycles. Industry pushback is also evident, with groups of European trailer manufacturers filing an appeal and organizing petitions in mid-2026 seeking changes to Regulation (EU) 2024/1610 and VECTO methodology. This highlights ongoing uncertainty around compliance cost allocation and measurement, and it creates a pathway for suppliers that can substantiate performance benefits with data and validated configurations rather than relying only on mechanical upgrades.
Recent Industry Developments
- June 2026: KRONE released an updated generation of its Cool Liner refrigerated semi-trailer with design optimizations to the insulated structure. The upgrade supports fleets tightening temperature-control performance and energy-efficiency requirements in reefer operations, while giving KRONE a refreshed product platform to defend share in premium refrigerated segments.
- November 2025: Sany announced its e263 4x2 electric semi-tractor for a European launch in 2026, pairing a 636-kWh battery with an 800 V platform and a stated 500 km range at 42-ton gross combination weight. Even though it is a tractor, the launch plan increases interoperability and spec-alignment needs for electrified and connected trailers operating in European long-haul corridors.
- February 2024: Range Energy raised USD 23.5 million to accelerate commercial rollout of electrified dry-van and reefer platforms, with full-scale production slated for 2025. The funding highlighted continued investment in trailer-side electrification architectures that can reduce tractor fuel use and support reefer power strategies, influencing OEM roadmaps and supplier plans for e-axles and controls.


Research Methodology Framework and Report Scope
Market Definition and Coverage
The semi-trailer market is defined as the value of brand-new, factory-built semi-trailers sold for on-road freight movement, where the trailer relies on a fifth-wheel coupling for front support. Market value is treated at ex-factory pricing.
Scope exclusions: used semi-trailer resale, rental income, and dealership or service revenues are excluded from the market size.
Segmentation Overview
-
By Vehicle Type
- Flatbed
- Dry Van
- Refrigerated (Reefer)
- Lowboy
- Tanker
- Curtain-Sider
- Other Types
-
By Tonnage
- Below 25 Ton
- 25 Ton - 50 Ton
- 51 Ton - 100 Ton
- Above 100 Ton
-
By Foot Length
- 28 - 45 ft
- Above 45 ft
-
By End-Use Industry
- Transportation and Logistics
- Food and Beverage
- Construction nd Mining
- Agriculture
- Manufacturing and Industrial Goods
- Retail and E-commerce
-
By Geography
-
North America
- United States
- Canada
- Rest of North America
-
South America
- Brazil
- Argentina
- Rest of South America
-
Europe
- Germany
- United Kingdom
- France
- Italy
- Spain
- Russia
- Rest of Europe
-
Asia-Pacific
- China
- India
- Japan
- South Korea
- Australia
- Rest of Asia-Pacific
-
Middle East and Africa
- Turkey
- Saudi Arabia
- United Arab Emirates
- South Africa
- Rest of Middle East and Africa
-
North America
Data Sources, Market Sizing, and Validation
Desk Research
Desk work starts by building a fact base for freight activity, vehicle production, and trade flows that influence semi-trailer demand. We typically rely on public sources such as national transport departments, customs and trade statistics portals, industry and road freight associations, and vehicle safety or compliance agencies, followed by supporting information from company annual reports, investor presentations, and reputable logistics press.
After the base data is assembled, it is cleaned and aligned so the units make sense together. For example, trailer production and registrations are checked against fleet utilization signals and macro indicators linked to goods movement. In a few places, paid subscriptions are used only to speed up company financial screening, patent lookups, and shipment-level import and export checks when public series are missing or delayed. These desk research sources are illustrative, and other references are used to collect, validate, and clarify specific data points during the work.
Primary Interviews and Surveys
Primary inputs are gathered through expert interviews and structured surveys with trailer manufacturers, component suppliers, dealers, fleet operators, and logistics buyers, which helps us verify real ordering patterns and price movements. For a global market like this, the coverage is balanced across major demand centers, and the interviews focus on trailer replacement cycles, regulation-driven upgrades, and differences in demand between long-haul and regional haul use.
Distribution of primary research fieldwork respondents
| Company type | Respondent position | Region |
|---|---|---|
| Top tier: 25% | CXOs: 16% | APAC: 49% |
| Mid tier: 59% | Functional/Unit leaders: 31% | EMEA: 33% |
| Smaller Players: 16% | Managers: 53% | Americas: 18% |
Market-Sizing & Forecasting
Sizing is developed using top-down and bottom-up logic, where the demand pool is reconstructed from freight activity and vehicle utilization indicators, then cross-checked against supply-side reality. The top-down side leans on market-specific signals such as road freight ton-kilometers, tractor and trailer registrations, fleet replacement timing, and manufacturing output trends that influence shipping intensity.
To keep the totals practical, selective bottom-up approximations are used to corroborate the model. This includes sampled average selling prices by major trailer types multiplied by estimated unit demand, plus channel checks with dealers and fleets to validate whether volumes align with the macro picture. Key inputs include trailer mix shifts (dry van versus refrigerated versus flatbed), axle and payload preferences by route type, steel price direction that affects ex-factory pricing, and regulatory triggers that accelerate replacement, including braking and safety compliance requirements. Where bottom-up coverage is incomplete in smaller countries, gaps are filled using proxy variables like freight growth and vehicle parc aging, then adjusted through interview-based normalization.
For forecasting, scenario analysis is applied around freight growth, replacement cycles, and price progression, followed by light regression checks to keep year-to-year changes consistent with the demand drivers. Assumptions are reviewed with primary respondents so the outlook reflects what fleets and suppliers are planning, not only what historical trend lines suggest.
Data Validation & Update Cycle
Validation is done through repeated cross-checks across independent signals, so the market total is not dependent on a single data series. We compare implied trailer units and value against production capacity cues, registration or parc direction, and price movement logic, then review outliers before the model is finalized.
A multi-step analyst review is followed, where questionable jumps are reworked and, when needed, experts are re-contacted to confirm the assumption that caused the variance. Reports are refreshed annually, and interim updates are made when material events change demand or pricing, followed by a final pre-delivery pass so clients receive the latest updated view.
Mordor Intelligence's Semi Trailer Market Size Compared With Other Published Estimates
Published market sizes for semi-trailers often differ because analysts do not always count the same revenue pool, year, or pricing point. Those choices can shift the total by several billions. Differences also show up when some studies emphasize unit shipments, while others lean more on value-based pricing assumptions that may not match what manufacturers are actually charging.
Used semi-trailer resale and rental revenue sit outside Mordor Intelligence's scope, which can make the market look smaller than estimates that blend new builds with downstream transactions and services. The spread also comes from how ex-factory prices are projected through steel cost swings, how trailer type mix is treated (especially refrigerated and specialized units), and whether the base year is set to a high-demand year or a softer replacement year, followed by currency conversion timing that can change global totals.
Benchmark comparison
| Source | Market Size | Gaps in Research Methodology |
|---|---|---|
| Mordor Intelligence | USD 31.33 B (2025) | |
| Industry Publisher A | USD 22.80 B (2024) | Uses a 2024 base year and does not clearly state whether the value is strictly ex-factory new-build revenue, which can undercount pricing uplift and specialized trailer mix effects. |
| Global Consultancy B | USD 36.20 B (2024) | Quotes a higher 2024 value that may reflect a broader revenue pool and different price progression assumptions, which can push totals above a new-build, ex-factory-only definition. |
The comparison shows that the biggest differences are usually caused by what gets counted as market revenue, the year used for the headline number, and how pricing is carried forward. By keeping the inputs tied to observable freight demand signals and repeatable pricing logic, our estimate stays easier to reconcile across regions and trailer types.


Key Questions Answered in the Report
How large is the semi-trailer market in 2026?
The semi-trailer market size stood at USD 33.12 billion in 2026.
What is the expected growth rate through 2031?
Market value is projected to expand at a 6.73% CAGR, reaching USD 45.86 billion by 2031.
Which vehicle type leads current demand?
Dry vans hold 40.85% of 2025 market revenue, supported by retail and e-commerce freight.
Which region shows the fastest growth?
The Middle East and Africa are projected to post the highest CAGR at 7.42% through 2031.
Why are refrigerated trailers growing quickly?
Biologics distribution guidelines and rising perishable-food trade boost reefer demand at a 7.92% CAGR.
Page last updated on:


