Market Overview
| Study Period | 2018 - 2031 |
|---|---|
| Forecast Data Period | 2026 - 2031 |
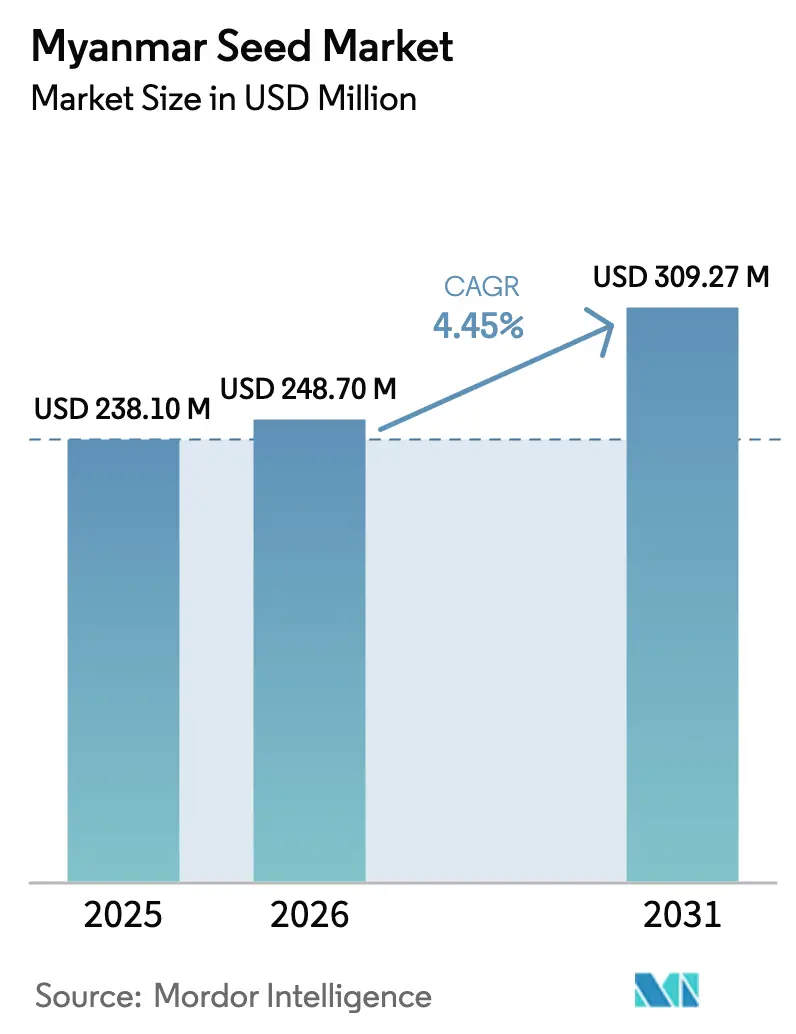
| Base Year Market Size (2025) | USD 238.10 Million |
| Market Size (2026) | USD 248.7 Million |
| Market Size (2031) | USD 309.27 Million |
| Growth Rate (2026 - 2031) | 4.45% CAGR |
| Market Concentration | Low |
Major Players *Disclaimer: Major Players sorted in no particular order Image © Mordor Intelligence. Reuse requires attribution under CC BY 4.0. | |
Myanmar Seed Market Analysis by Mordor Intelligence
Myanmar seed market size in 2026 is estimated at USD 248.7 million, growing from 2025 value of USD 238.10 million with 2031 projections showing USD 309.27 million, growing at 4.45% CAGR over 2026-2031. Rising farmer preference for hybrid maize and rice, ongoing government subsidies that waive import duties, and steady demand for climate-resilient varieties underpin this expansion despite persistent political and economic turbulence. Hybrid seeds already occupy the mainstream, yet robust growth in protected-cultivation seed demand signals a structural shift toward high-value horticulture. Supply-chain realignment, including blockchain-enabled traceability and digital seed-trading portals, helps formal players reach growers even as many farmers continue to rely on informal channels. The Myanmar seed market is also shaped by the pending National Biosafety Framework, which could redefine regulatory pathways for transgenic traits once enacted.
Key Report Takeaways
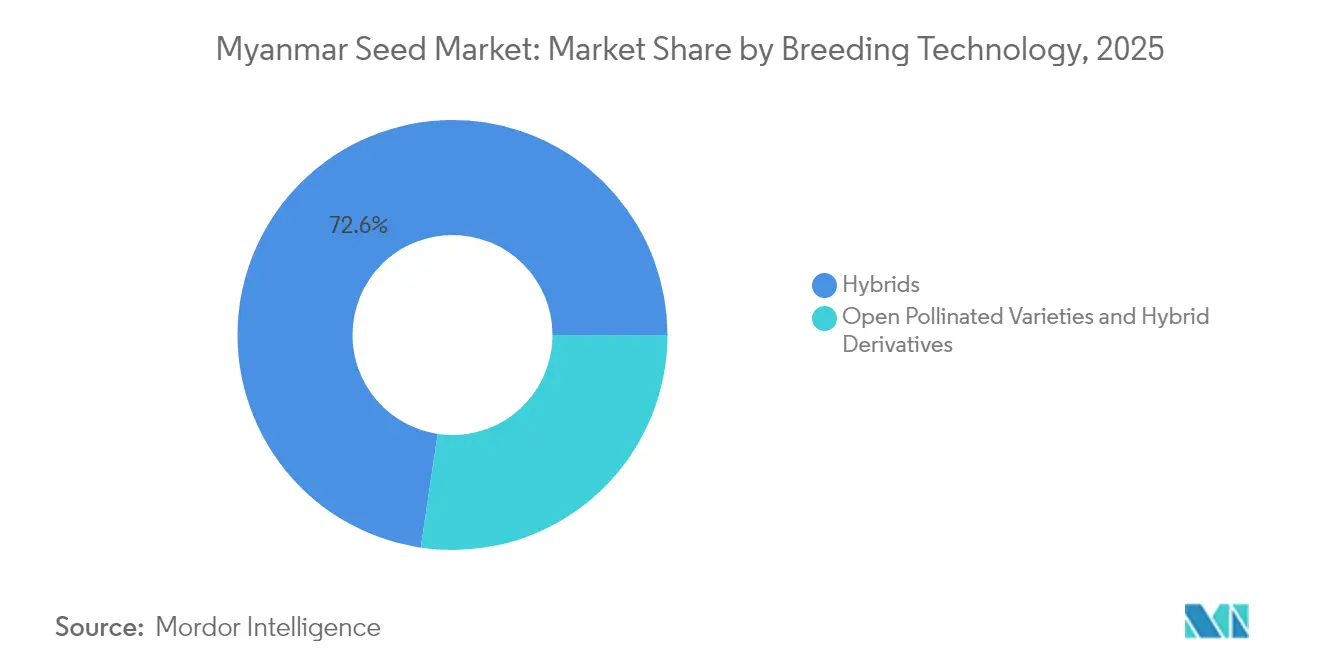
- By breeding technology, hybrids held a 72.64% Myanmar seed market share in 2025 and are also projected to advance at a 4.55% CAGR through 2031.
- By cultivation mechanism, open-field farming controlled 99.85% of the Myanmar seed market size in 2025, whereas protected cultivation seeds are forecast to expand at a 8.55% CAGR to 2031.
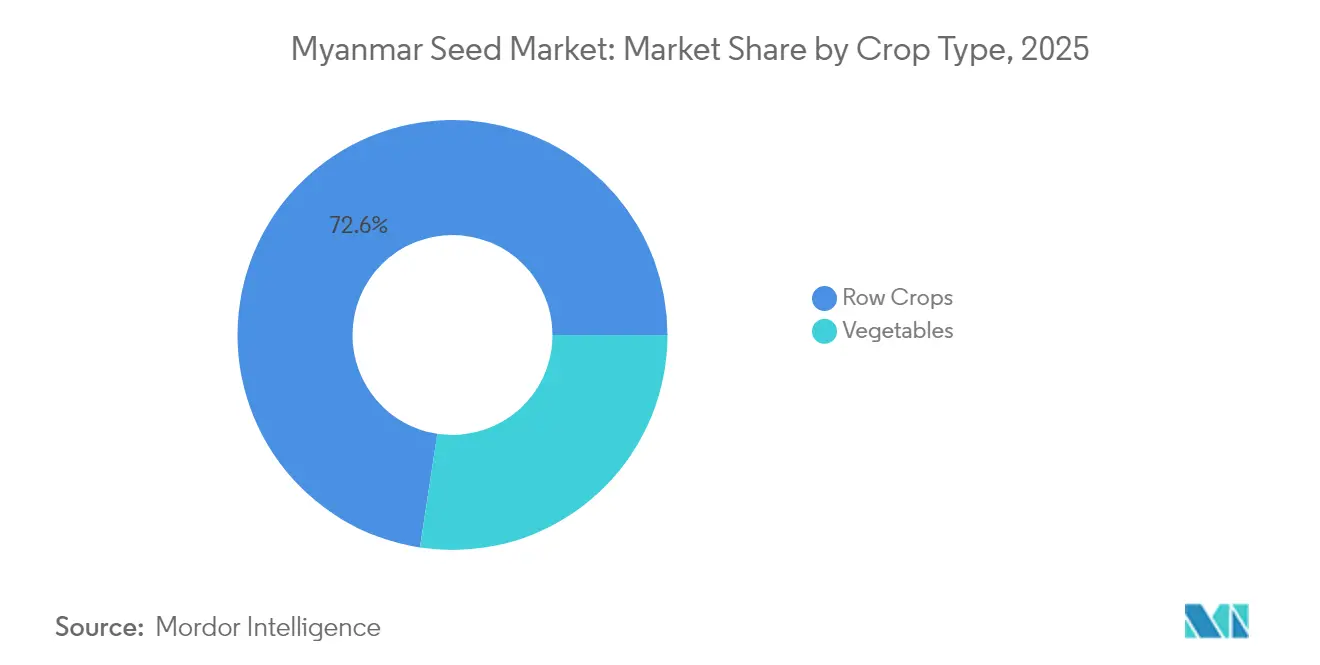
- By crop type, row crops commanded 72.58% of the Myanmar seed market in 2025, while vegetable seeds are set to grow fastest at a 4.57% CAGR through 2031.
- The Myanmar seed market is fragmented, with the top five companies, Groupe Limagrain, Rijk Zwaan, Charoen Pokphand Group, Enza Zaden, and Known You Seed, collectively holding approximately 10% of the market share.
Note: Market size and forecast figures in this report are generated using Mordor Intelligence’s proprietary estimation framework, updated with the latest available data and insights as of 2026.
Myanmar Seed Market Trends and Insights
Drivers Impact Analysis*
| Driver | (~) % Impact on CAGR Forecast | Geographic Relevance | Impact Timeline |
|---|---|---|---|
| Rising adoption of hybrid maize and rice seeds | +1.2% | National, concentrated in the Central Dry Zone and the Delta regions | Medium term (2-4 years) |
| Expansion of high-value vegetable seed demand | +0.8% | Urban periphery and export-oriented regions | Short term (≤ 2 years) |
| Government subsidies and zero-duty seed imports | +0.7% | National, with a stronger impact in rural areas | Long term (≥ 4 years) |
| Climate-resilient variety requirements | +1.0% | The Central Dry Zone, coastal areas are vulnerable to climate shocks | Long term (≥ 4 years) |
| Contract-farming buy-back programs | +0.5% | Commercial farming zones, integrated supply chains | Medium term (2-4 years) |
| Digital seed-trading platforms | +0.3% | Urban and semi-urban areas with internet connectivity | Short term (≤ 2 years) |
| Source: Mordor Intelligence | |||
Rising Adoption of Hybrid Maize and Rice Seeds
Myanmar's transition toward hybrid seed varieties accelerates as farmers recognize yield advantages despite higher input costs, with hybrid adoption particularly concentrated in commercial farming zones where mechanization enables efficient cultivation practices. The Department of Agricultural Research's genomic breeding initiatives, supported by Japan's SATREPS program, have developed Myanmar-specific rice varieties that demonstrate superior performance under local conditions. Expanded credit and extension services remain critical in sustaining the Myanmar seed market’s hybrid momentum.
Expansion of High-Value Vegetable Seed Demand
Urban dietary shifts and regional export niches are fuelling rapid growth for premium tomato, chili, and eggplant seeds. Government backing for the Myanmar Rice Online platform, now hosting 726 registered warehouses, streamlines post-harvest logistics for horticulture. Protected-cultivation pilots leverage solar-powered greenhouses to supply off-season produce, creating price premiums that justify the higher seed outlay. ASEAN trade concessions offer tariff advantages, and proximity to Thailand and China shortens transit times. Yet export realization hinges on political stability that preserves cross-border clearances and investor confidence.
Government Subsidies and Zero-Duty Seed Imports
Zero-tariff imports attract global breeders, broadening the catalogs available to smallholders. Official subsidies covering up to 30% of certified seed costs cushion adoption risks in volatile seasons[1]Source: Eiichi Kusano, “The Cold Chain for Agri-food Products in ASEAN,” Economic Research Institute for ASEAN and East Asia, eria.org. Myanmar’s revealed comparative advantage score of 211.44 in seeds signals latent export capacity, but the repatriation requirement that recently blocked 28 exporters illustrates policy inconsistency. Exchange-rate swings also raise working-capital needs for importers. Over the long term, consistent enforcement and streamlined border processes will determine how effectively such incentives translate into sustained Myanmar seed market expansion.
Climate-Resilient Variety Requirements
Prolonged dry spells and erratic monsoons in the Central Dry Zone sharpen the focus on drought-tolerant genetics. Solar-powered pumps reinstated irrigation on 1,000 hectares in Magway, enabling farmers to adopt short-duration hybrids that mature before late-season heat spikes[2]Source: China Suntree, “Suntree contributes to agricultural development in Myanmar,” chinasuntree.com. Weather index insurance pilots launched in 2023 provide risk mitigation tools that encourage the adoption of higher-value climate-resilient seeds by reducing farmer exposure to weather-related losses. The convergence of climate adaptation technologies, insurance products, and improved genetics creates market opportunities for seed companies that can deliver integrated solutions addressing both yield and risk management objectives.
Restraints Impact Analysis*
| Restraint | (~) % Impact on CAGR Forecast | Geographic Relevance | Impact Timeline |
|---|---|---|---|
| Political instability and supply-chain disruption | -1.5% | National, with severe impact on border regions | Short term (≤ 2 years) |
| Inflation-driven spike in imported seed costs | -0.8% | National, disproportionately affecting smallholders | Medium term (2-4 years) |
| Dominance of informal saved-seed channels | -0.9% | Rural areas, traditional farming communities | Long term (≥ 4 years) |
| High storage-finance costs for farmer seed enterprises | -0.6% | Rural areas with limited banking infrastructure | Medium term (2-4 years) |
| Source: Mordor Intelligence | |||
Political Instability and Supply-Chain Disruption
Post-coup turbulence hampers seed movements as roadblocks, checkpoints, and sporadic conflict disable transport corridors. One in four growers felt unsafe moving produce in 2022, forcing distributors to reroute through higher-cost paths. International firms weigh security risks against market potential, trimming inventories or partnering deeper with local agents who can navigate volatile regions. Import flows through Muse and Myawaddy remain vulnerable to sudden border closures, prolonging lead times and inflating landed costs across the Myanmar seed market.
Inflation-Driven Spike in Imported Seed Costs
Currency depreciation and import-dependent packaging inputs push up retail seed prices 20–30% year-on-year. Smallholders counter by reusing seed, slowing hybrid diffusion, especially in less commercialized townships. Working-capital strain for distributors means shorter credit windows to village retailers. Unless inflation eases, value-conscious growers may further revert to informal channels, denting formal Myanmar seed market growth prospects.
*Our forecasts treat driver/restraint impacts as directional, not additive. The impact forecasts reflect baseline growth, mix effects, and variable interactions.
Segment Analysis
By Breeding Technology: Hybrids Drive Market Transformation
Hybrids generated a commanding 72.64% Myanmar seed market share in 2025 and are on course for a 4.55% CAGR through 2031. This dominance reflects tangible yield premiums that outweigh elevated input costs, especially for maize and rice cultivated in mechanized clusters. Non-transgenic hybrids represent the primary growth driver as Myanmar's regulatory framework remains underdeveloped for transgenic varieties, with only one approved GM event, Ngwe Chi 6 Bt cotton, indicating limited near-term prospects for biotech expansion.
Continued collaboration between the Department of Agricultural Research and IRRI under the OneRice framework accelerates hybrid pipeline throughput. Demonstration farms in the Delta validate performance, boosting farmer confidence. Hybrid seed affordability depends on exchange-rate stability and timely border clearance. As commercial agriculture consolidates, demand will tilt toward single-cross hybrids that deliver the uniformity sought by contract buyers.


By Cultivation Mechanism: Protected Cultivation Emerges Despite Infrastructure Constraints
Open field cultivation maintains overwhelming dominance at 99.85% market share in 2025, reflecting Myanmar's extensive agricultural land base and limited infrastructure investment in controlled environment agriculture. Protected cultivation represents the fastest-growing segment at 8.55% CAGR through 2031, driven by export market opportunities and premium pricing for off-season vegetables.
Solar-powered facilities in Magway demonstrate viability by slashing energy outlays and stabilizing yields under erratic weather. Cold-chain expansion of capacity nationwide backs post-harvest integrity. Nevertheless, capital intensity restricts adoption to progressive growers in peri-urban zones. Access to concessional loans and technical advisory remains essential to scale protected cultivation beyond pilot clusters.
By Crop Type: Vegetables Challenge Row-Crop Dominance
Row crops command 72.58% market share in 2025, reflecting Myanmar's agricultural heritage in rice, maize, and oilseed production that forms the foundation of national food security and export earnings. Grains and cereals, particularly rice, dominate this segment, given Myanmar's position as a traditional rice exporter, with cereal production concentrated in paddy cultivation. Oilseeds, including sunflower, canola, and soybeans, benefit from processing industry development and export market access, while fiber crops, led by cotton, maintain importance in textile manufacturing regions. Pulses represent an emerging opportunity within row crops as protein demand increases and crop rotation practices expand.
Vegetable seeds, though smaller, are growing fastest at a 4.57% CAGR, buoyed by urban diets and Association of Southeast Asian Nations (ASEAN) export channels. Solanaceae and cucurbits lead volume, with tomato traceable lots fetching price premiums in Bangkok’s wholesale markets. Greenhouse projects are optimizing disease-resistant hybrids that extend shelf life. Although vegetables still trail row crops, their momentum reflects diversification goals that can cushion growers from commodity price swings.
Geography Analysis
Myanmar's seed market geography reflects the country's diverse agro-ecological zones and varying levels of agricultural commercialization, with the Ayeyarwady Delta and Central Dry Zone representing the primary demand centers for commercial seed varieties. The Delta region's rice-dominated agriculture creates substantial demand for hybrid rice seeds, while the Central Dry Zone's vulnerability to drought and heat stress drives adoption of climate-resilient varieties across multiple crop types. Northern regions, including Shan State, benefit from cross-border trade relationships and commercial farming operations, as evidenced by CP Group's 570,000-acre corn traceability system implementation that demonstrates large-scale commercial agriculture development.
Coastal areas face increasing salinity intrusion and cyclone risks that create demand for stress-tolerant varieties, while mountainous regions maintain traditional farming systems with limited commercial seed penetration. Road upgrades along the India-Myanmar-Thailand Trilateral Highway could cut delivery times, yet completion timelines remain uncertain amid funding delays. Extension service coverage is uneven; one officer serves 534 farm families on average, but Delta districts fare better than hilly Kachin. Digital advisory apps bridge some gaps, particularly where 4G coverage exceeds. Climate-risk differentiation shapes regional demand: drought-tolerant sesame in Magway, flood-tolerant rice in Rakhine, and salt-resistant sorghum along the coastal belt. Such micro-segmentation compels seed firms to diversify portfolios to secure nationwide relevance in the Myanmar seed market.
Competitive Landscape
The Myanmar seed market is fragmented, with the top five formal players capturing around 10% of share of value. Multinationals such as Syngenta, Bayer, and Corteva distribute through local agents to mitigate operational risk. Regional heavyweight CP Group leverages Southeast Asian scale to underwrite R&D and marketing, while East-West Seed’s farmer-first model delivers small-pack vegetable hybrids that suit fragmented landholdings.
Domestic champion Myanma Awba Group fields 1,500 agronomists who cover 3.2 million farm families, integrating crop protection, finance, and digital apps. This service bundle boosts brand stickiness and positions the firm to capitalize on the Myanmar seed market’s shift toward value-added solutions. Foreign entrants eye patent protection after the May 2024 implementation of Myanmar’s Patent Law, which for the first time shields plant-related inventions.
Technology adoption differentiates competitors: CP Group’s satellite analytics curbs counterfeit risk, Bayer’s Climate FieldView pilots offer variable-rate seed prescription, and Awba’s Golden Paddy marketplace links 300,000 users. Firms that marry genetics with agronomy and data services are well placed to capture future Myanmar seed market share as growers demand holistic productivity packages.
Myanmar Seed Industry Leaders
Groupe Limagrain
Known You Seed Co. LTD
Rijk Zwaan Zaadteelt en Zaadhandel BV
Enza Zaden Beheer B.V.
Charoen Pokphand Co. Ltd. (CP Group)
- *Disclaimer: Major Players sorted in no particular order

Recent Industry Developments
- March 2025: Bayer expanded its Global Smallholder Initiative, which aims to reach 100 million smallholder farmers worldwide by 2030. The program focuses on developing climate-resilient seed varieties and delivering integrated agricultural solutions through collaborations with local organizations. These efforts are expected to benefit Southeast Asian seed markets, including Myanmar, by improving access to improved seed technologies and agronomic support for smallholder farmers.
- December 2024: CP Group launched a comprehensive corn traceability system in Myanmar covering 570,000 acres in southern Shan State, utilizing satellite imagery and blockchain technology to ensure seed quality and supply chain integrity throughout the production cycle.
- May 2024: Myanmar Patent Law No. 7/2019 entered into force, providing intellectual property protection for seed innovations and plant breeding developments, with patent applications following publication of Patent Rules and fee structures.


Myanmar Seed Market Report Scope
Hybrids, Open Pollinated Varieties & Hybrid Derivatives are covered as segments by Breeding Technology. Open Field, Protected Cultivation are covered as segments by Cultivation Mechanism. Row Crops, Vegetables are covered as segments by Crop Type.Breeding Technology
| Hybrids | Non-Transgenic Hybrids | |
| Transgenic Hybrids | Insect Resistant Hybrids | |
| Open Pollinated Varieties & Hybrid Derivatives | ||
Cultivation Mechanism
| Open Field |
| Protected Cultivation |
Crop Type
| Row Crops | Fiber Crops | Cotton |
| Other Fiber Crops | ||
| Forage Crops | Alfalfa | |
| Forage Corn | ||
| Forage Sorghum | ||
| Other Forage Crops | ||
| Grains & Cereals | Corn | |
| Rice | ||
| Sorghum | ||
| Wheat | ||
| Other Grains & Cereals | ||
| Oilseeds | Canola, Rapeseed & Mustard | |
| Soybean | ||
| Sunflower | ||
| Other Oilseeds | ||
| Pulses | ||
| Vegetables | Brassicas | Cabbage |
| Carrot | ||
| Cauliflower & Broccoli | ||
| Other Brassicas | ||
| Cucurbits | Cucumber & Gherkin | |
| Pumpkin & Squash | ||
| Other Cucurbits | ||
| Roots & Bulbs | Garlic | |
| Onion | ||
| Potato | ||
| Other Roots & Bulbs | ||
| Solanaceae | Chilli | |
| Eggplant | ||
| Tomato | ||
| Other Solanaceae | ||
| Unclassified Vegetables | Asparagus | |
| Okra | ||
| Peas | ||
| Other Unclassified Vegetables | ||
| Breeding Technology | Hybrids | Non-Transgenic Hybrids | |
| Transgenic Hybrids | Insect Resistant Hybrids | ||
| Open Pollinated Varieties & Hybrid Derivatives | |||
| Cultivation Mechanism | Open Field | ||
| Protected Cultivation | |||
| Crop Type | Row Crops | Fiber Crops | Cotton |
| Other Fiber Crops | |||
| Forage Crops | Alfalfa | ||
| Forage Corn | |||
| Forage Sorghum | |||
| Other Forage Crops | |||
| Grains & Cereals | Corn | ||
| Rice | |||
| Sorghum | |||
| Wheat | |||
| Other Grains & Cereals | |||
| Oilseeds | Canola, Rapeseed & Mustard | ||
| Soybean | |||
| Sunflower | |||
| Other Oilseeds | |||
| Pulses | |||
| Vegetables | Brassicas | Cabbage | |
| Carrot | |||
| Cauliflower & Broccoli | |||
| Other Brassicas | |||
| Cucurbits | Cucumber & Gherkin | ||
| Pumpkin & Squash | |||
| Other Cucurbits | |||
| Roots & Bulbs | Garlic | ||
| Onion | |||
| Potato | |||
| Other Roots & Bulbs | |||
| Solanaceae | Chilli | ||
| Eggplant | |||
| Tomato | |||
| Other Solanaceae | |||
| Unclassified Vegetables | Asparagus | ||
| Okra | |||
| Peas | |||
| Other Unclassified Vegetables | |||


Market Definition
- Commercial Seed - For the purpose of this study, only commercial seeds have been included as part of the scope. Farm-saved Seeds, which are not commercially labeled are excluded from scope, even though a minor percentage of farm-saved seeds are exchanged commercially among farmers. The scope also excludes vegetatively reproduced crops and plant parts, which may be commercially sold in the market.
- Crop Acreage - While calculating the acreage under different crops, the Gross Cropped Area has been considered. Also known as Area Harvested, according to the Food & Agricultural Organization (FAO), this includes the total area cultivated under a particular crop across seasons.
- Seed Replacement Rate - Seed Replacement Rate is the percentage of area sown out of the total area of crop planted in the season by using certified/quality seeds other than the farm-saved seed.
- Protected Cultivation - The report defines protected cultivation as the process of growing crops in a controlled environment. This includes greenhouses, glasshouses, hydroponics, aeroponics, or any other cultivation system that protects the crop against any abiotic stress. However, cultivation in an open field using plastic mulch is excluded from this definition and is included under open field.
| Keyword | Definition |
|---|---|
| Row Crops | These are usually the field crops which include the different crop categories like grains & cereals, oilseeds, fiber crops like cotton, pulses, and forage crops. |
| Solanaceae | These are the family of flowering plants which includes tomato, chili, eggplants, and other crops. |
| Cucurbits | It represents a gourd family consisting of about 965 species in around 95 genera. The major crops considered for this study include Cucumber & Gherkin, Pumpkin and squash, and other crops. |
| Brassicas | It is a genus of plants in the cabbage and mustard family. It includes crops such as carrots, cabbage, cauliflower & broccoli. |
| Roots & Bulbs | The roots and bulbs segment includes onion, garlic, potato, and other crops. |
| Unclassified Vegetables | This segment in the report includes the crops which don’t belong to any of the above-mentioned categories. These include crops such as okra, asparagus, lettuce, peas, spinach, and others. |
| Hybrid Seed | It is the first generation of the seed produced by controlling cross-pollination and by combining two or more varieties, or species. |
| Transgenic Seed | It is a seed that is genetically modified to contain certain desirable input and/or output traits. |
| Non-Transgenic Seed | The seed produced through cross-pollination without any genetic modification. |
| Open-Pollinated Varieties & Hybrid Derivatives | Open-pollinated varieties produce seeds true to type as they cross-pollinate only with other plants of the same variety. |
| Other Solanaceae | The crops considered under other Solanaceae include bell peppers and other different peppers based on the locality of the respective countries. |
| Other Brassicaceae | The crops considered under other brassicas include radishes, turnips, Brussels sprouts, and kale. |
| Other Roots & Bulbs | The crops considered under other roots & bulbs include Sweet Potatoes and cassava. |
| Other Cucurbits | The crops considered under other cucurbits include gourds (bottle gourd, bitter gourd, ridge gourd, Snake gourd, and others). |
| Other Grains & Cereals | The crops considered under other grains & cereals include Barley, Buck Wheat, Canary Seed, Triticale, Oats, Millets, and Rye. |
| Other Fibre Crops | The crops considered under other fibers include Hemp, Jute, Agave fibers, Flax, Kenaf, Ramie, Abaca, Sisal, and Kapok. |
| Other Oilseeds | The crops considered under other oilseeds include Ground nut, Hempseed, Mustard seed, Castor seeds, safflower seeds, Sesame seeds, and Linseeds. |
| Other Forage Crops | The crops considered under other forages include Napier grass, Oat grass, White clover, Ryegrass, and Timothy. Other forage crops were considered based on the locality of the respective countries. |
| Pulses | Pigeon peas, Lentils, Broad and horse beans, Vetches, Chickpeas, Cowpeas, Lupins, and Bambara beans are the crops considered under pulses. |
| Other Unclassified Vegetables | The crops considered under other unclassified vegetables include Artichokes, Cassava Leaves, Leeks, Chicory, and String beans. |


Research Methodology
Mordor Intelligence follows a four-step methodology in all our reports.
- Step-1: IDENTIFY KEY VARIABLES: In order to build a robust forecasting methodology, the variables and factors identified in Step-1 are tested against available historical market numbers. Through an iterative process, the variables required for market forecast are set and the model is built on the basis of these variables.
- Step-2: Build a Market Model: Market-size estimations for the forecast years are in nominal terms. Inflation is not a part of the pricing, and the average selling price (ASP) is kept constant throughout the forecast period.
- Step-3: Validate and Finalize: In this important step, all market numbers, variables and analyst calls are validated through an extensive network of primary research experts from the market studied. The respondents are selected across levels and functions to generate a holistic picture of the market studied.
- Step-4: Research Outputs: Syndicated Reports, Custom Consulting Assignments, Databases, and Subscription Platforms


