
Technology, Media and Telecom
5th MayPricing Strategy for Semiconductor Components
3 Min Read
The Screenless Display Market Report is Segmented by Technology (Visual Image Displays, Retinal Projection Displays, and More), Display Type (Head-Up Display (HUD), Head-Mounted Display (HMD), Holographic Projection Kiosks, and More), Component (Hardware, Software and Firmware, and More), End-User Industry (Consumer Electronics, Automotive, and More), and Geography. The Market Forecasts are Provided in Terms of Value (USD).
Market Overview
| Study Period | 2020 - 2031 |
|---|---|
| Market Size (2026) | USD 3.97 Billion |
| Market Size (2031) | USD 8.53 Billion |
| Growth Rate (2026 - 2031) | 16.52 % CAGR |
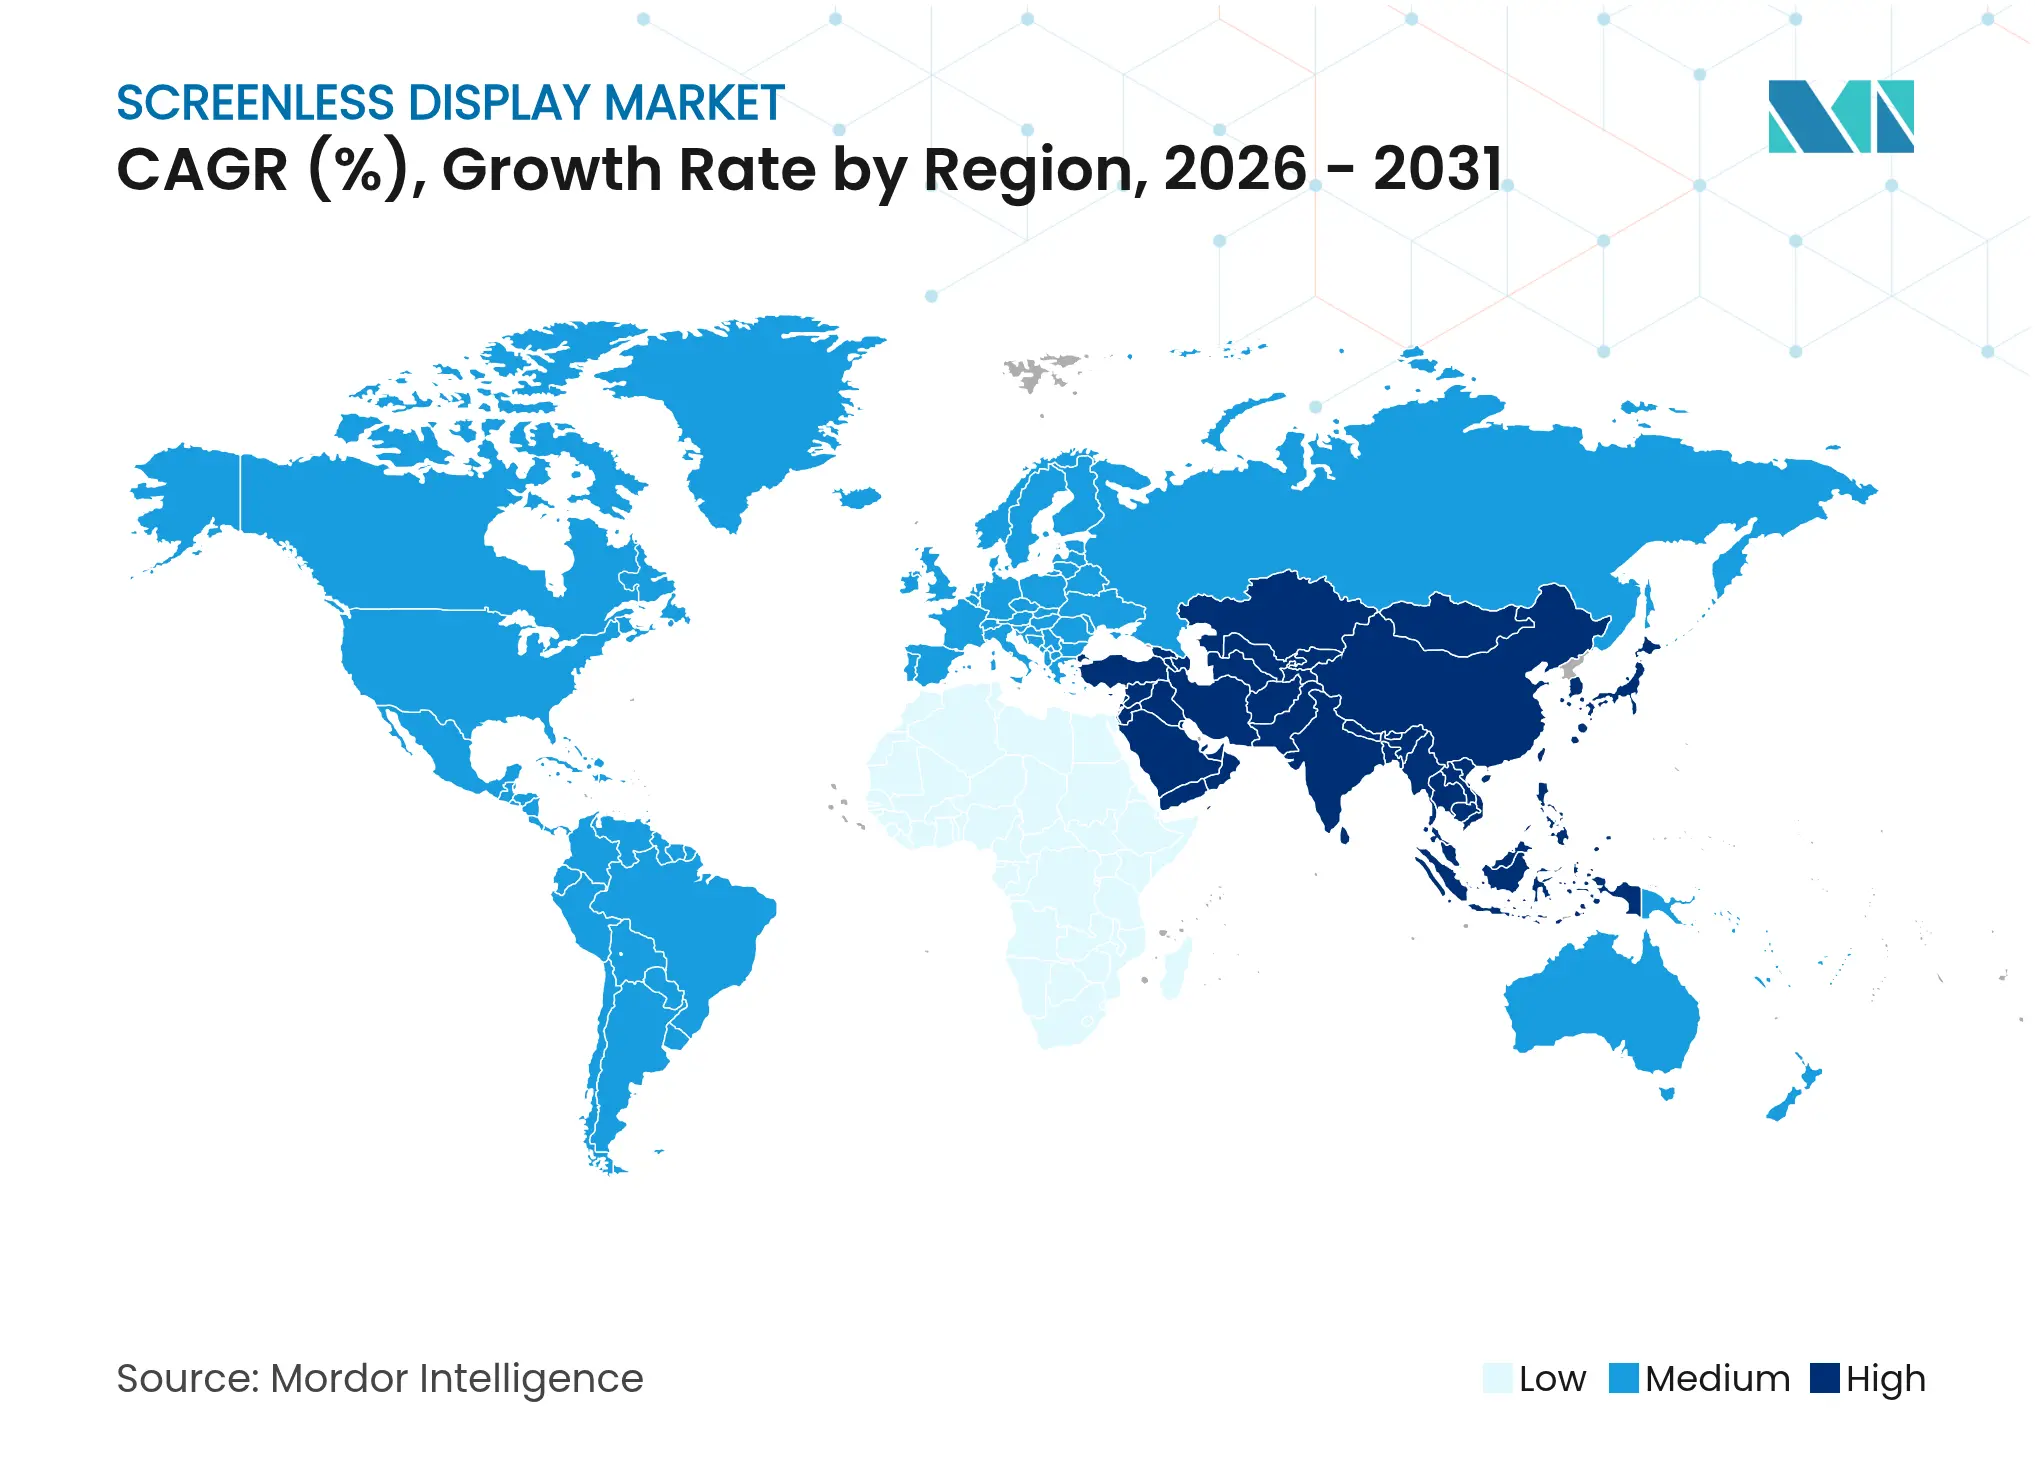
| Fastest Growing Market | Middle East |
| Largest Market | Asia |
| Market Concentration | Medium |
Major Players *Disclaimer: Major Players sorted in no particular order. Image © Mordor Intelligence. Reuse requires attribution under CC BY 4.0. |
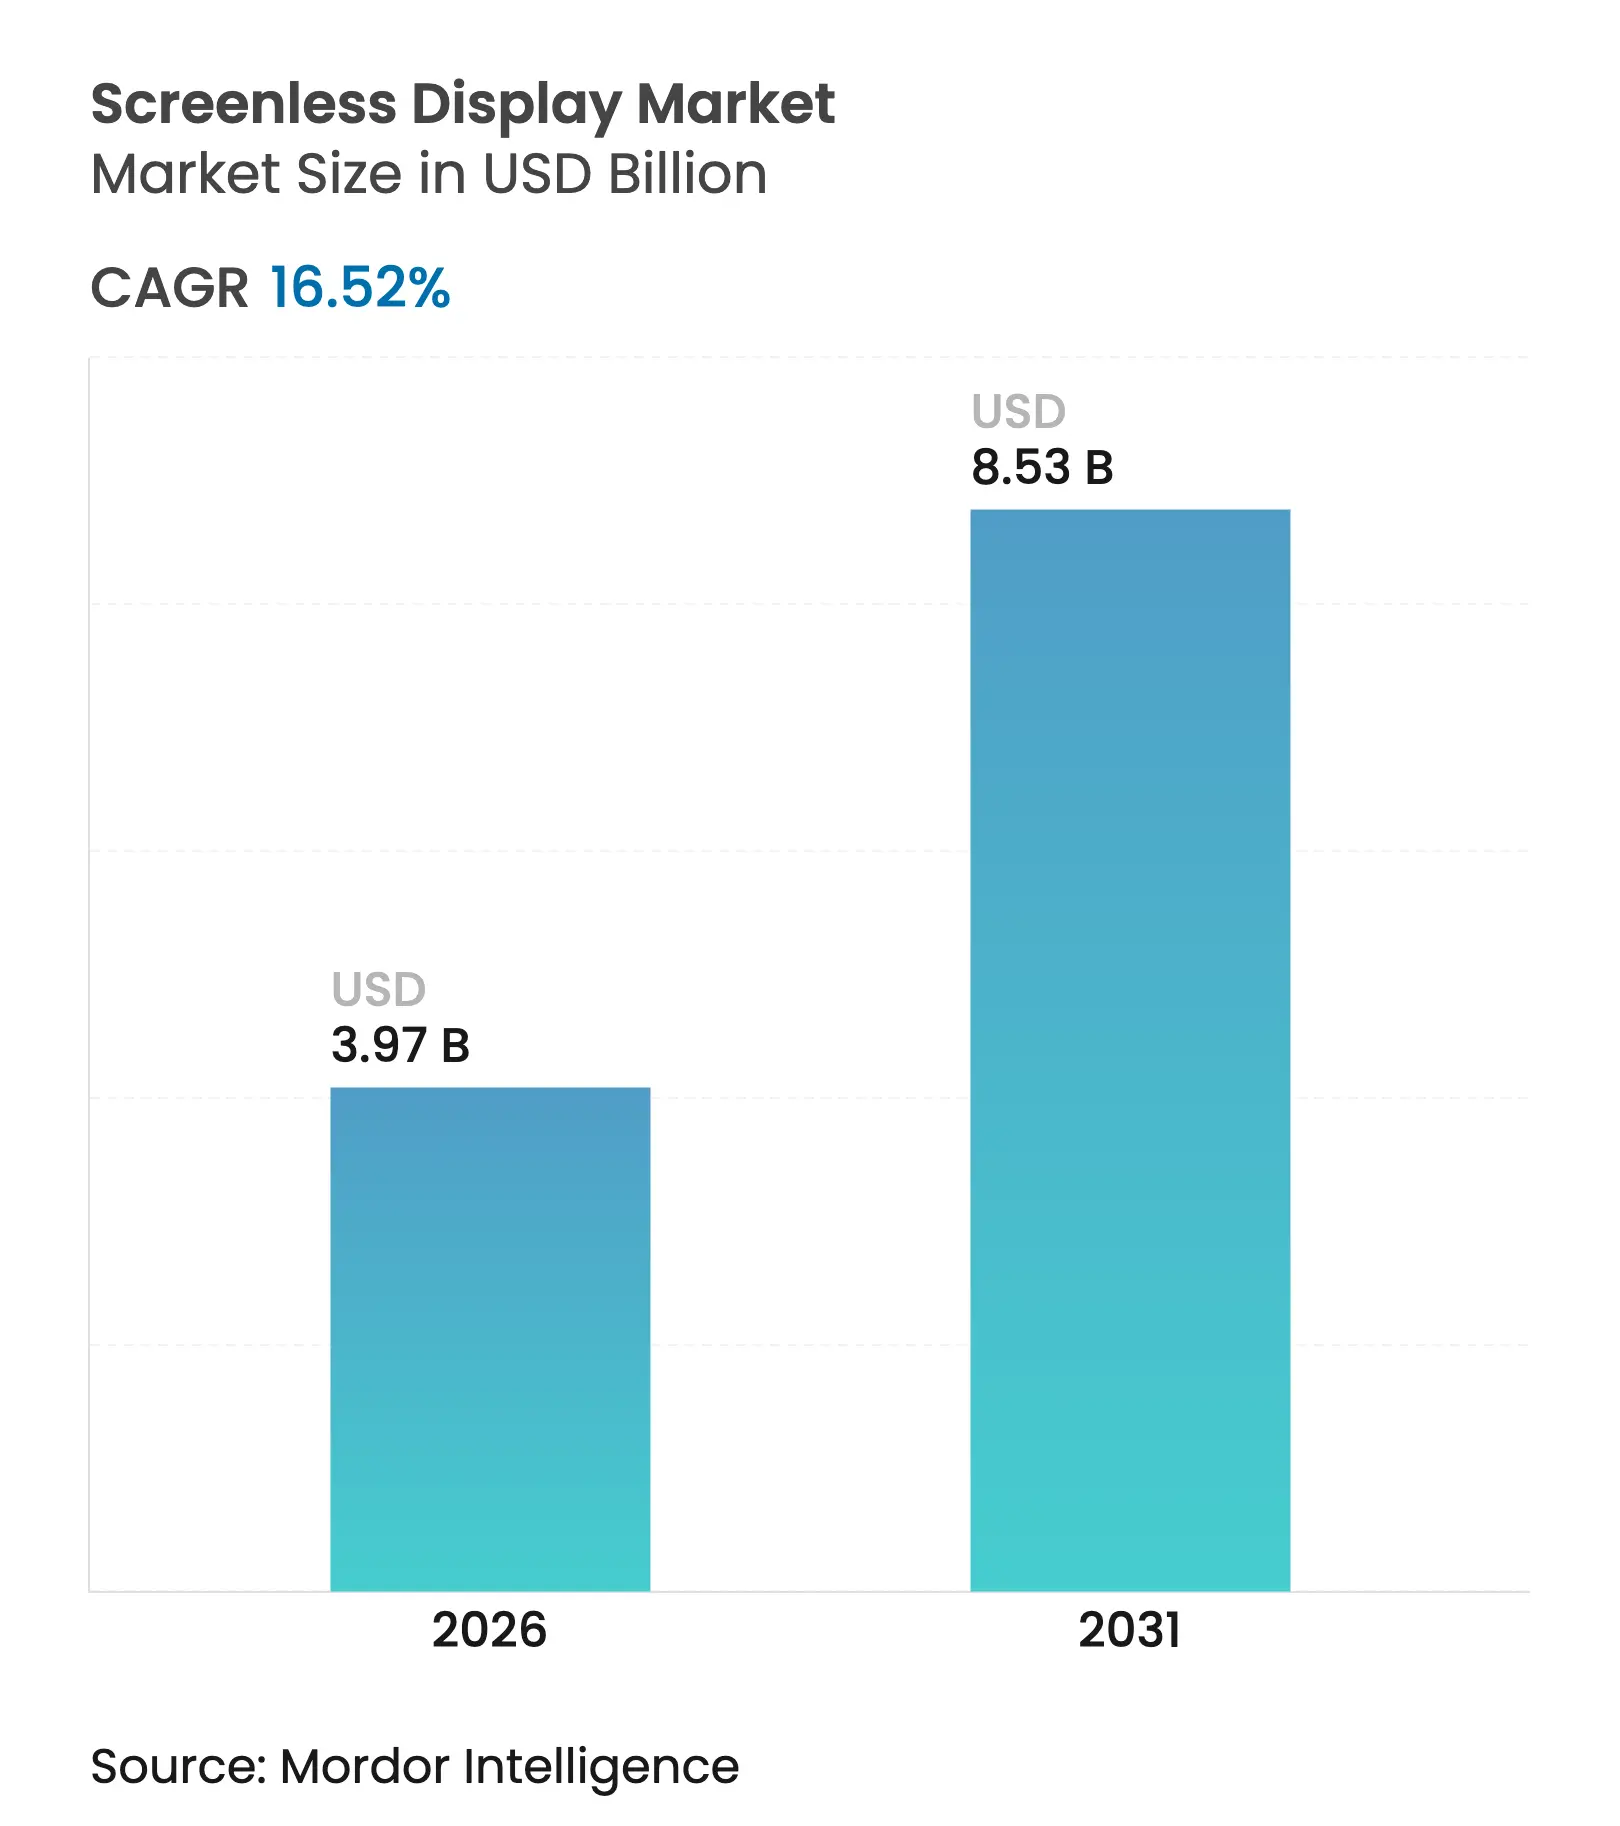
The screenless display market size in 2026 is estimated at USD 3.97 billion, growing from 2025 value of USD 3.41 billion with 2031 projections showing USD 8.53 billion, growing at 16.52% CAGR over 2026-2031. Near-term growth stems from maturing mini-LED and µLED supply chains, early regulatory clarity around retinal prosthetics, and automotive demand for augmented-reality (AR) windshields. Over the medium term, neural-interface breakthroughs, sovereign digital-transformation programs in Asia and the Middle East, and falling optical-component costs widen commercial use cases. Military procurement, notably the U.S. Army’s IVAS 1.2 order, underpins volume ramps that help drive scale benefits into civilian markets. Meanwhile, persistent supply constraints in waveguide-grade glass and photonic-safety limits on high-nits retinal projection temper the growth curve but do not derail the long-range trajectory of the screenless display market.
Key Report Takeaways
Note: Market size and forecast figures in this report are generated using Mordor Intelligence's proprietary estimation framework, updated with the latest available data and insights as of 2026.
Drivers Impact Analysis
| Driver | ( ~ ) % Impact on CAGR Forecast | Geographic Relevance | Impact Timeline | |||
|---|---|---|---|---|---|---|
Rapid mini-LED and µLED adoption enabling brighter holographic projection Rapid mini-LED and µLED adoption enabling brighter holographic projection | +3.20% | Global, with APAC manufacturing leadership | Medium term (2-4 years) | ( ~ ) % Impact on CAGR Forecast:+3.20% | Geographic Relevance:Global, with APAC manufacturing leadership | Impact Timeline:Medium term (2-4 years) |
Automotive ADAS shift toward AR windshields Automotive ADAS shift toward AR windshields | +2.80% | Europe & Asia-Pacific core, spill-over to North America | Long term (≥ 4 years) | |||
Retina-to-chip interfaces for neuro-visual prosthetics Retina-to-chip interfaces for neuro-visual prosthetics | +1.90% | United States & Israel, expanding to EU | Long term (≥ 4 years) | |||
Military demand for low-SWaP head-up displays Military demand for low-SWaP head-up displays | +2.10% | NATO countries, U.S. and European leadership | Short term (≤ 2 years) | |||
Smartphone OEM push for “ambient mode” screenless notifications Smartphone OEM push for “ambient mode” screenless notifications | +1.70% | Global, early North America & Asia adoption | Medium term (2-4 years) | |||
Multimodal XR platforms opening developer ecosystems Multimodal XR platforms opening developer ecosystems | +2.40% | United States core, expanding globally | Medium term (2-4 years) | |||
| Source: Mordor Intelligence | ||||||
Rapid mini-LED and µLED adoption enabling brighter holographic projection
Holographic systems now achieve brightness above 10^7 nits, overcoming ambient-light washout that once constrained outdoor use.[1]Light Sci Appl, “A bright future for micro-LED displays,” nature.com Pixel densities nearing 3,400 ppi allow high-resolution imagery, and sidewall passivation paired with CMOS back-planes lowers cost per lumen. The result is heightened interest from automotive, defense, and retail sectors that require sunlight-readable images.
Automotive ADAS shift toward AR windshields
European and Asian regulations incentivize embedding lane-level guidance, hazard alerts, and speed cues directly onto windshields, reducing driver refocus time from multiple seconds to sub-500 ms. [2]Texas Instruments, “Introduction to Automotive Augmented Reality Head-Up Displays Using TI DLP Technology,” ti.com Chinese AR-HUD suppliers eliminated wedge films, cutting optical losses by 30%, while EU OEMs integrate lidar data to contextualize overlays for Level 3 autonomy.
Retina-to-chip interfaces for neuro-visual prosthetics
Subretinal implants equipped with wireless digital controllers move resolution past 250 pixels, edging closer to functional vision for macular degeneration patients. Liquid-metal and graphene electrodes enhance biocompatibility, and FDA workshops now outline outcome-assessment frameworks, shortening time-to-market for future devices.
Military demand for low-SWaP head-up displays
NATO programs stipulate sub-150 g optics modules and all-day battery endurance. The U.S. Army’s USD 255 million IVAS procurement validates volume economics, and Kopin’s soldier color micro-LED contract seeds ruggedized RGB emitters for broader defense wearables
Restraints Impact Analysis
| Restraint | ( ~ ) % Impact on CAGR Forecast | Geographic Relevance | Impact Timeline | |||
|---|---|---|---|---|---|---|
Photonic safety limits for high-nits retinal projection Photonic safety limits for high-nits retinal projection | -1.80% | Global, stricter EU rules | Short term (≤ 2 years) | ( ~ ) % Impact on CAGR Forecast:-1.80% | Geographic Relevance:Global, stricter EU rules | Impact Timeline:Short term (≤ 2 years) |
Limited supply of waveguide-grade glass (Corning/Schott oligopoly) Limited supply of waveguide-grade glass (Corning/Schott oligopoly) | -2.30% | Global supply chain impact | Medium term (2-4 years) | |||
GPU thermal budget in wearables constraining battery life GPU thermal budget in wearables constraining battery life | -1.50% | Global, consumer focus | Medium term (2-4 years) | |||
Regulatory lag on Class-II implantable displays Regulatory lag on Class-II implantable displays | -1.10% | United States & Europe | Long term (≥ 4 years) | |||
| Source: Mordor Intelligence | ||||||
Photonic safety limits for high-nits retinal projection
Laser-scanned retinal displays must meet FDA 21 CFR 1040 exposure caps, curbing peak luminance in bright sun settings. EU CE marking imposes parallel constraints, extending validation loops and adding certification cost layers for manufacturers.
Limited supply of waveguide-grade glass (Corning/Schott oligopoly)
High-refractive-index substrates above 1.8 remain the domain of two suppliers, forcing long-term allocation contracts and squeezing new entrants. Schott’s RealView wafer capacity expansion to 300 mm eases volume modestly, yet demand from AR windshields and smart glasses still exceeds available melt capacity.[3]Schott AG, “SCHOTT Waveguides for Augmented Reality,” schott.com
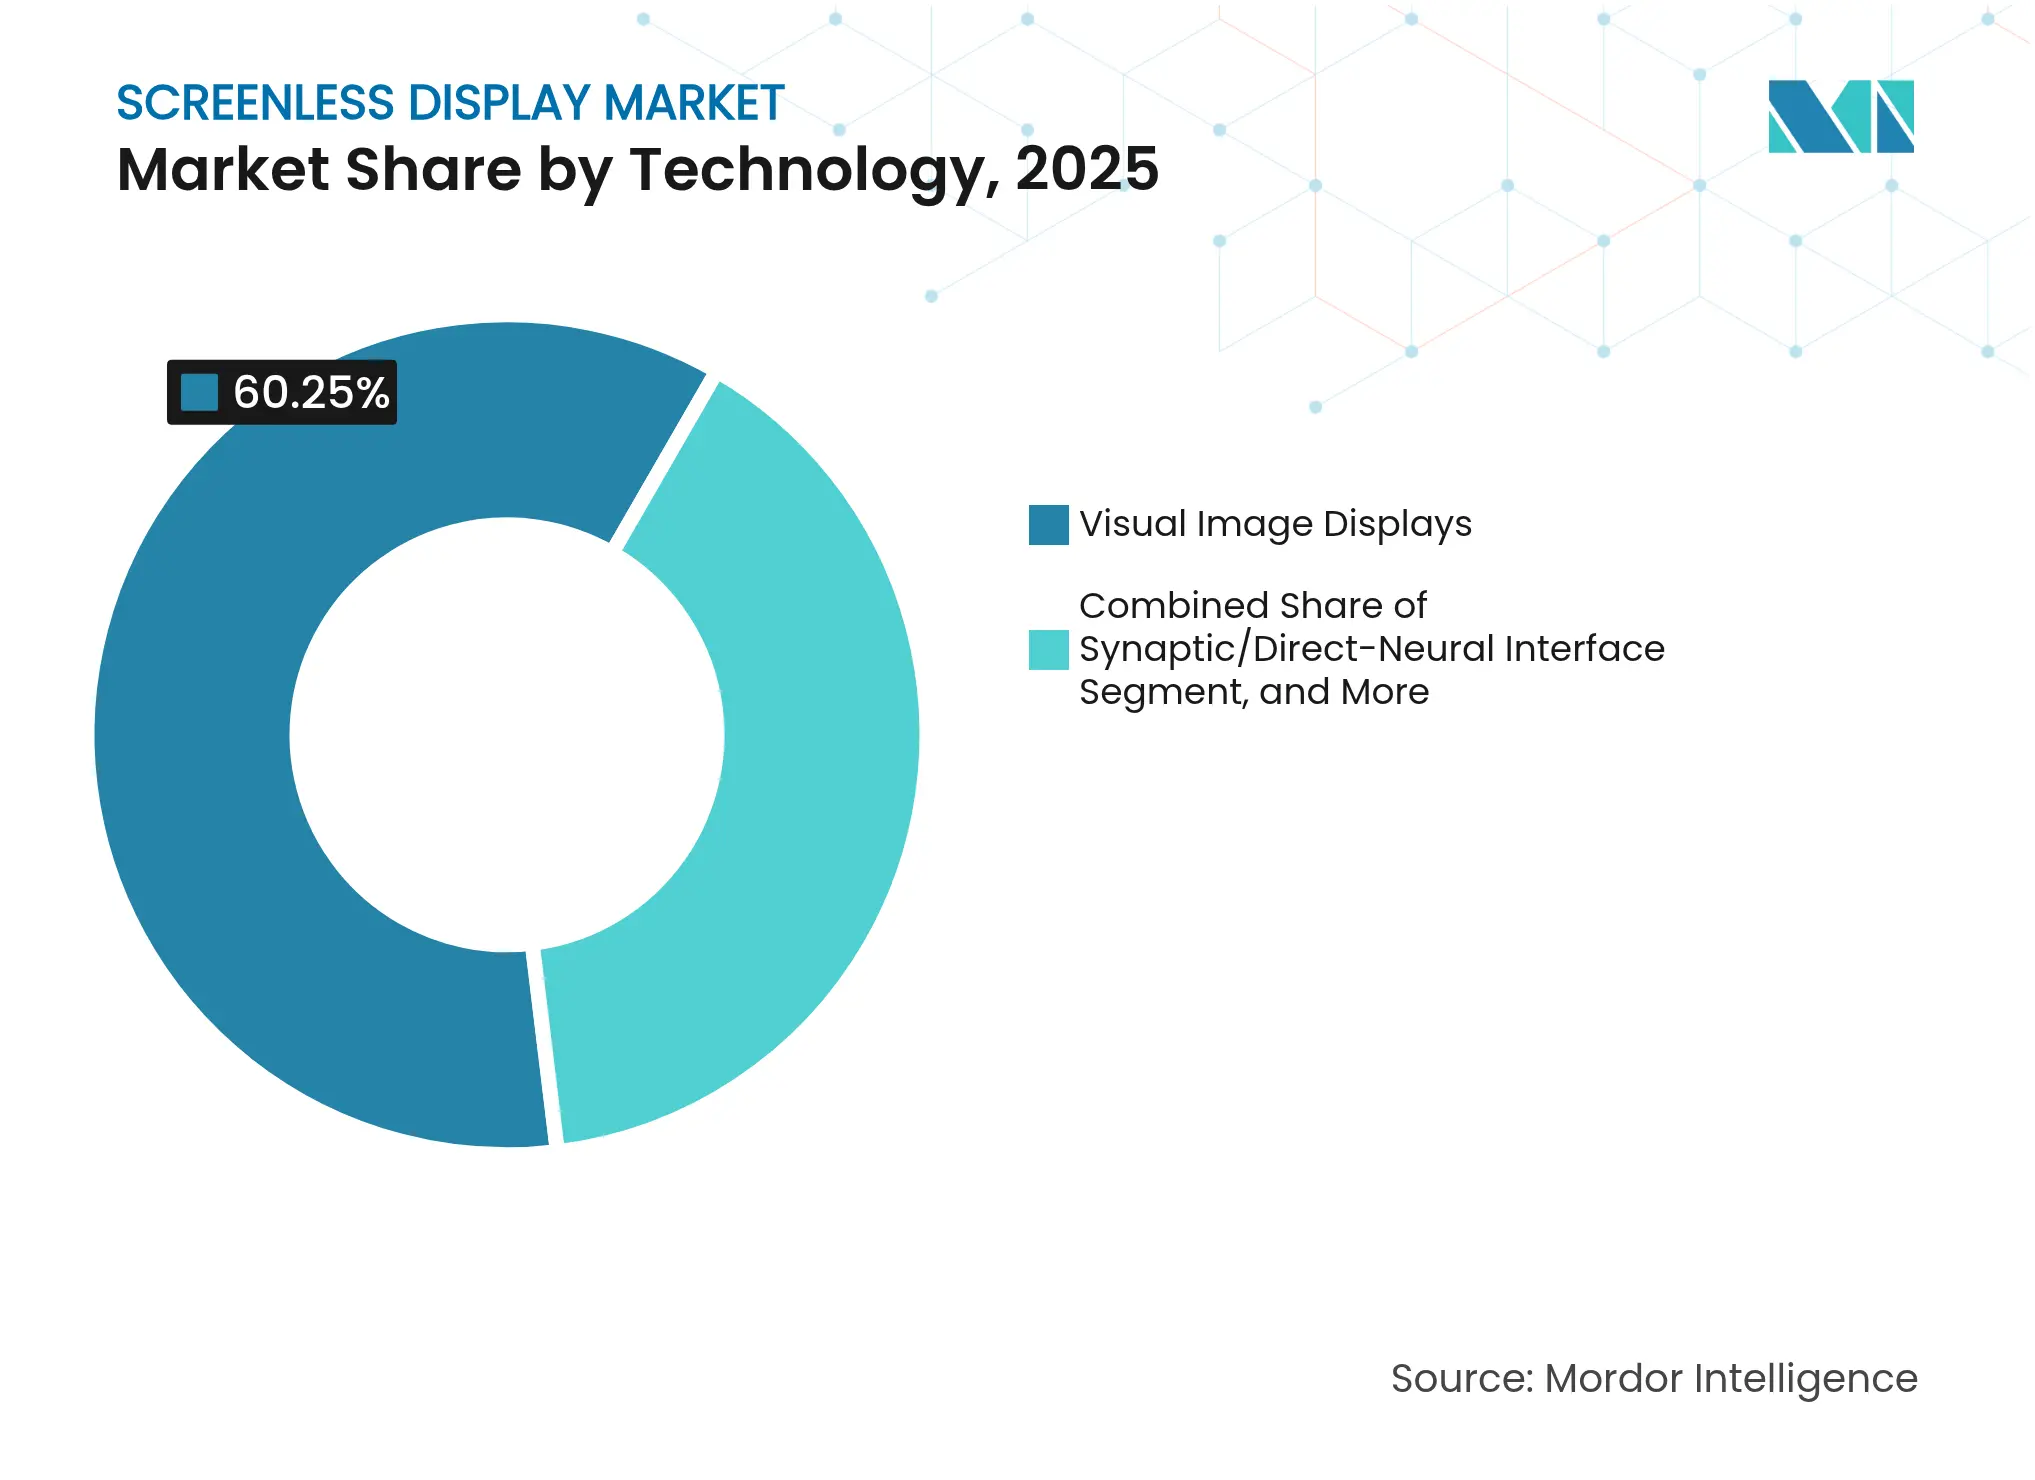
By Technology: Neural interfaces drive next-generation growth
Synaptic/direct-neural interfaces are projected to grow at a 18.9% CAGR through 2031, while visual image displays held 60.25% of the screenless display market in 2025. Neural systems benefit from military R&D spillovers and rising venture investment in cortical prosthetics. Visual image platforms maintain their dominance through cost-effective HUD architectures widely used in the automotive and aviation industries.
Complementary approaches, such as retinal laser projection, are used for patients who are unwilling or unable to undergo invasive neural surgery. Advances in nanoparticle photostimulation reduce surgical risk and may bridge the gap between non-invasive and implantable modalities today. As reimbursement codes for neuro-visual devices become more favorable, unit economics improve, further catalyzing momentum in the neural segment.
Note: Segment shares of all individual segments available upon report purchase
By Display Type: Implantables emerge as the high-growth category
Implantable and wearable micro-projectors will outpace all other form factors at a 19.85% CAGR to 2031 despite head-up displays’ 47.05% revenue lead in 2025. The head-up display segment captured 47.05% of screenless display market share in 2025 on the back of entrenched use in premium vehicles and fighter cockpits. The 256-pixel wireless subretinal implant validates that resolution adequate for letter recognition is now technically feasible, laying a path toward commodity-scale manufacturing later in the decade.
Head-mounted displays continue benefiting from the consumer VR cycle, yet app-ecosystem fatigue dampens unit sell-through. Quasicrystal metasurfaces under development for holographic kiosks expand advertising use cases but remain several cost-downs away from mass deployment. Over the forecast horizon, healthcare and defense procurement will shape demand for body-integrated solutions that offer hands-free situational data without external optics.
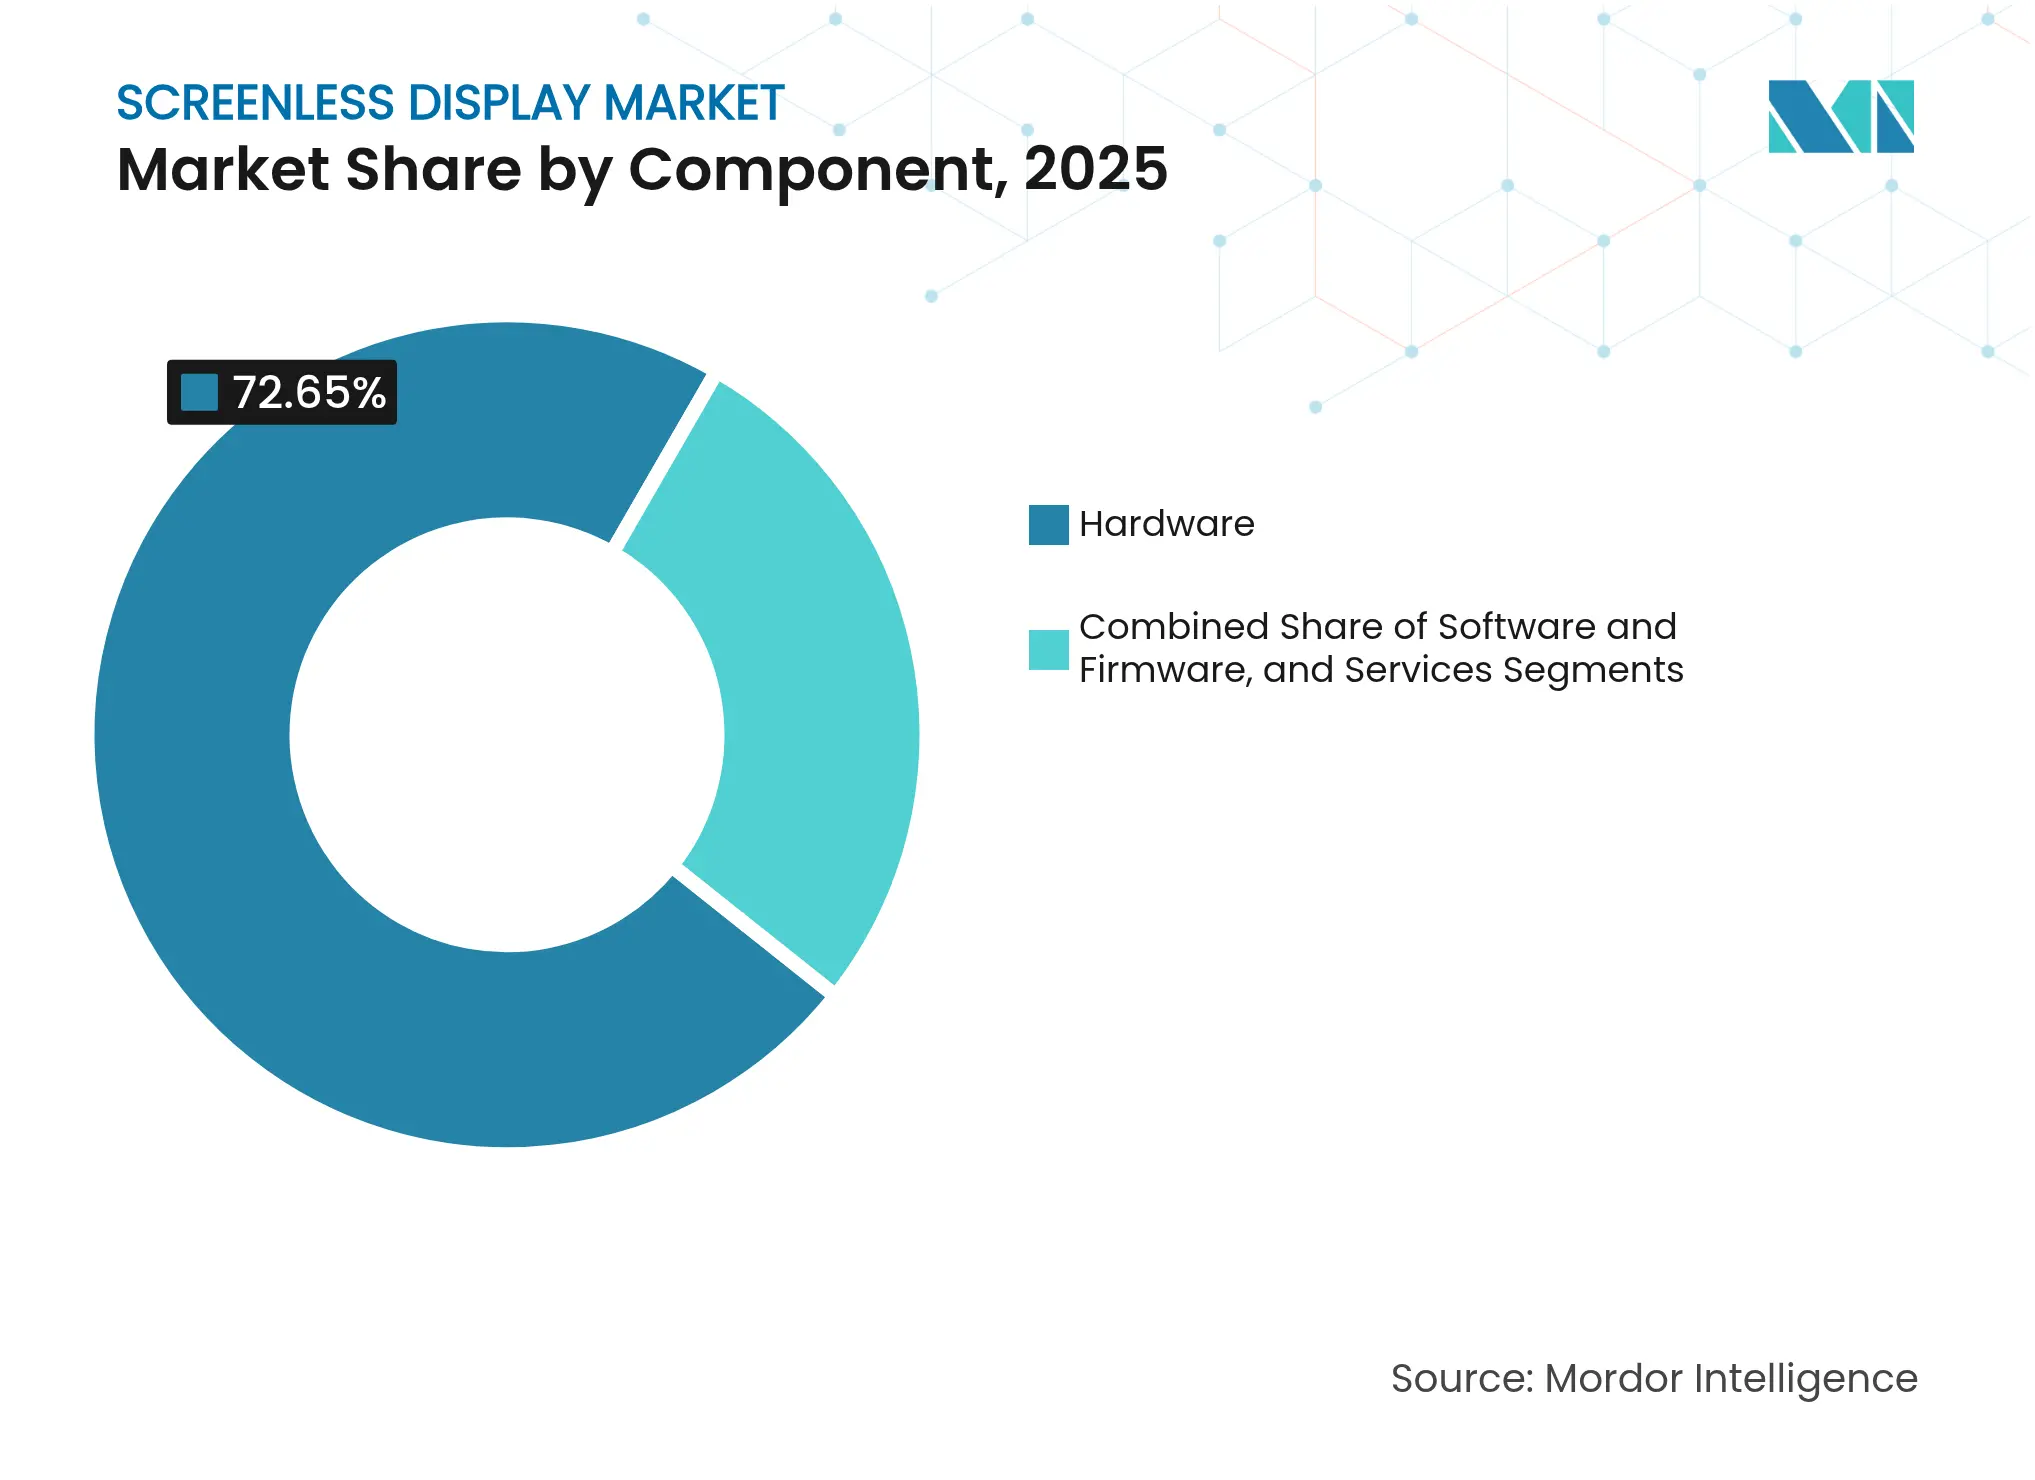
By Component: Services acceleration reflects integration complexity
Hardware commanded 72.65% of market revenue in 2025, yet services register the highest growth at 21.78% CAGR. System integrators are needed to align waveguides, optimize thermal envelopes, and tailor software stacks for each vehicle model or surgical workflow. The screenless display market size for services is projected to widen materially as OEMs outsource pilot builds to design houses that guarantee regulatory compliance.
Mini-LED and µLED light engines remain high-margin given their nanofabrication complexity, but commoditization pressure is evident as foundries scale six-inch GaN wafers. Software stacks increasingly embed AI algorithms that adjust brightness, color, and focal depth in real time, offsetting photonic-safety ceilings while extending battery life. Recurring firmware upgrades tied to cloud analytics further transition revenue toward subscription models.
Note: Segment shares of all individual segments available upon report purchase
By End-User Industry: Healthcare drives premium applications
Consumer electronics still held the largest slice at 37.85% in 2025, but healthcare and life sciences will post a 20.98% CAGR, moving into second place before 2031. Surgical-navigation and retinal-replacement indications command reimbursement premiums and tolerate higher component costs. The screenless display industry uses these profit pools to fund next-generation R&D.
Automotive adoption remains policy driven: Euro NCAP and China NCAP tie five-star safety ratings to AR driver-assistance cues, sustaining HUD volumes. Aerospace and defense procurements, exemplified by IVAS and F-35 helmet programs, lock-in multi-year buys that smooth supplier revenue. Industrial logistics undertakes proof-of-concept trials for waveguide-based pick-assistance; broad roll-outs hinge on further cost compression.
Asia-Pacific contributed 34.55% of 2025 revenue as Chinese OEMs raced to embed AR-HUDs in new-energy vehicles and Japanese optics firms supplied global integrators. Government grants funneled via China’s “Intelligent Connected Vehicle” roadmap subsidize early-stage suppliers, while Japan’s precision-glass makers refine high-index melts that feed the wider supply chain. South Korea’s display fabs invest in mirrorless windshield projection modules that shrink z-height and cost, positioning the peninsula as a future component hub.
North America sustains leadership in neural-interface IP and defense volume programs. The screenless display market size for military and security applications will swell once IVAS shifts from low-rate initial production to full-rate production post-2026. Silicon Valley continues to attract venture funds for multimodal XR platforms, and cross-border auto production in Mexico supports regional HUD assembly.
The Middle East grows at 18.82% CAGR, catalyzed by Vision 2030 diversification funds channeled into smart-city pilots. Gulf airlines explore holographic way-finding kiosks to improve airport throughput, and sovereign-wealth funds back local glass-fab start-ups aimed at challenging the Corning/Schott oligopoly. Europe maintains a cohesive regulatory stance that mandates ADAS integration, ensuring AR windshields gain traction first in German and French premium models before cascading to mid-tier vehicles.
Market Concentration
The screenless display market shows moderate fragmentation. Microsoft, Sony, and Apple leverage platform ecosystems, while specialists such as Magic Leap, Vuzix, and MicroVision compete on optics IP and ergonomics. Incumbents integrate vertically from light-engine fabrication to software stacks, giving them cost and certification advantages. Niche challengers differentiate through single-purpose optics, neural-sensing arrays, or thermal-management materials.
Component concentration is highest in waveguide glass, where Corning and Schott control melt recipes and annealing processes critical for high-FOV AR. New entrants pursue polymer and nanocomposite alternatives, but volume qualification remains three to five years away. Patent portfolios in reflective metasurfaces and holographic combiners form defensive moats; Vuzix alone holds more than 400 active patents, supporting OEM deals with aerospace and fitness brands.
Strategic moves underscore the race for scale: Kopin’s color micro-LED award secures defense qualification pathways; Corning’s Springboard plan earmarks capital for larger glass fabs; Google’s alliance with Magic Leap reunites platform and optics expertise, reviving consumer-grade AR prospects. Private capital gravitates toward middleware firms that harmonize multimodal inputs-voice, gesture, eye-tracking-into unified user interfaces essential for mass adoption.

*Disclaimer: Major Players sorted in no particular order
1. INTRODUCTION
2. RESEARCH METHODOLOGY
3. EXECUTIVE SUMMARY
4. MARKET LANDSCAPE
5. MARKET SIZE AND GROWTH FORECASTS (VALUES)
6. COMPETITIVE LANDSCAPE
7. MARKET OPPORTUNITIES AND FUTURE OUTLOOK
The visual image is a type of screenless display that recognizes any image or thing with the help of the human eye. The following are a few examples of the visual image display: holographic display, virtual reality goggles, heads-up displays, etc. Retina display, instead of using some intermediate object for light reflection to project the images, directly projects the image onto the retina. The synaptic interface means sending information directly to the human brain without using any light. This technology is already tested on humans, and most of the companies started using this technology for effective communication, education, business, and security systems. In the report scope, the existing technology provider landscape also covered, which consists of major players operating in the market.
Pricing Strategy for Semiconductor Components
3 Min Read
Accelerating Additive Manufacturing Adoption in India
3 Min Read
Wealth Management Intelligence for the Middle East
4 Min Read
When decisions matter, industry leaders turn to our analysts. Let’s talk.