4K Display Resolution Market Size and Share
Market Overview
| Study Period | 2020 - 2031 |
|---|---|
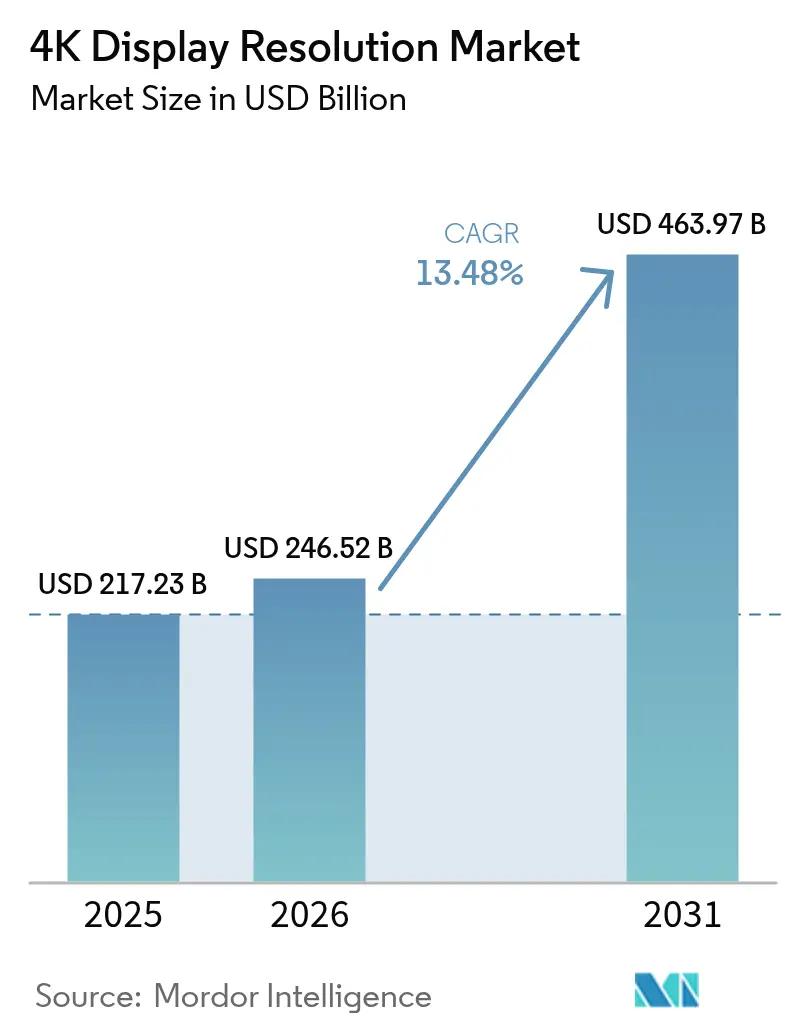
| Market Size (2026) | USD 246.52 Billion |
| Market Size (2031) | USD 463.97 Billion |
| Growth Rate (2026 - 2031) | 13.48% CAGR |
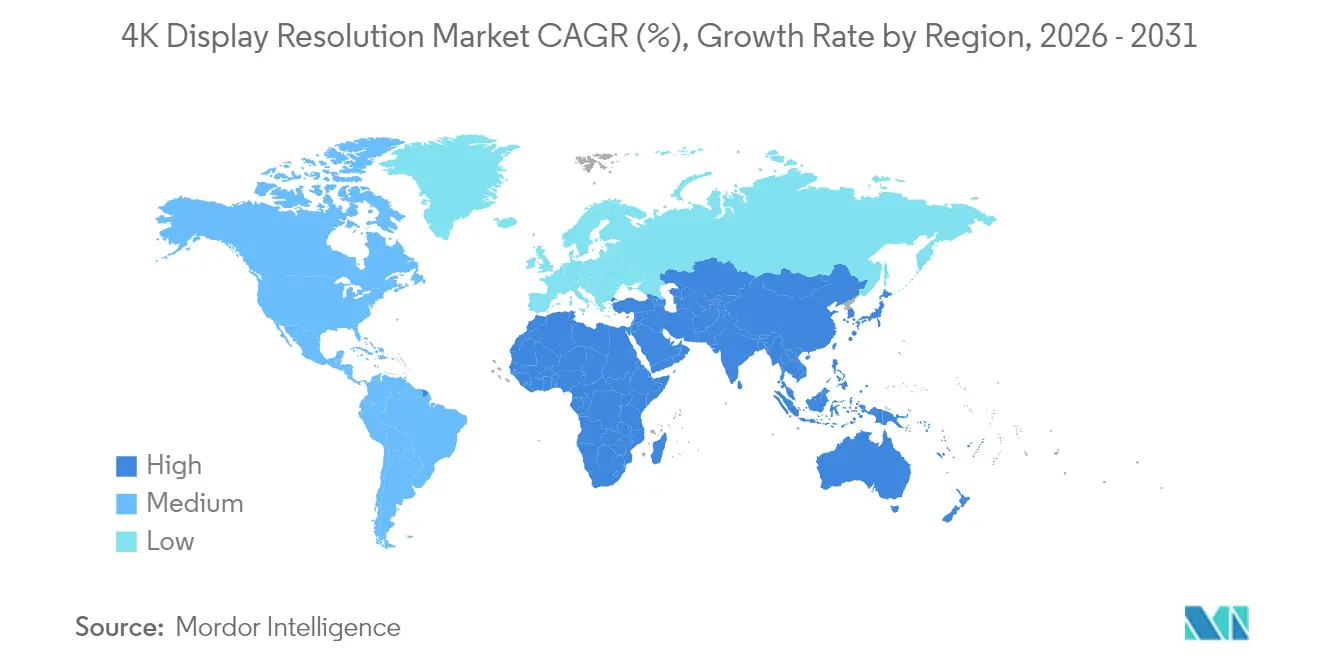
| Fastest Growing Market | Middle East |
| Largest Market | Asia Pacific |
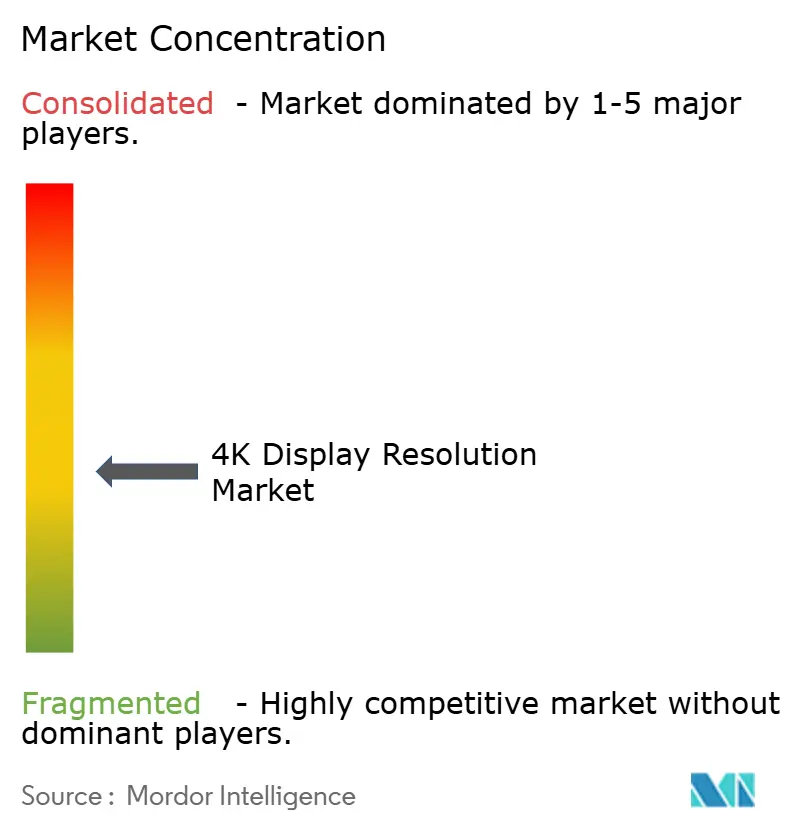
| Market Concentration | Medium |
Major Players *Disclaimer: Major Players sorted in no particular order Image © Mordor Intelligence. Reuse requires attribution under CC BY 4.0. | |
4K Display Resolution Market Analysis by Mordor Intelligence
The 4K display resolution market size was valued at USD 217.23 billion in 2025 and estimated to grow from USD 246.52 billion in 2026 to reach USD 463.97 billion by 2031, at a CAGR of 13.48% during the forecast period (2026-2031). Fast-declining panel costs, a richer supply of native 4K streaming content, and expanding corporate use cases are allowing the technology to move from premium positioning into mass adoption. Asia Pacific’s manufacturing scale keeps average selling prices low while the region’s consumers display a marked preference for larger screens. Hybrid-work demand and immersive gaming are further tightening refresh cycles, encouraging brands to launch increasingly specialized models. At the same time, supply chain risks around chipsets and evolving energy-efficiency rules in Europe urge vendors to diversify component sourcing and accelerate R&D in low-power backlighting.
Key Report Takeaways
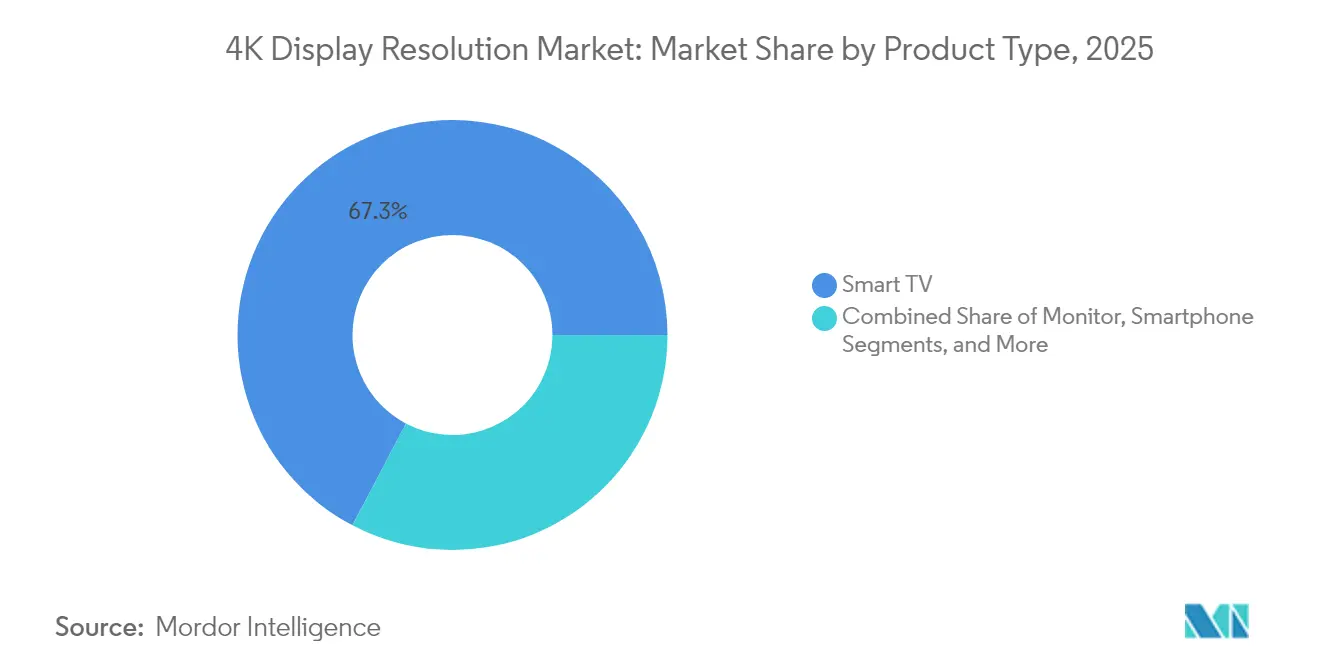
- By product category, smart TVs led with 67.30% revenue share in 2025; gaming monitors are projected to expand at a 13.84% CAGR through 2031.
- By panel technology, LCD held 70.40% of the 4K display resolution market share in 2025, whereas OLED is forecast to advance at a 16.25% CAGR to 2031.
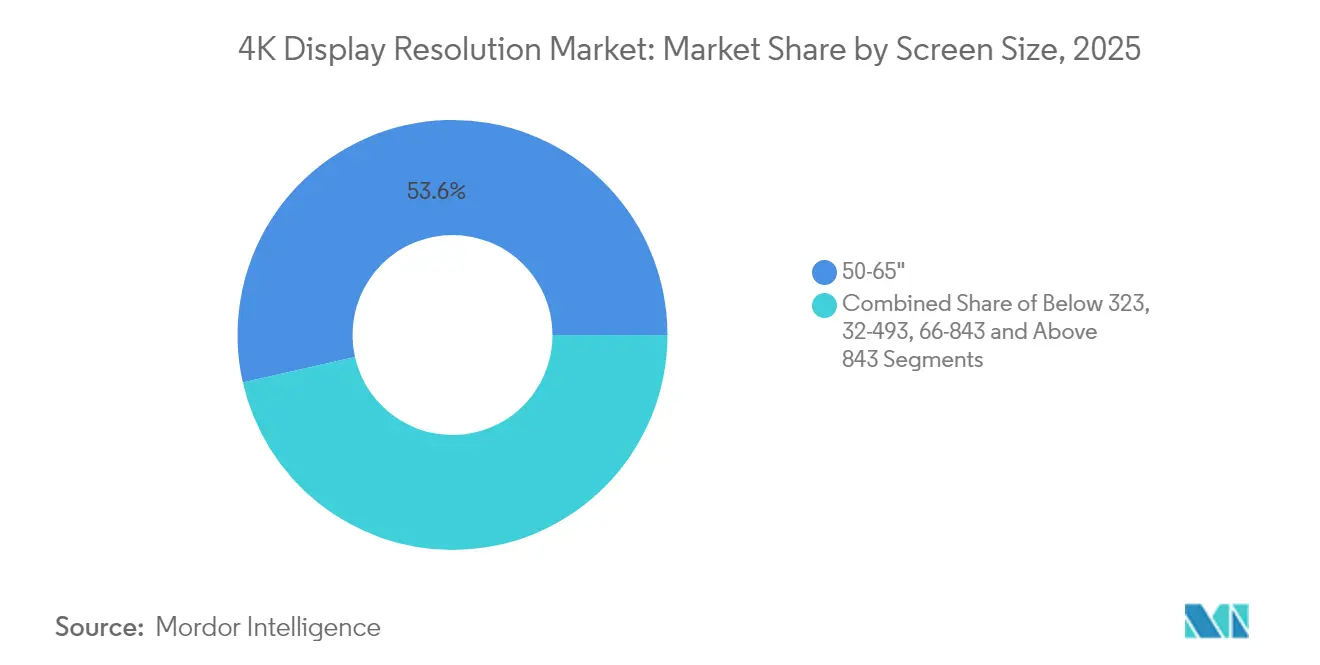
- By screen size, the 50–65″ bracket accounted for 53.55% of the 4K display resolution market size in 2025; displays above 65″ are expected to grow at 15.35% CAGR between 2026 and 2031.
- By end-user vertical, consumer electronics held 75.25% share of the 4K display resolution market size in 2025, while healthcare displays are set to rise at 13.05% CAGR over the same period.
- By geography, Asia Pacific captured 45.60% revenue share in 2025; the Middle East is predicted to record the fastest regional CAGR at 13.62% through 2031.
Note: Market size and forecast figures in this report are generated using Mordor Intelligence’s proprietary estimation framework, updated with the latest available data and insights as of 2026.
Global 4K Display Resolution Market Trends and Insights
Drivers Impact Analysis*
| Driver | (~) % Impact on CAGR Forecast | Geographic Relevance | Impact Timeline |
|---|---|---|---|
| Rapid OTT-led uptake of 4K streaming | +3.2% | North America, Europe | Medium term (2-4 years) |
| Panel subsidies and capacity expansion | +2.8% | Asia Pacific, Global supply chain | Short term (≤ 2 years) |
| Esports demand for 4K/144 Hz gaming monitors | +1.7% | Europe, North America, East Asia | Medium term (2-4 years) |
| Adoption of 4K surgical and diagnostic displays | +1.5% | North America, Japan, Western Europe | Long term (≥ 4 years) |
| Hybrid-work LED videowalls in GCC | +1.2% | Middle East, GCC countries | Medium term (2-4 years) |
| Mini-LED yield-driven price erosion | +1.9% | Global, initial impact in Asia Pacific | Short term (≤ 2 years) |
| Source: Mordor Intelligence | |||
Rapid OTT-led Uptake of 4K Streaming in North America
Streaming platforms delivered more than 60% of their new content in 4K during 2024, setting a stronger pull for compatible screens in household upgrades. Bandwidth gains from Wi-Fi 7, which supports data rates up to 46 Gbit/s, remove the previous bottlenecks that limited mainstream 4K adoption. Millimeter-wave rollouts, with Japan targeting 50,000 base stations by 2027, add further capacity that benefits cross-border content providers. The result is a steeper replacement cycle for television sets and monitors, with streaming services shaping feature roadmaps around HDR performance and wider color gamuts. Brands that synchronize panel launches with blockbuster content premieres are capturing early-adopter interest ahead of key sales quarters.
Panel Subsidies and Capacity Expansion in China and South Korea
Government incentives trimmed capital costs for new LCD and QD-OLED lines, enabling firms such as BOE Technology and Samsung Display to run plants at high utilization. Samsung Display plans to raise QD-OLED monitor panel shipments by 50% to 1.43 million units in 2025, giving OEM partners more scope to refresh premium catalogs. Economies of scale flowing from these investments support competitive pricing in the 50-65″ mainstream sweet spot, while yield-driven cost erosion in Mini-LED backlights widens adoption in mid-tier models. The subsidy-induced volume surge is already filtering through global supply chains, lowering bill-of-materials outlays for downstream assemblers.
Esports Demand for 4K/144 Hz Gaming Monitors in Europe
Professional esports leagues specified 4K/144 Hz displays as the baseline for tournament stages in 2024, creating a halo effect for consumer models. Samsung retained a 21.0% share in the global gaming monitor market and announced the Odyssey OLED G6 with a 500 Hz refresh rate for a late 2025 release.[1]Samsung Electronics, “Samsung Electronics Ranked No. 1 in Global Gaming Monitor Market for Six Consecutive Years,” news.samsung.com MSI’s CES-honored MPG 272URX QD-OLED display, the first 27″ 4K 240 Hz unit with DP 2.1, underscores the rapid spec evolution. Brand differentiation now centers on higher peak brightness, tandem OLED stacks, and advanced cooling to mitigate burn-in, allowing vendors to command premium ASPs in Europe’s enthusiast segment.
Adoption of 4K Surgical and Diagnostic Displays in U.S. and Japan
Operating rooms embraced 4K screens for endoscopy and microscopic surgery, leveraging their four-fold pixel density over Full HD to reveal finer anatomical structures. Sony’s LMD-32M1MD Mini-LED monitor, with over 1,850 cd/m² peak brightness and VESA HDR1000 certification, illustrates the required luminance ceiling for glare-prone theaters.[2]Sony, “Introducing the LMD-32M1MD: Sony’s Advanced 4K Mini-LED Medical Monitor,” pro.sony U.S. and Japanese regulatory frameworks favor devices that meet DICOM grayscale accuracy, spurring OEMs to invest in factory calibration workflows. Hospital procurement cycles are longer than consumer refresh rates, yet margins remain protective, shielding suppliers from price attrition in mainstream TV categories.
Restraints Impact Analysis*
| Restraint | (~) % Impact on CAGR Forecast | Geographic Relevance | Impact Timeline |
|---|---|---|---|
| HDMI 2.1 chipset shortages 2024-25 | -1.4% | Global, higher in North America and Europe | Short term (≤ 2 years) |
| EU Eco-design rules for >65″ TVs | -0.9% | European Union, spillover to global manufacturing | Medium term (2-4 years) |
| Limited 4K broadcast spectrum in Africa | -0.4% | Sub-Saharan Africa | Long term (≥ 4 years) |
| Premium 8K cannibalization in East Asia | -0.7% | Japan, South Korea, high-income urban centers | Medium term (2-4 years) |
| Source: Mordor Intelligence | |||
HDMI 2.1 Chipset Shortages 2024-25
Constrained wafer starts at leading foundries have a limited supply of HDMI 2.1 retimer and switch ICs, delaying volume shipments of flagship gaming monitors and high-end TVs. Himax Technologies reported that 82.9% of 2024 revenue came from display driver ICs, underscoring dependence on a narrow component pool.[3]Himax Technologies, “Himax Technologies, Inc. Form 20-F FY 2024,” sec.gov Vendors redirected scarce chipsets to models with higher gross margins, creating temporary stockouts in mid-tier SKUs. The scarcity also accelerated DisplayPort 2.1 adoption, as seen in MSI’s new QD-OLED monitor, signaling possible long-term interface diversification even after supply normalizes.
EU Eco-design Rules Raising Compliance Costs for >65″ TVs
The European Commission’s public consultation on improving energy labels and reparability for electronic displays signals tighter rules beyond 2025. Larger panels face steeper efficiency thresholds, pushing brands to add Mini-LED dimming zones or switch to more efficient OLED matrices. Engineering changes, certification fees, and redesign of retail packaging inflate total landed costs, driving some manufacturers to favor sub-65″ models for Europe. These regulatory headwinds may reallocate R&D budgets toward low-power backlighting and recyclable chassis materials.
*Our forecasts treat driver/restraint impacts as directional, not additive. The impact forecasts reflect baseline growth, mix effects, and variable interactions.
Segment Analysis
By Product Type: Gaming Monitors Redefine Performance Standards
Gaming monitors accounted for a 13.84% CAGR forecast between 2026 and 2031, the fastest trajectory within the 4K display resolution market. Samsung upheld a 21.0% global share in 2024, while its 34.6% slice of the OLED sub-segment confirmed a first-mover advantage in emerging QD-OLED stacks. The segment thrives on esports sponsorship visibility, frequent model refreshes, and the synergy with powerful GPUs such as NVIDIA GeForce RTX 4090 that unlocked stable 4K/144 Hz gameplay. Monitor brands elevate specifications with higher peak brightness, tandem OLED layers, and DisplayPort 2.1 input to differentiate premium SKUs. Profitability remains thicker than mainstream TVs because enthusiast buyers value response time, HDR contrast, and color coverage.
Smart TVs preserved leadership with a 67.30% revenue share in 2025, supported by wide 4K streaming content libraries and falling BOM costs. Corporate video walls and digital signage screens gained importance as hybrid-work hubs required wide viewing angles and high pixel density. Medical displays formed a high-margin niche, with 4K surgical monitors like Sony’s LMD-32M1MD achieving VESA HDR1000 compliance for operating theaters. Smartphones and tablets with native 4K remain limited to creator-focused uses because energy draw offsets mobile benefits. Overall, consumer appetite for richer entertainment and workplace collaboration sustains multi-segment momentum within the 4K display resolution market.


By Panel Technology: OLED Challenges LCD Dominance
OLED panels are projected to expand at a 16.25% CAGR, the swiftest run in the 4K display resolution market. Samsung Display’s plan to ship 1.43 million QD-OLED monitor panels in 2025 exemplifies the capacity scaling that propels wider use beyond flagship TVs. Superior contrast, pixel-level dimming, and the introduction of tandem OLED stacks now reach gaming monitors, encouraging ASP premiums. LG’s 2025 G5 TV, with a 165 Hz native refresh and Micro Lens Array optics, underscores the continued pace of OLED R&D.
LCD technology retained 70.40% share in 2025 because of vast installed tooling, mature supply chains, and cost competitiveness for mid-range sets. Mini-LED backlighting adds local dimming and higher luminance, bridging performance gaps with OLED at a lower cost. Sony’s HDR1000-rated surgical monitor demonstrates Mini-LED influence in specialty verticals. Micro-LED remains confined to ultra-large formats, evidenced by Hisense’s 136-inch showpiece, until manufacturing yields improve. The coexistence of multiple panel types ensures that each application - gaming, signage, healthcare - receives an optimal balance of cost, brightness, and longevity within the expanding 4K display resolution market.
By Screen Size: Larger Displays Capture Premium Market
The above-65″ class is forecast to climb at 15.35% CAGR, the fastest pace in the 4K display resolution market. Cheaper large panels and immersive home-cinema demand catalyzed the release of TCL’s 100-inch P715 quantum dot TV for Asia Pacific households. Brand portfolios give priority to slimmer bezels and high dynamic range to justify premium tickets despite energy-efficiency hurdles in Europe.
The 50–65″ bracket, responsible for 53.55% of revenue in 2025, remains the universal sweet spot where living-room space, price, and 4K pixel density align. Yield gains in Taiwan’s Mini-LED lines trimmed BOM costs, helping this size hold center ground in the 4K display resolution market. Sets below 49″ serve desktop, hospitality, and secondary-room placements, while ultra-large 66-84″ screens penetrate boardrooms and education halls where group visibility ranks high. Regional taste diverges, with North America favoring bigger footprints than Europe or East Asia, compelling brands to customize model mixes by channel.
By End-user Vertical: Healthcare Applications Drive Innovation
The healthcare segment is on track for 13.05% CAGR through 2031, outpacing every other vertical in the 4K display resolution market. Surgical suites adopted 4K monitors for minimally invasive procedures that rely on razor-sharp imagery. Sony’s workflow solutions combine 4K acquisition, recording, and routing to support integrated operating rooms. Winmate’s M320TF-SDI display adds 12G-SDI connectivity for latency-free transfers, addressing stringent hospital standards.
Consumer electronics still delivered 75.25% of 2025 revenue thanks to smart TVs and console gaming. Esports arenas and gaming cafés specify high-refresh 4K screens that double as event showcases. Corporate and education users pursue pixel-dense collaboration boards for hybrid meetings, while retail signage exploits 4K clarity to overcome glare in bright venues. Aerospace and defense remain specialized niches, demanding ruggedized 4K panels that withstand vibration and extreme temperatures. Each vertical’s nuanced requirements deepen product segmentation inside the broader 4K display resolution market.
Geography Analysis
Asia Pacific generated 45.60% of 2025 revenue, cementing its position as the largest territory in the 4K display resolution market. China’s subsidies enabled swift capacity ramps, while South Korea’s OLED leadership supplied high-margin panels globally. Japan’s goal of installing 50,000 millimeter-wave bases by 2027 reinforces the regional network backbone supporting 4K streaming uptake. India and Southeast Asia entered a new adoption phase as falling ASPs aligned with rising discretionary income, unlocking large untapped volumes.
The Middle East is forecast to post the highest CAGR at 13.62% between 2026 and 2031. GCC corporations rolled out 4K video walls to enhance hybrid collaboration, boosting demand for fine-pixel-pitch LED assemblies. Sony Middle East and Africa reported notable sales gains and aims to release the INZONE M9 4K monitor within 2025, reflecting the region’s appetite for premium displays. Online channels have already captured 20% of regional TV sales, prompting brands to fine-tune e-commerce logistics.
North America’s mature installed base still grew on the back of fast OTT content adoption and a robust gaming monitor upgrade cycle. Healthcare institutions expanded to 4K diagnostic suites, widening a lucrative sub-segment less exposed to price wars. Europe faced a dual narrative: tech-savvy consumers embraced larger OLED sets while stricter Eco-design norms raised compliance costs for panels over 65″, nudging suppliers toward energy-efficient Mini-LED designs. Latin America and Africa remained emergent frontiers; limited 4K broadcast spectrum in parts of Sub-Saharan Africa tempered growth, though rising broadband coverage signals future upside.

Competitive Landscape
The 4K display resolution market is moderately consolidated, dominated by vertically integrated panel makers that leverage scale for cost leadership and R&D heft. Samsung Electronics, LG Display, and BOE Technology retained pole positions by combining in-house semiconductor, panel, and final assembly capabilities. Samsung’s 21.0% stake in global gaming monitors and 34.6% share of OLED monitors highlight its grip on fast-growing niches. LG pursued Micro Lens Array optics to raise OLED brightness, protecting its premium TV franchise.
Component specialists such as Valens Semiconductor see a serviceable available market topping USD 9 billion by 2026 for high-speed connectivity chips, illustrating how ecosystem players profit from bandwidth-hungry content pipelines.[7]Valens Semiconductor, “Form F-1,” sec.gov SHENZHEN ANWELL INDUSTRY collaborates with tier-one brands on LED walls, filling application gaps outside mainstream consumer displays. In medical imaging, firms like Sony and Winmate differentiate through regulatory certifications and localized after-sales networks, capturing resilient margins.
Strategic moves increasingly revolve around panel innovations - tandem OLED stacks, higher frame-rate controllers, and power-saving backlights - rather than pure price cuts. Partnerships across software, mounting hardware, and cloud services add recurring revenue streams and create sticky customer relationships. As supply chains diversify to mitigate chipset shortages, competitors with strong supplier contracts are poised to retain share, while late adopters risk margin compression.
4K Display Resolution Industry Leaders
Sony Corporation
LG Display Co. Ltd
Samsung Electronics Co. Ltd
Toshiba Corporation
Sharp Corporation
- *Disclaimer: Major Players sorted in no particular order

Recent Industry Developments
- April 2025: Samsung Electronics confirmed a 21.0% 2024 gaming-monitor share and revealed the 27″ Odyssey OLED G6 with a 500 Hz refresh rate, shipping in H2 2025.
- March 2025: Sony introduced the LMD-32M1MD 4K Mini-LED surgical monitor, the first to hold VESA HDR1000 certification, underscoring medical-display focus.
- March 2025: Densitron noted surging 4K demand in medical endoscopy, radiology, and robotics, steering its product roadmap toward high-luminance panels.
- January 2025: MSI debuted the MPG 272URX, the world’s first DP 2.1 27″ 4K 240 Hz QD-OLED gaming monitor, earning a CES Innovation Award.


Global 4K Display Resolution Market Report Scope
4K resolution display gives the sharpest picture quality. The display is almost four times as many pixels as high definition display. The study is restricted to 4K display panels used in various products, like monitors, smart TVs, and smartphones. Finished/final products, such as 4K UHD and 4K OLED TVs, are not considered.
The 4K display resolution market is segmented by Product (monitor, smart TV, and smartphone), vertical (aerospace and defense, business and education, and entertainment and media), and geography. The market sizes and forecasts are provided in terms of value (in USD billion) for all the above segments.
| Smart TV |
| Monitor |
| Smartphone |
| Tablet |
| Laptop |
| Digital Signage/Videowall |
| Projection Screen |
| Head-Mounted Display (HMD) |
| Medical Display |
| Others |
| LCD (IPS/VA/TN) |
| OLED |
| Mini-LED |
| Micro-LED |
| Others |
| Below 32 inch |
| 32-49 inch |
| 50-65 inch |
| 66-84 inch |
| Above 84 inch |
| Consumer Electronics (Household) |
| Gaming and Esports Venues |
| Business and Education |
| Retail and Advertisement |
| Media and Entertainment Production |
| Healthcare |
| Aerospace and Defence |
| Others |
| North America | United States |
| Canada | |
| Mexico | |
| Europe | Germany |
| United Kingdom | |
| France | |
| Italy | |
| Spain | |
| Nordics (Denmark, Sweden, Norway, Finland) | |
| Rest of Europe | |
| Asia-Pacific | China |
| Japan | |
| South Korea | |
| India | |
| Southeast Asia | |
| Australia | |
| Rest of Asia-Pacific | |
| South America | Brazil |
| Argentina | |
| Rest of South America | |
| Middle East | Gulf Cooperation Council Countries |
| Turkey | |
| Rest of Middle East | |
| Africa | South Africa |
| Nigeria | |
| Rest of Africa |
| By Product Type | Smart TV | |
| Monitor | ||
| Smartphone | ||
| Tablet | ||
| Laptop | ||
| Digital Signage/Videowall | ||
| Projection Screen | ||
| Head-Mounted Display (HMD) | ||
| Medical Display | ||
| Others | ||
| By Panel Technology | LCD (IPS/VA/TN) | |
| OLED | ||
| Mini-LED | ||
| Micro-LED | ||
| Others | ||
| By Screen Size | Below 32 inch | |
| 32-49 inch | ||
| 50-65 inch | ||
| 66-84 inch | ||
| Above 84 inch | ||
| By End-user Vertical | Consumer Electronics (Household) | |
| Gaming and Esports Venues | ||
| Business and Education | ||
| Retail and Advertisement | ||
| Media and Entertainment Production | ||
| Healthcare | ||
| Aerospace and Defence | ||
| Others | ||
| Geography | North America | United States |
| Canada | ||
| Mexico | ||
| Europe | Germany | |
| United Kingdom | ||
| France | ||
| Italy | ||
| Spain | ||
| Nordics (Denmark, Sweden, Norway, Finland) | ||
| Rest of Europe | ||
| Asia-Pacific | China | |
| Japan | ||
| South Korea | ||
| India | ||
| Southeast Asia | ||
| Australia | ||
| Rest of Asia-Pacific | ||
| South America | Brazil | |
| Argentina | ||
| Rest of South America | ||
| Middle East | Gulf Cooperation Council Countries | |
| Turkey | ||
| Rest of Middle East | ||
| Africa | South Africa | |
| Nigeria | ||
| Rest of Africa | ||


Key Questions Answered in the Report
What is the current size of the 4K display resolution market?
The market stood at USD 246.52 billion in 2026 and is forecast to rise to USD 463.97 billion by 2031.
Which segment is expanding the fastest within the 4K display resolution market?
Gaming monitors are projected to grow at a 13.84% CAGR from 2026 to 2031, driven by esports standardization of 4K/144 Hz specifications
Why are OLED panels gaining share against LCD in 4K displays?
OLED offers pixel-level dimming, superior contrast, and higher refresh scalability, and production capacity is increasing, supporting a 16.25% CAGR through 2031.
How do EU Eco-design rules affect large 4K televisions?
Upcoming efficiency standards raise compliance costs for sets over 65″, prompting manufacturers to adopt Mini-LED or power-optimized OLED architectures for the European market.
Page last updated on:


