Virtual Retinal Display Market Size and Share
Market Overview
| Study Period | 2020 - 2031 |
|---|---|
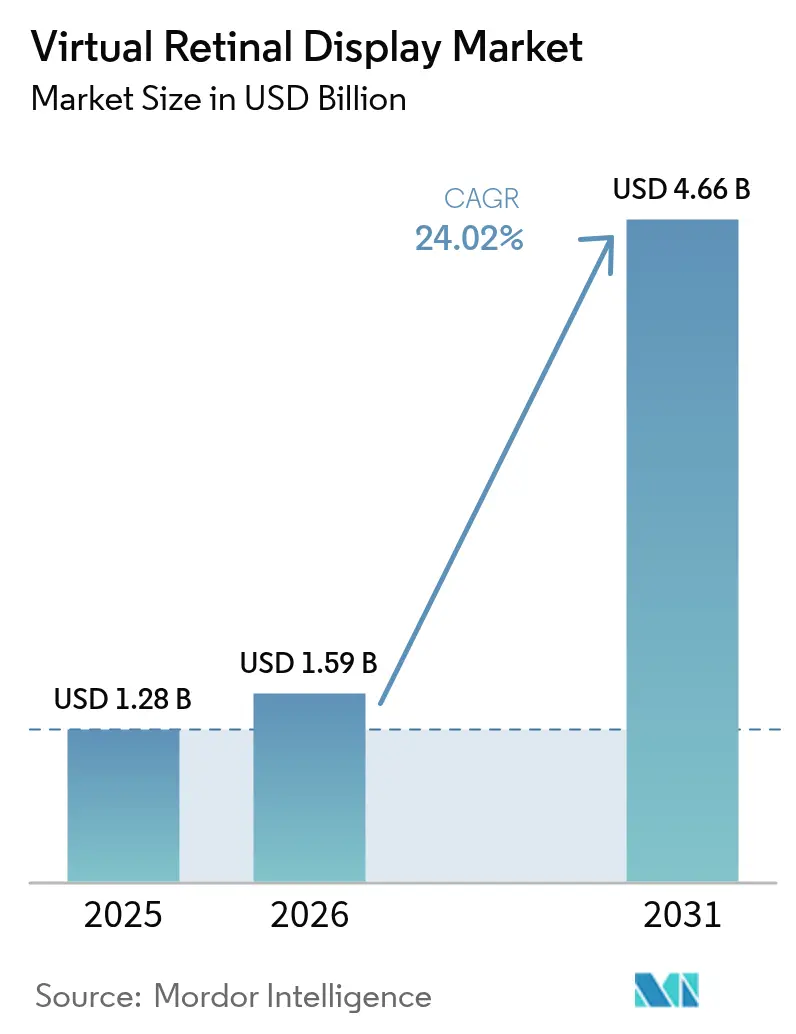
| Market Size (2026) | USD 1.59 Billion |
| Market Size (2031) | USD 4.66 Billion |
| Growth Rate (2026 - 2031) | 24.02% CAGR |
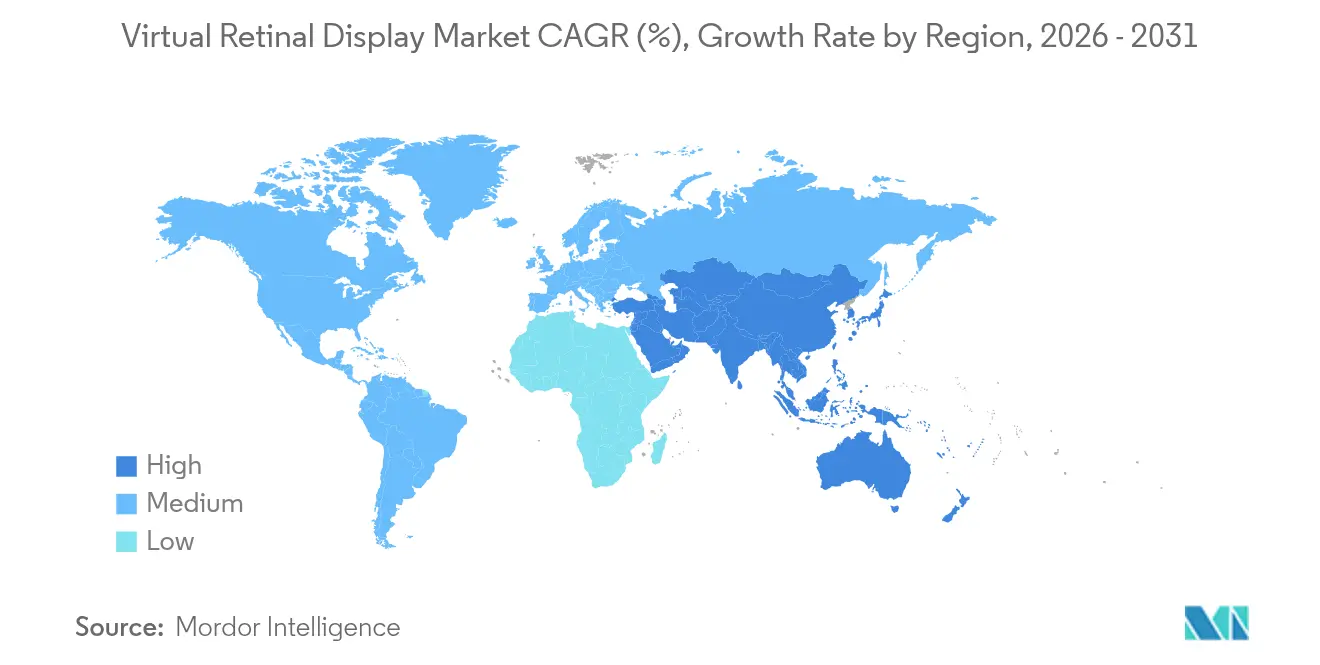
| Fastest Growing Market | Asia Pacific |
| Largest Market | Asia |
| Market Concentration | Medium |
Major Players *Disclaimer: Major Players sorted in no particular order Image © Mordor Intelligence. Reuse requires attribution under CC BY 4.0. | |
Virtual Retinal Display Market Analysis by Mordor Intelligence
The virtual retinal display market size is expected to grow from USD 1.28 billion in 2025 to USD 1.59 billion in 2026 and is forecast to reach USD 4.66 billion by 2031 at 24.02% CAGR over 2026-2031. Light-weight retinal projection is moving from experimental labs to mainstream production because silicon-photonics costs are declining, military orders are accelerating, and healthcare providers in developed economies are digitizing vision-care workflows. Transitioning from screen-based to screen-less augmented-reality architecture removes viewing-angle and ambient-light limits while enabling glasses-grade form factors. Procurement programs such as the U.S. Army’s soldier color MicroLED initiative and Japan’s aged-care vision rehabilitation funding are pulling demand forward. Meanwhile, component makers are shrinking controllers, lasers, and waveguides, which lowers power budgets and opens consumer electronics channels.
Key Report Takeaways
- By component, Display Light Source led with 33.92% of virtual retinal display market share in 2025, while Eye-Tracking & Calibration Modules are advancing at a 26.17% CAGR through 2031.
- By product type, AR Smart Glasses held 40.35% of virtual retinal display market share in 2025; Implantable/Low-Vision Aids are forecast to grow 26.45% CAGR to 2031.
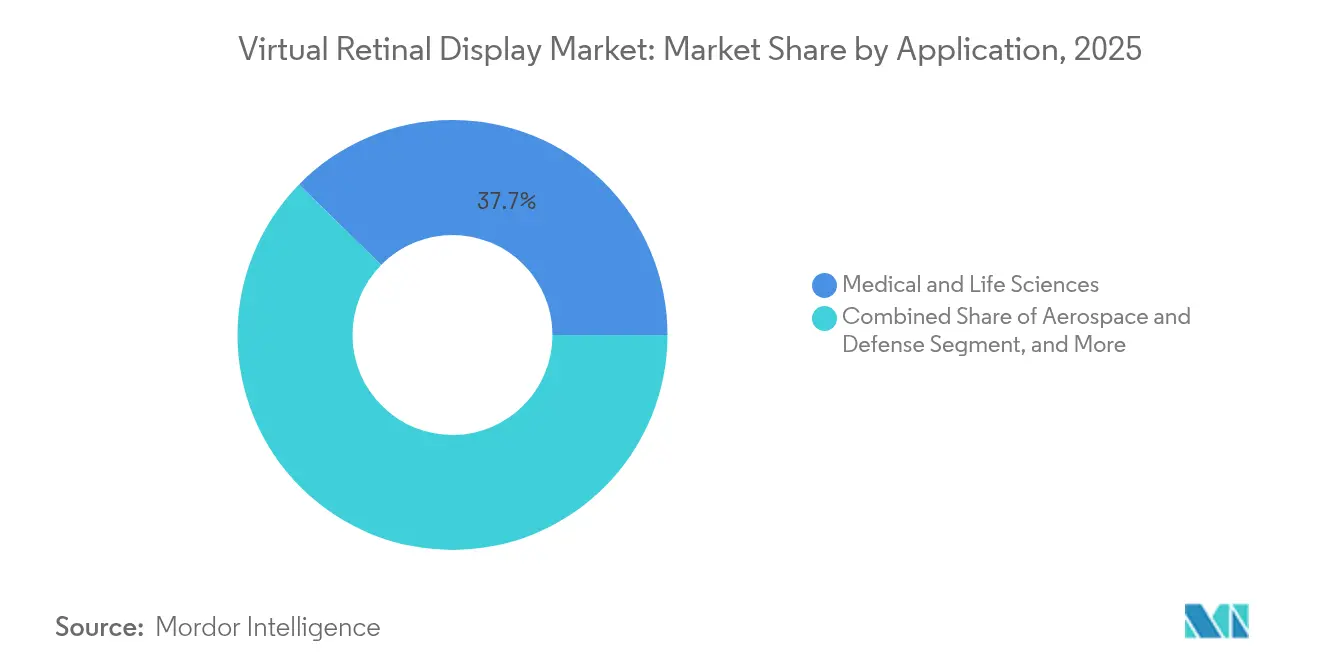
- By application, Medical & Life Sciences commanded a 37.65% share of the virtual retinal display market size in 2025; Consumer Electronics & Gaming is growing at 24.84% CAGR to 2031.
- By resolution, Full HD led with 29.12% share in 2025, while Above 4K resolutions are projected to rise 28.07% CAGR through 2031.
- By geography, Asia-Pacific captured 27.45% revenue share in 2025, and the region is projected to expand 26.94% CAGR to 2031.
Note: Market size and forecast figures in this report are generated using Mordor Intelligence’s proprietary estimation framework, updated with the latest available data and insights as of 2026.
Global Virtual Retinal Display Market Trends and Insights
Drivers Impact Analysis*
| Driver | (~) % Impact on CAGR Forecast | Geographic Relevance | Impact Timeline |
|---|---|---|---|
| Surging Demand for Ultra-Compact Near-Eye Displays in Military Smart Helmets | +4.20% | North America; NATO allies | Medium term (2-4 years) |
| Rapid Adoption of Retinal Projection Aids for Low-Vision Patients across Japan and DACH | +3.80% | Japan; Germany; Austria; Switzerland | Short term (≤ 2 years) |
| Shift from Screen-Based to Screen-Less AR Wearables Driven by Silicon-Photonics Cost Drops in U.S. | +5.10% | North America; Asia-Pacific | Long term (≥ 4 years) |
| Vision-Safe Class-1 Laser Regulations Enabling Wider Consumer Adoption in EU | +2.90% | European Union | Medium term (2-4 years) |
| Integration of AI Eye-Tracking Modules Boosting Immersive Training Simulators | +3.60% | North America; Europe; Asia-Pacific | Long term (≥ 4 years) |
| Strategic Partnerships Accelerating Component Innovation in Asia-Pacific | +3.00% | China; South Korea; Taiwan | Medium term (2-4 years) |
| Source: Mordor Intelligence | |||
Surging Demand for Ultra-Compact Near-Eye Displays in Military Smart Helmets
Defense programs prioritize displays invisible to night-vision detectors yet bright in daylight. The U.S. Army’s Light Secure Special Warfare Display project funds prototypes that illuminate the retina directly, eliminating outward light leakage. [1]U.S. Department of Defense, “Light Secure Special Warfare Display (LSSWD),” sbir.gov Kopin’s soldier color MicroLED contracts worth more than USD 7.5 million underscore how ruggedized retinal projection meets size, weight, and power targets for field use.
Rapid Adoption of Retinal Projection Aids for Low-Vision Patients across Japan and DACH
Randomized trials show retinal laser eyewear improves acuity where lenses fail, prompting Japan’s insurers and German clinics to reimburse high-end systems. [2]PubMed, “Evaluation of a Retinal Projection Laser Eyewear in Patients with Visual Impairment Caused by Corneal Diseases in a Randomized Trial,” pubmed.ncbi.nlm.nih.gov Streamlined EU-MDR approvals and generous coverage in Switzerland support premium therapeutic devices, encouraging manufacturers to prioritize health-care-focused designs.
Shift from Screen-Based to Screen-Less AR Wearables Driven by Silicon-Photonics Cost Drops in U.S.
Large-scale integration in silicon photonics is reducing per-unit optical costs, placing retinal projection within consumer price envelopes. U.S. fabrication incentives tighten the domestic supply chain, while the same foundries that serve data-center optics now fabricate compact waveguides for smart glasses, consolidating volume economies.
Vision-Safe Class-1 Laser Regulations Enabling Wider Consumer Adoption in EU
EU harmonization around Class-1 limits gives product engineers clear optical-power ceilings, lowering certification costs compared with higher-class lasers. [3]FDA, “Photobiomodulation Devices – Premarket Notification [510(k)] Submissions,” fda.gov The precedent set by the Valeda photobiomodulation clearance reassures consumers that retinal laser exposure is safe, expanding the addressable consumer base.
Restraints Impact Analysis*
| Restraint | (~) % Impact on CAGR Forecast | Geographic Relevance | Impact Timeline |
|---|---|---|---|
| High Per-Unit Laser Scanner ASPs Causing BOM Pressures below USD 400 AR Glass Price-Point | -2.80% | Global | Short term (≤ 2 years) |
| Complex FDA and MDR Pathways for Implantable/Therapeutic VRDs | -1.90% | North America; Europe | Medium term (2-4 years) |
| Latency and Speckle Artifacts in RGB-Laser Engines Limiting Gaming Experience | -2.10% | Global | Short term (≤ 2 years) |
| Shortage of Automotive-Grade MEMS Mirrors for HUDs | -1.60% | Asia-Pacific; Global | Medium term (2-4 years) |
| Source: Mordor Intelligence | |||
High Per-Unit Laser Scanner ASPs Causing BOM Pressures below USD 400 AR Glass Price-Point
RGB laser engines still consume up to 40% of total device cost because compound-semiconductor wafers and precision MEMS scanners lack mass-volume scale. Automotive experience shows similar price rigidity for AEC-Q100 mirrors, meaning consumer brands must subsidize optics or forego sub-USD 400 price targets. [4]onsemi, “Managing Risk in Automotive Image Sensor Supply Chains,” onsemi.com
Complex FDA and MDR Pathways for Implantable/Therapeutic VRDs
Retinal implants meet significant-risk classifications, triggering multi-year clinical studies. Dual compliance with FDA’s IDE rules and Europe’s MDR demands exhaustive evidence packages, lengthening time-to-market and raising capital barriers for startups.
*Our forecasts treat driver/restraint impacts as directional, not additive. The impact forecasts reflect baseline growth, mix effects, and variable interactions.
Segment Analysis
By Component: Light Sources Drive Integration Complexity
Display Light Source elements, chiefly RGB laser and MicroLED engines, accounted for 33.92% of virtual retinal display market share in 2025. Their dominance stems from the direct link between optical efficiency and battery life. Eye-Tracking & Calibration Modules are expanding fastest at 26.17% CAGR, fueled by AI-enabled gaze analytics. The virtual retinal display market size for Eye-Tracking is expected to widen as MEMS mirrors remain supply-constrained, nudging integrators toward software-centric precision monitoring. Texas Instruments’ DLPC8445 controller shrinks by 90% while driving 4K UHD, proving backend silicon keeps pace with front-end lasers.
Optical Combiners and Waveguides are advancing through collaborations such as DigiLens and Avegant, which merge transparent waveguides with retinal projectors. Meanwhile, Q-Pixel’s 10,000 PPI tunable polychromatic LEDs hint at single-pixel architectures that could lower alignment tolerances and yield gains. As vertical integration deepens, component vendors that control both emitters and control electronics command sustainable margins.


By Product Type: AR Glasses Lead Market Transformation
AR Smart Glasses delivered 40.35% of virtual retinal display market revenue in 2025, cementing their role as the anchor hardware category. Implantable/Low-Vision Aids, though smaller today, will post a 26.45% CAGR to 2031 as aging populations and insurer reimbursement accelerate uptake. The virtual retinal display market size for therapeutic aids is poised to climb because clinical evidence keeps expanding. Investments such as Quanta Computer’s additional USD 5 million in Vuzix improve waveguide throughput, signaling contract manufacturing’s growing influence.
Standalone Retinal Projection Headsets persist in defense and industrial simulation niches where long-mission runtimes justify dedicated power packs. Automotive HUDs await qualified MEMS mirrors, which restrains volume scaling despite Texas Instruments’ new DLP4620S-Q1 automotive micromirror introduction through Mouser in March 2025. Market skews show consumer convenience versus professional specialization, and suppliers must balance the two roadmaps.
By Application: Medical Dominance Faces Gaming Challenge
Medical and Life Sciences applications comprised 37.65% of virtual retinal display market revenue in 2025, supported by Europe’s generous reimbursement and Japan’s national vision-care policies. Consumer Electronics & Gaming, projected to grow at 24.84% CAGR, is next in line as latency and speckle issues are engineered out. Aerospace & Defense contracts such as Kopin’s microLED awards widen recurring revenue, while Industrial Training taps AI eye-tracking to adapt curricula dynamically.
The virtual retinal display market size for consumer gaming will depend on solving laser coherence artifacts that currently limit fast-motion scenes. Conversely, regulated medical pathways, though complex, create high-margin niches once approvals are granted. Thus developers often pursue dual portfolios: premium therapeutic devices for cash flow stability and mass-market gaming models for scale upside.
By Resolution: 4K+ Growth Challenges Infrastructure
Full HD retained 29.12% share in 2025 because it balances clarity with thermal and battery constraints. Above 4K formats, however, are racing ahead at 28.07% CAGR, driven by flight simulation and e-sports that demand photorealism. The virtual retinal display market size for Above 4K panels will expand as silicon-carbide substrates improve thermal paths.
Yet, processing overhead rises proportionally: a 4K retinal engine needs more than double the pixel-rate of a 1080p equivalent. Research on 2,117 PPI liquid-crystal displays proves feasibility but spotlights power draw hurdles. Consequently, vendors are integrating edge AI chips to compress rendering workloads closer to the eye.
Geography Analysis
Asia-Pacific held 27.45% revenue share in 2025 and is forecast to compound 26.94% annually through 2031, reflecting unmatched semiconductor fabs, optics polishing supply chains, and domestic consumer appetites. China’s foundry incentives push down laser-die pricing, and Japan’s healthcare system actively deploys therapeutic devices for age-related degeneration. South Korea’s display giants couple OLED competencies with MicroLED pilot lines, while Taiwan tightens backend packaging yields.
North America leverages defense budgets and university R&D. The virtual retinal display market benefits from the U.S. Army’s successive microLED contracts and CHIPS-Act-backed silicon-photonics fabs that localize critical optics. Canada offers streamlined medical-device reviews, making it an attractive first-in-region for therapeutic launches, and Mexico’s maquiladora corridors provide tariff-free final assembly for export within North America.
Europe remains regulatory pacesetter. Class-1 laser regulations, coupled with the Valeda photobiomodulation precedent, furnish predictable frameworks that manufacturers can replicate globally. Germany and Switzerland merge precision optics machining with med-tech funding, fostering an ecosystem tailored to high-value medical displays. Nordic early-adopters test lifestyle-oriented AR eyewear, providing feedback loops for battery life and ergonomics. EU energy directives additionally steer suppliers toward low-power designs, giving European players leverage in sustainability-minded markets.

Regulatory Landscape
Virtual retinal displays are shaped by laser-product safety rules, and for therapeutic and implantable uses, by medical-device regulatory pathways. In the United States, laser-based near-eye and retinal-projection products must meet FDA laser product performance requirements under 21 CFR 1040.10 (and 1040.11 where applicable), including accessible emission limits and labeling. FDA also supports conformance routes aligned to IEC 60825-1 (Edition 3) for demonstrating compliance when the required declarations and documentation are provided, which affects how VRD OEMs prepare test reports, labeling, and technical files across consumer and defense-grade programs.
Standardization is also tightening around how raster-scanning retina direct projection performance is measured, with IEC 62906-5-5:2022 specifying optical measurement methods for RS-RDP laser displays. Trade and IP enforcement further influence go-to-market choices: a 2025 U.S. Customs and Border Protection ruling (HQ H345669) pointed to how country-of-origin and tariff exposure for smart glasses can depend on where the core PCBA is manufactured. Separately, USITC Section 337 proceedings involving certain electronic eyewear products remained active into mid-2026, reinforcing exclusion-order risk for suppliers operating in crowded near-eye display IP spaces.
Value Chain Analysis
The VRD value chain begins with specialized upstream components, including laser or microLED emitters, MEMS scanning units, driver and control ICs, eye-tracking and calibration sensors, plus optical combiners or waveguides that package light into glasses-grade form factors. Emission sources and scanning subsystems are concentrated among a limited set of compound-semiconductor and precision-MEMS supply bases. Optical fabrication (waveguides and advanced combiners) is often a practical bottleneck due to yield sensitivity and the tight tolerances needed for eye-box performance, field-of-view targets, and safety compliance.
Midstream integrators assemble these building blocks into optical engines and reference designs, and OEMs and EMS partners then industrialize assemblies for AR smart glasses, medical and low-vision aids, and defense wearables. Partnerships increasingly connect emitter and module expertise to reduce integration risk, including the June 2026 business cooperation between TDK and QD Laser to jointly develop RGB light source modules and optical engines using QD Laser retinal projection technology. Downstream channels split between regulated clinical deployment (where documentation, service networks, and reimbursement pathways matter) and consumer or enterprise wearables (where contract manufacturing scale, waveguide throughput, and component cost-down requirements shape adoption).
Competitive Landscape
The virtual retinal display market features medium fragmentation. Horizontal suppliers such as Texas Instruments guard micromirror patents that underpin DLP architecture, while vertically integrated challengers like Kopin advance MicroLED emitters and driver ICs. Partnerships overshadow outright acquisitions; Google’s tie-up with Magic Leap aligns cloud AI with retinal optics to shortcut the end-to-end software stack.
Contract manufacturing is the new battleground. Vuzix joined forces with Quanta Computer to multiply waveguide output, shifting risk from optical startups to EMS powerhouses. Meanwhile, Q-Pixel and SolidddVision pursue niche disruption: the former by collapsing RGB into a single tunable pixel and the latter by focusing on macular-degeneration aids. Supply constraints around automotive-grade MEMS mirrors create white-space for new entrants able to certify devices faster.
Three technology clusters emerge. First, defense-grade systems emphasize brightness and ruggedization, leaning on public funding to mature new emitters. Second, therapeutic platforms concentrate on regulatory know-how and clinician networks. Third, consumer electronics players balance price with weight and style, betting that silicon photonics will keep BOMs within reach. Cross-licensing between clusters increases as core IP—waveguides, controllers, eye-tracking—converges.
Virtual Retinal Display Industry Leaders
Magic Leap Inc.
Optivent
Analogix Semiconductor Inc.
QD Laser Co. Ltd
Human Interface Technology Laboratory
- *Disclaimer: Major Players sorted in no particular order

Market Opportunities and Future Outlook
Product and component roadmaps are creating whitespace for standardized, manufacturable optical engines for AR smart glasses, particularly where OEMs want to avoid bespoke, one-off integrations across lasers, scanners, controllers, and safety subsystems. The June 2026 TDK and QD Laser cooperation to co-develop RGB light source modules and optical engines is a concrete signal that suppliers are packaging retinal projection capabilities into more repeatable modules, which can reduce OEM design cycles and broaden the set of device makers beyond vertically integrated incumbents.
A second opportunity area is the move toward alternative retinal-projection architectures that lessen dependence on laser sources or improve ergonomics and field-of-view constraints that have constrained consumer-grade designs. Academic prototypes disclosed in 2026 include an active retinal projection display approach using pixel-to-pixel collimated microLED arrays (reported by Huazhong University of Science and Technology) and curved-waveguide retinal projection concepts aimed at wide field-of-view and usable depth-of-field. As these architectures mature alongside fast-growing eye-tracking and calibration modules within the broader VRD bill of materials, suppliers able to provide safety-compliant optical modules, repeatable calibration workflows, and higher-yield waveguide and combiner manufacturing have clear paths to expand across medical, defense, and consumer electronics programs.
Recent Industry Developments
- July 2026: Magic Leap announced a strategic shift to focus on supplying AR waveguides, emphasizing its proprietary waveguide manufacturing capabilities for scaled production. The move aligns the company more directly with the VRD ecosystem by strengthening a critical optical-combiner node that influences yield, form factor, and overall device cost for glasses-grade designs.
- December 2025: Magic Leap signed an agreement with Pegatron to collaborate on high-volume manufacturing of AR glasses components, including waveguides. Working with a large-scale manufacturing partner supports process industrialization and throughput improvements that are central to meeting consumer-electronics supply requirements for near-eye display platforms.
- May 2024: Magic Leap entered into a multi-faceted technology partnership with Google to collaborate on XR solutions. The collaboration connected a waveguide-focused optics stack with a major platform ecosystem, reinforcing the importance of end-to-end hardware and software integration for next-generation wearable display products.


Research Methodology Framework and Report Scope
Market Definition and Coverage
The virtual retinal display market is defined as revenue generated from systems that create images by scanning or projecting light so the visual information is formed on the retina, including the related optical engine and control electronics sold into end-use applications.
Scope exclusions: We exclude conventional near-eye microdisplays that form images on a panel without retinal projection, and non-display AR software and content services.
Segmentation Overview
- By Component
- Display Light Source (RGB Laser, Micro-LED, OLED)
- MEMS Scanning Unit
- Driver and Control Electronics
- Eye-Tracking and Calibration Module
- Optical Combiner and Waveguide
- Others
- By Product Type
- Standalone Retinal Projection Headsets
- Augmented-Reality Smart Glasses
- Automotive Head-Up Displays
- Implantable/Low-Vision Aids
- Others
- By Application
- Medical and Life Sciences
- Aerospace and Defense
- Consumer Electronics and Gaming
- Automotive and Transportation
- Industrial, Education and Training
- By Resolution
- HD (Upto 720p)
- Full HD (1080p)
- 2K-4K
- Above 4K
- By Geography
- North America
- United States
- Canada
- Mexico
- Europe
- Germany
- United Kingdom
- France
- Nordics
- Rest of Europe
- South America
- Brazil
- Rest of South America
- Asia-Pacific
- China
- Japan
- India
- South-East Asia
- Rest of Asia-Pacific
- Middle East and Africa
- Middle East
- Gulf Cooperation Council Countries
- Turkey
- Rest of Middle East
- Africa
- South Africa
- Rest of Africa
- Middle East
- North America
Data Sources, Market Sizing, and Validation
Desk Research
Desk research was used to build the base structure of the market and to keep assumptions realistic before we spoke to industry participants. We reviewed public sources such as US FDA device databases and guidance notes for ophthalmic and visual-assist devices, USPTO and WIPO patent filings for scanning displays and optical engines, and IEEE and other peer-reviewed journals that document performance limits like field-of-view, brightness, and eye-safety thresholds.
We also referred to US International Trade Commission data and customs statistics where relevant for optical components, along with company annual reports, investor presentations, and reputable press coverage of prototype launches and manufacturing ramps. In a few places, we cross-checked company financials, patent databases, and shipment-level import-export records through paid subscriptions that are commonly used for market diligence. The sources listed here are illustrative only, and many other public documents were also used to collect, validate, and clarify data points.
Primary Interviews and Surveys
Primary work focused on validating how virtual retinal display shipments translate into revenue across different device formats and end uses, since public reporting is often limited. We spoke with a mix of component makers, system integrators, channel participants, and domain experts across APAC, EMEA, and the Americas so that pricing moves, adoption timing, and practical constraints (like qualification cycles and eye-safety requirements) could be checked and then applied consistently in the model.
Distribution of primary research fieldwork respondents
| Company type | Respondent position | Region |
|---|---|---|
| Top tier: 33% | CXOs: 15% | APAC: 43% |
| Mid tier: 52% | Functional/Unit leaders: 32% | EMEA: 31% |
| Smaller Players: 15% | Managers: 53% | Americas: 26% |
Market-Sizing & Forecasting
Sizing started from a top-down demand pool reconstruction, where device adoption by end-use was translated into addressable units and then mapped to virtual retinal display attachment and average selling prices. To keep it grounded, the totals were corroborated with selective bottom-up checks, such as sampled system ASPs by device type, supplier side roll-ups for key optical and scanning modules, and channel checks on early commercial volumes.
A few practical inputs were treated as key fingerprints in the model, including expected unit shipments for AR smart glasses and specialized headsets, optical engine pricing by brightness and resolution class, qualification and procurement cycles in aerospace and defense, and prototype-to-production conversion rates in medical use cases. We also tracked indicators like patenting momentum around MEMS scanning, published eye-safety constraints that limit output power, and region-wise manufacturing capacity signals that influence near-term availability.
For forecasting, we relied mainly on scenario analysis supported by primary feedback on adoption hurdles and time-to-scale, and then we used exponential smoothing on shipment and pricing series to avoid sharp jumps that are hard to defend. When bottom-up datapoints were missing for smaller suppliers, gaps were handled using benchmark ASP bands and conservative unit ranges that were reviewed again during expert follow-ups.
Data Validation & Update Cycle
Validation was done through triangulation between the model outputs and independent signals, such as device shipment narratives, component pricing ranges, and application-level adoption timelines. Outliers were flagged when implied ASPs or unit growth moved outside what interviewees described as feasible, and the assumptions were then revisited until the variance narrowed to a reasonable range.
Before sign-off, the work goes through multiple analyst reviews where calculations, currency handling, and year alignment are rechecked, followed by a final read to ensure the story matches the numbers. Reports are refreshed annually, and interim updates are made when material events occur, such as a major product launch, regulation changes, or noticeable supply shifts. Right before delivery, we run a fresh pass so the client receives the most up-to-date view available at that time.
Mordor Intelligence's Virtual Retinal Display Market Size Measured Against Other Published Estimates
Published market values for virtual retinal display often differ because firms do not always count the same products, and the timing of the base year also varies across studies. Differences can also come from how average selling prices are built up, and whether early pilot volumes are treated as commercial demand or kept separate.
Consumer AR smart glasses that only use conventional microdisplay panels sit outside Mordor Intelligence's scope, which narrows the addressable unit pool compared with estimates that blend retinal projection with the broader near-eye display space. The spread also grows when a study assumes aggressive price declines without checking component constraints like scanning-module yields, or when currency conversion is done using a single-year rate even though most supply is multi-region.
Benchmark comparison
| Source | Market Size | Gaps in Research Methodology |
|---|---|---|
| Mordor Intelligence | USD 1.59 B (2026) | |
| Trade Publisher A | USD 2.47 B (2024) | Uses an earlier base year and appears to treat broader AR display shipments as part of the same market, which increases units before retinal-projection attachment is proven at scale. |
| Global Consultancy B | USD 6.10 B (2024) | Likely includes adjacent display and optics revenue beyond retinal projection systems, and the pricing build-up is not clearly tied to device-format level ASP bands. |
The table shows that the biggest differences are tied to what is included as a virtual retinal display system and how base-year commercial volumes are interpreted. By keeping the unit pool tied to retinal-projection deployments and checking pricing against component reality, the market total stays traceable to clear variables that can be repeated and updated.


Key Questions Answered in the Report
What is the current size of the virtual retinal display market?
The market is valued at USD 1.59 billion in 2026.
How fast will the virtual retinal display market grow?
Revenue is projected to rise at a 24.02% CAGR, reaching USD 4.66 billion by 2031.
Which segment is expanding the quickest?
Eye-Tracking & Calibration Modules lead with a 26.17% CAGR through 2031.
Why is Asia-Pacific important in this industry?
The region combines semiconductor fabs, display expertise, and a large consumer base, capturing 27.45% share in 2025 and growing faster than any other geography.
What are the main barriers to consumer adoption?
High laser-scanner costs and stringent FDA/EU medical device approvals prolong time-to-market and keep retail prices above mainstream thresholds.
How does military spending influence technology roadmaps?
Defense programs fund ruggedized microLED and stealth retinal projection, accelerating component maturity that later migrates to consumer and medical products.
Page last updated on:


