
Market Overview
| Study Period | 2019 - 2031 |
|---|---|
| Forecast Data Period | 2026 - 2031 |
| Base Year Market Size (2025) | USD 23.91 Billion |
| Market Size (2026) | USD 24.79 Billion |
| Market Size (2031) | USD 33.32 Billion |
| Growth Rate (2026 - 2031) | 6.09 % |
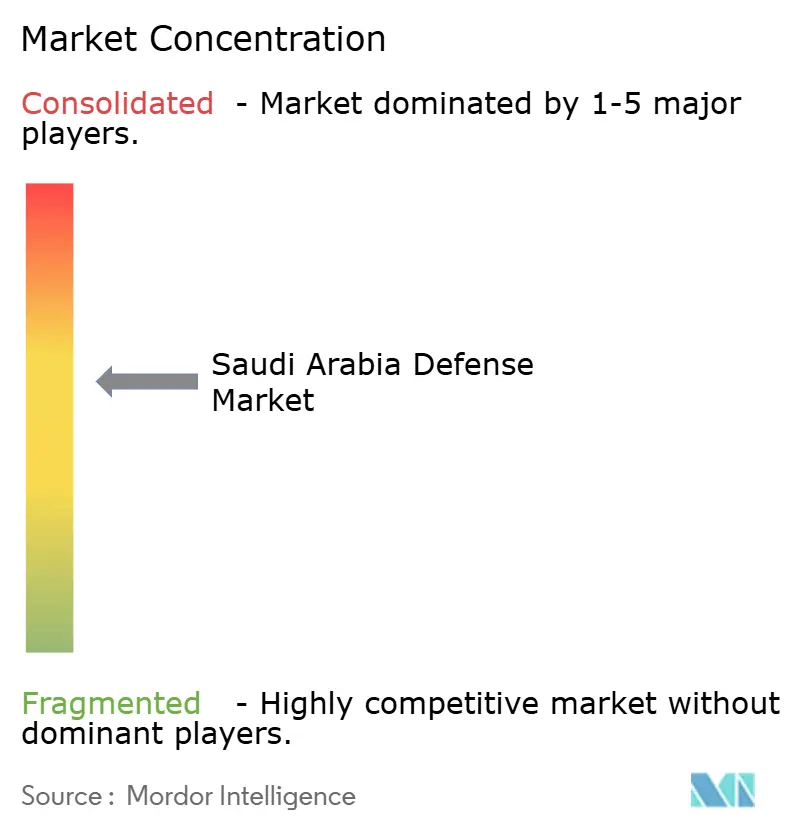
| Market Concentration | Medium |
Major Players *Disclaimer: Major Players sorted in no particular order Image © Mordor Intelligence. Reuse requires attribution under CC BY 4.0. | |
Saudi Arabia Defense Market Analysis by Mordor Intelligence
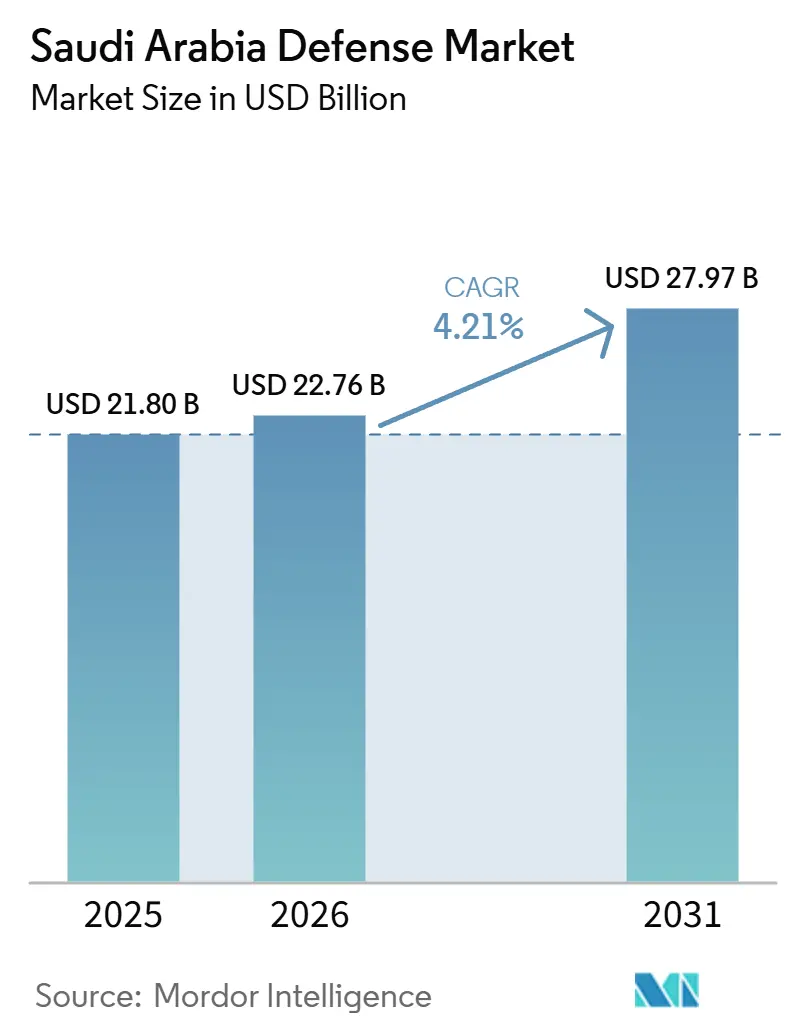
The Saudi Arabia defense market size was valued at USD 23.91 billion in 2025, and is projected to grow from USD 24.79 billion in 2026 to USD 33.32 billion by 2031 at a 6.09% CAGR over 2026-2031. Steady growth is driven by Vision 2030, which allocates more than half of future expenditures to domestic manufacturing, mitigates exposure to oil-price fluctuations, and ties defense budgets to industrial diversification. Indigenous production is scaling through joint ventures that embed technology-transfer clauses into every prime contract. At the same time, regional threats continue to intensify demand for layered air, missile, and counter-UAS defenses. Naval modernization is gaining momentum because Red Sea shipping lanes are facing persistent missile and UAV attacks, and space-based ISR investments have moved from concept to funded programs under Neo Space Group. Competitive dynamics are shifting as suppliers from Turkey and South Korea win awards by coupling flexible financing with high local content commitments, challenging the historical dominance of US and European primes.
Key Report Takeaways
- By armed forces, the Air Force led spending with a 38.19% share in 2025 and is forecast to grow at a 6.65% CAGR through 2031.
- By type, military MRO accounted for 22.82% of 2025 outlays, whereas sensors are forecast to grow at a 6.62% CAGR through 2031.
- By domain, air accounted for 36.90% of the 2025 expenditure, while space is projected to grow at a 10.35% CAGR through 2031, driven by Neo Space Group programs.
- By procurement nature, foreign acquisitions accounted for 80.50% of 2025 budgets, yet indigenous production is forecast to grow at an 11.40% CAGR through 2031.
Note: Market size and forecast figures in this report are generated using Mordor Intelligence’s proprietary estimation framework, updated with the latest available data and insights as of January 2026.
Saudi Arabia Defense Market Trends and Insights
Drivers Impact Analysis*
| Driver | (~) % Impact on CAGR Forecast | Geographic Relevance | Impact Timeline |
|---|---|---|---|
| Sustained growth in defense spending aligned with Vision 2030 priorities | +1.2% | Riyadh and Eastern Province industrial zones | Long term (≥ 4 years) |
| Defense localization and offset mandates strengthening domestic manufacturing | +1.0% | Riyadh, Dammam, Jeddah | Medium term (2-4 years) |
| Rising UAVs, missiles, and counter-UAS requirements from regional security threats | +0.9% | Najran, Jizan, Red Sea coast | Short term (≤ 2 years) |
| Increasing investment in space-based ISR and satellite surveillance capabilities | +0.5% | Riyadh R&D clusters | Long term (≥ 4 years) |
| Expansion of cyber-defense programs to protect national critical infrastructure | +0.4% | Energy and financial infrastructure nodes | Medium term (2-4 years) |
| Modernization of integrated air and missile defense systems | +0.8% | Riyadh, Eastern Province oil facilities, major ports | Medium term (2-4 years) |
| Source: Mordor Intelligence | |||


Sustained Growth in Defense Spending Aligned with Vision 2030 Priorities
Vision 2030 integrates defense funding into the KSA's industrial strategy, shielding budgets from commodity price fluctuations and anchoring long-term localization objectives. The Public Investment Fund's ownership of Saudi Arabian Military Industries (SAMI) links each multi-year program to job creation and technology transfer, thereby strengthening political support when oil revenues decline. The SAR 272 billion (USD 72.48 billion) defense allocation for 2025 preserves the momentum for modernization, despite a planned SAR 27 billion (USD 7.20 billion) fiscal deficit, demonstrating the ring-fenced status of military outlays within macro budget planning. Localization climbed from 4% in 2018 to 24.89% by the end of 2024, adding more than 800 direct jobs through National Guard contracts alone. As the share of local content rises, the Saudi Arabia defense market allocates expenditure to domestic supply chains rather than foreign balance sheets, creating constituencies that resist future cuts.
Defense Localization and Offset Mandates Strengthening Domestic Manufacturing
Offset clauses have become a gatekeeper for every major award. The Ministry of National Guard requires a minimum of 60% local content on its weapons-sustainment agreement signed in January 2025. GAMI’s licensing portal blocks foreign investors who fail to demonstrate domestic value creation, steering primes toward joint ventures such as Baykar’s Akinci UAV line, which includes 70% Saudi production, and Lockheed Martin’s THAAD partnerships with Middle East Propulsion Company. BAE Systems folded two long-standing entities into BAE Systems Arabian Industries in May 2025 to align with new thresholds. Tier-2 and tier-3 ecosystems lag, however, forcing primes to import precision parts and use training credits to meet offset ratios, diluting industrial depth.
Rising UAVs, Missiles, and Counter-UAS Requirements from Regional Security Threats
Persistent Houthi UAV raids on Aramco assets and anti-ship missile launches in the Red Sea have elevated C-UAS capability to a top budgeting priority. The Red Sands 2025 exercise evaluated 20 systems and preceded a USD 100 million order for 2,000 APKWS rockets, configured for UAV interception.[1]Ashley Roque, “Saudi Arabia buys APKWS for counter-drone missions,” Breaking Defense, breakingdefense.com Saudi Arabia fields a layered construct that combines kinetic interceptors, laser effectors, and jammers, enabled by the September 2024 delivery of a GaN AN/TPY-2 radar optimized to discriminate small targets. Cost-per-kill metrics favor this combined approach when confronting low-cost UAV swarms, setting a regional benchmark that NATO states are studying.
Increasing Investment in Space-Based ISR and Satellite Surveillance Capabilities
Neo Space Group’s launch in May 2024 signaled that satellite ISR has moved into the funded mainstream of the Saudi Arabia defense market. Earth observation revenues are forecast to rise from USD 80.80 million in 2024 to USD 111.80 million by 2030, supporting real-time border monitoring, maritime domain awareness, and energy infrastructure security. Agreements with Thales Group and Leonardo S.p.A. aim to establish sovereign capabilities in collection and analytics, thereby reducing reliance on US National Technical Means. Indigenous satellites will ultimately enable unilateral targeting options, altering future coalition dynamics.
Restraints Impact Analysis*
| Restraint | (~) % Impact on CAGR Forecast | Geographic Relevance | Impact Timeline |
|---|---|---|---|
| Oil-price volatility affecting long-term defense procurement planning | -0.6% | Riyadh fiscal planning units | Short term (≤ 2 years) |
| Limited maturity of local tier-2 and tier-3 defense supplier ecosystem | -0.4% | Eastern Province and Riyadh industrial clusters | Medium term (2-4 years) |
| Export-control and ITAR restrictions on advanced foreign defense technologies | -0.3% | National, impacting all US origin programs | Long term (≥ 4 years) |
| Execution and schedule risks arising from aggressive localization targets | -0.3% | SAMI-led programs in Riyadh, Dammam, and Jeddah | Medium term (2-4 years) |
| Source: Mordor Intelligence | |||
Oil-Price Volatility Affecting Long-Term Defense Procurement Planning
Brent trading between USD 70 and USD 90 per barrel in 2024-2025 forced planners to announce a SAR 27 billion (USD 7.20 billion) deficit for 2025, tightening the flexibility of multi-year contracts. Although defense remains ring-fenced, primes now seek advance payments, which lock fiscal headroom and shift preference toward modular upgrades over headline mega deals.
Limited Maturity of Local Tier-2 and Tier-3 Defense Supplier Ecosystem
Localization reached 24.89% by the end of 2024; however, the deep industrial capacity lags behind this target. Precision machining, radar modules, and EW subsystems still rely on imports because ITAR restrictions prevent full technology transfer.[2]Rahaf Jambi, “Kingdom achieves 24.9% localization in military spending by 2024,” Arab News, arabnews.pk Aggressive offset targets risk incentivizing low-value assembly relocation rather than nurturing high-margin subcomponent production, a gap that Vision 2030 agencies aim to close through targeted SME financing.
*Our forecasts treat driver/restraint impacts as directional, not additive. The impact forecasts reflect baseline growth, mix effects, and variable interactions.
Segment Analysis
By Armed Forces: Air Force Modernization Accelerates Fastest
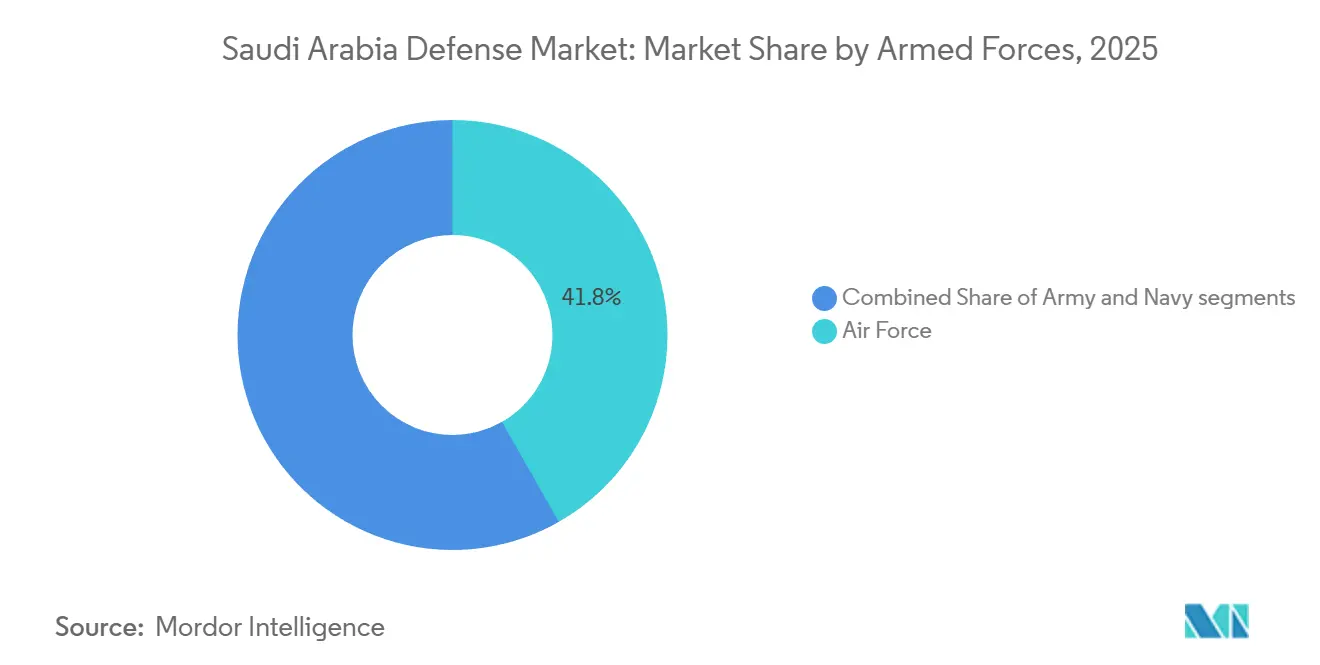
Air Forces held the largest share, at 38.19%, of 2025 expenditure, and is expected to show the fastest growth with a CAGR of 6.65% during the forecast period. 228 F-15 variants and 72 Typhoons underpin the domination. Germany’s 2024 veto reversal opened the door for 48 additional Typhoons, while an open competition for roughly 50 next-generation fighters pits Rafale, F-15EX, and Typhoon upgrades against one another. Sustainment, not acquisition, now drives most Air Force line items, which moderates growth relative to the Navy. Army allocations focus on 300 newly ordered M1A2 SEPv3 tanks and indigenous 8x8 howitzers under the SAMI program.
The naval forces are projected to grow at a 5.80% CAGR through 2031. Four Tuwaiq-class frigates valued at about USD 6 billion are under construction, with the first hull launched in December 2025, and eight Avante 2200 corvettes will be delivered by 2027. These surface combatants integrate COMBATSS-21 and Mk 41 launchers, equipping the Royal Saudi Navy with layered missile defense and anti-surface warfare capabilities. Red Sea and Gulf shipping lanes face UAV boats and anti-ship ballistic missiles, so the Navy’s share within the Saudi Arabia defense market climbs as policymakers seek a persistent maritime presence rather than episodic air sortie coverage.


By Type: Military MRO Dominated Due to Increasing Fleet Modernization Programs
The military MRO segment accounted for 22.82% of the market share in 2025, driven by rising expenditure on military modernization and upgrade programs across defense forces. Military platforms accounted for significant shares in 2025, reflecting a commitment of USD 7.2 billion for 300 new Abrams tanks and continued upgrades to the LAV. This category retains numerical dominance, yet sensors post the strongest CAGR at 6.62% due to growing demand for advanced military radars, electro-optical/infrared (EO/IR) sensors, thermal imagers, and other sensors.
Weapons and ammunition budgets spike with recurring missile packages, including the USD 3.5 billion AMRAAM lot and the USD 655 million Hellfire buy in 2024. C4ISR and EW investments are mounting as Leonardo DRS and L3Harris Technologies, Inc. integrate cyber-secure displays and autonomous vessel payloads. Space and Cyber Systems, although still small, are recording rapid gains through Neo Space Group's satellite roadmap and Raytheon-Aramco's cyber joint ventures. Collectively, these shifts indicate that Saudi Arabia's defense market share of legacy-heavy platforms will gradually cede ground to networked, multi-domain capabilities.
By Domain: Space Investments Outpace Traditional Segments
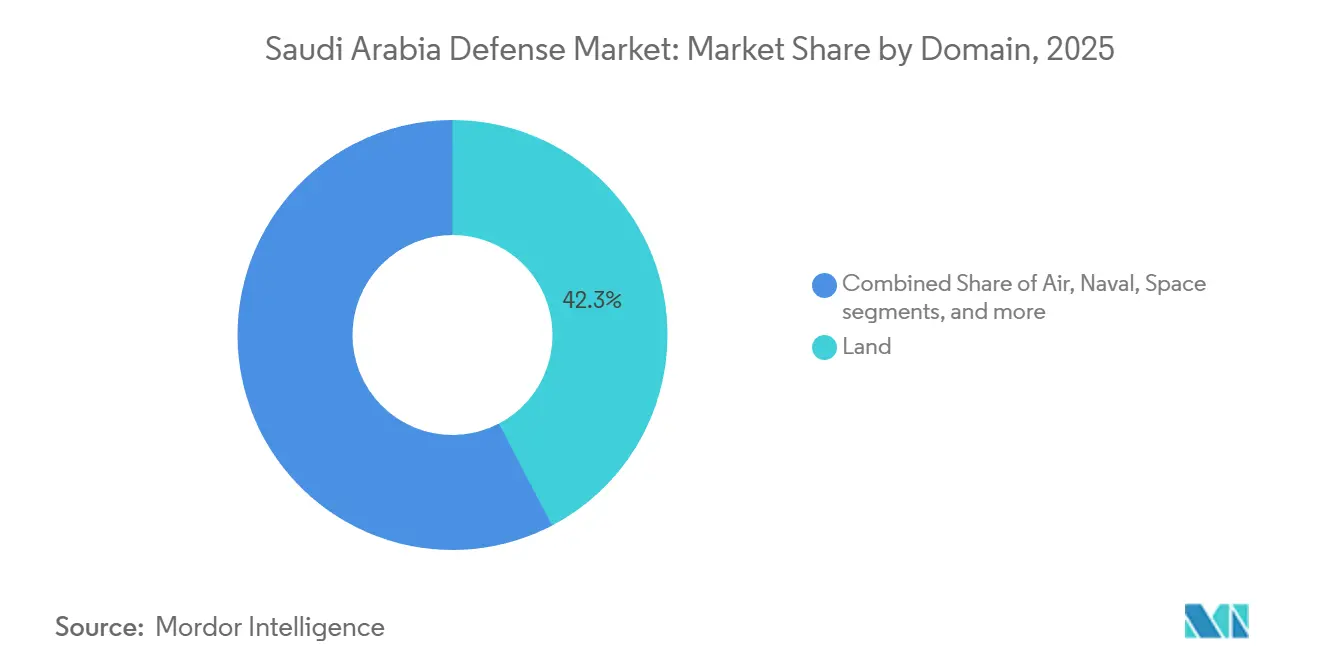
Air held the largest market share, at 36.90% in 2025. Air domain priorities emphasize life-cycle upgrades, missile defense refreshes, and counter-UAV layers. Land accounted for a significant share, supported by vehicle fleets and border-security sensors; however, its incremental growth may lag as the force structure stabilizes. Naval programs continue to expand through the acquisition of frigates, corvettes, and indigenous fast-interceptor boats manufactured in partnership with French companies. Cyber and spectrum operations integrate across all domains through the Essential Cybersecurity Controls framework, positioning local firms for regional export.
Space budgets are rising at a 10.35% CAGR, the fastest among operational domains, backed by Neo Space Group capitalization and forecast growth in earth-observation revenue to USD 111.80 million by 2030. Satellite ISR aims to offset human-intelligence gaps in Yemen and the Gulf littoral, enabling the KSA to self-cue precision weapons without allied targeting data.
By Procurement Nature: Indigenous Production Gains Despite Foreign Dominance
Foreign awards accounted for 80.50% of 2025 budgets, underpinned by the USD 142 billion US-Saudi strategic defense agreement, which includes F-35s, tanks, and missile-defense upgrades. Even so, indigenous production shows an 11.40% CAGR as Vision 2030 enforces 50% localization by the end of the decade. SAMI’s January 2025 National Guard sustainment contracts achieved more than 60% local content, and BAE’s Arabian Industries venture consolidates training and logistics within KSA borders.
US primes still dominate complex systems but face ITAR constraints that slow component transfers, leaving room for Turkey’s Baykar and South Korea’s Hanwha, both of which structure deals around local assembly and technology handoffs. The share of the Saudi defense market attributed to homegrown manufacturing will continue to expand. Yet, capability gaps in high-end subsystems may persist unless parallel non-US supply chains mature.
Geography Analysis
Saudi Arabia allocated SAR 272 billion (USD 72.48 billion) to defense in 2025, cementing its status as one of the top five global defense spenders, despite a projected deficit of SAR 27 billion (USD 7.20 billion). Riyadh centralizes decision-making through the MoD, GAMI, and the Public Investment Fund, while the Eastern Province hosts heavy industry, including Zamil Offshore and Aramco’s critical energy assets. Jeddah anchors BAE Systems Arabian Industries and provides deep-water access for naval deliveries.
Southern regions Najran and Jizan deploy dense air and counter-UAS systems to blunt Houthi threats, whereas ports along the Red Sea reinforce naval presence in response to anti-ship missile activity. The Red Sands 2025 counter-UAS exercise, conducted in western test ranges, highlighted this shift in defense priorities. The May 2024 establishment of Neo Space Group in Riyadh positioned Riyadh as the hub for space R&D and operations, underscoring how new domains tend to cluster around policy centers.
Supplier diversity unfolds unevenly across regions. Korean multifunction radars integrate with the first near-eastern oil fields, while Turkish UAV lines operate in central industrial parks to leverage shared test airspace. Each new facility adds skilled jobs to Vision 2030 economic clusters, reinforcing political support for defense outlays even during oil-price downturns. Oil volatility, nevertheless, forces finance officials to prefer incremental procurement that can be paused without breaching contract penalties, thereby shaping a modular geography of production.
Regulatory Landscape
The Saudi defense industrial base is regulated by the General Authority for Military Industries (GAMI), established by Council of Ministers Resolution No. 210 (2019). GAMI governs market entry and ongoing operations through mandatory permitting and licensing (including Establishment Permits and Military Industrial Activity Licenses) issued via the Military Industries Unified Portal, which also serves as a compliance gateway for standards inquiries and related industry services.
Procurement policy embeds localization through GAMI's Industrial Participation Policy, which requires industrial participation criteria to be assessed alongside price and technical factors in military procurements. Contractors must also comply with GAMI policies for standards, specifications, testing, and quality in the military industries sector, so documented conformance to technical and security requirements remains a condition for licensing and access to defense manufacturing programs.
Value Chain Analysis
Saudi Arabia's defense value chain is shifting from import-led acquisition toward local integration, anchored by prime integrators such as SAMI and a growing set of joint ventures structured around technology transfer and industrial participation. Upstream inputs and subsystems still include imported precision components for electronics, propulsion, radar, and EW, while local partners and subsidiaries (for example, SAMI Land, SAMI Autonomous, and SAMI Advanced Electronics) increasingly handle assembly, integration, and selected manufacturing work packages under localization requirements.
Midstream, industrial hubs are becoming the organizing nodes for production and qualification, including the SAMI Land Industrial Complex (SLIC) in Riyadh with stated capacity to produce 1,500 military vehicles annually, and planned specialized manufacturing such as the gun barrel facility under a GAMI and KNDS framework agreement. Downstream, sustainment, upgrades, and depot-level repair are being localized through partnerships with international primes and Saudi firms, which improves readiness and shortens supply lead times, while gaps in tier-2 and tier-3 depth continue to concentrate risk in imported high-end subcomponents and testing capabilities.
Competitive Landscape
Market leadership resides with a small cadre of US and European primes. Yet challenger firms from Turkey and South Korea are expanding their market share by combining flexible financing with high localization. Lockheed Martin Corporation spans air, sea, and missile defense portfolios, while The Boeing Company anchors fighter sustainment and new helicopter options. RTX Corporation, Northrop Grumman Corporation, and BAE Systems plc round out the top tier through their radar, EW, and joint-venture footprints that employ thousands of Saudi nationals.[3]Ashley Roque, “BAE Systems launches new Saudi Arabia joint venture,” Breaking Defense, breakingdefense.com
SAMI aims to localize 50% of the KSA’s defense spending by 2030. To achieve this goal, SAMI has established 12 joint ventures with the world’s largest and leading original equipment manufacturers. Hanwha leverages the USD 3.2 billion Cheongung II program, including USD 867 million in radar systems, to plant long-term roots. Baykar’s Akinci initiative represents Turkey’s most significant single defense export, valued at roughly USD 3 billion, and exemplifies the technology-transfer premium now embedded in the award criteria. Leonardo S.p.A., L3Harris Technologies Inc., and Thales Group each signed 2025 memoranda that bundle cyber, EW, and space capabilities with local R&D to chase white-space opportunities.
New entrants must navigate GAMI’s licensing portal, which awards permits only when local-value thresholds are met. This regulatory stance compresses margins for incumbents but accelerates workforce development across electronics, propulsion, and composite materials. As a result, the Saudi Arabia defense market is transitioning from an import-led structure to a partnership network in which intellectual property sharing is the price of market entry.
Saudi Arabia Defense Industry Leaders
Lockheed Martin Corporation
BAE Systems plc
RTX Corporation
The Boeing Company
Saudi Arabian Military Industries
- *Disclaimer: Major Players sorted in no particular order

Market Opportunities and Future Outlook
Localization policy creates clearer whitespace in subcomponents, qualification, and depot-level sustainment, helping prime contractors meet industrial participation thresholds while reducing import dependency. This shift is evident in SAMI moving the SAMI Land Industrial Complex in Riyadh into active production and unveiling the HEET armored vehicle program with full Saudi intellectual property at World Defense Show 2026, pointing to growing demand for locally engineered platforms, tooling, test services, and supplier development programs that can lift domestic content beyond assembly.
Air and missile defense and C2 software also represent an opportunity band where procurement scale and operational urgency support in-Kingdom capability build-out. In January 2026, SAMI Advanced Electronics and Lockheed Martin opened a software factory in Riyadh to localize command-and-control software development, while the United States approved a potential USD 9.0 billion FMS for 730 PAC-3 MSE missiles, which reinforces the need for local repair, test, spares management, and systems integration capacity across the integrated air and missile defense stack.
Recent Industry Developments
- February 2026: SAMI signed 25 strategic agreements during World Defense Show 2026 to expand technology transfer, strengthen supplier development, accelerate defense localization, and enhance partnerships with global and domestic defense companies supporting Vision 2030 objectives.
- February 2026: The newly launched SAMI Autonomous Company announced its plans to develop unmanned systems, robotics, and autonomous defense technologies, supporting the KSA's long-term strategy for advanced defense innovation and next-generation battlefield capabilities.
- February 2026: Lockheed Martin Corporation partnered with Pioneers Technical Systems to establish Saudi Arabia's first PAC-3 IAMD ground depot for testing, repair, certification, and lifecycle support of Patriot launcher components.
- February 2026: Leonardo S.p.A. secured a contract to supply four C-27J MPA to the Saudi MoD, enhancing maritime surveillance, ISR, SAR, and coastal security capabilities. Deliveries are scheduled to begin in 2029.


Research Methodology Framework and Report Scope
Market Definition and Coverage
For this study, the market is defined as Saudi Arabia's spending on defense capabilities that are procured, fielded, and upgraded for national security, covering major equipment and related modernization programs across the defense forces.
Scope exclusions: We exclude purely civilian security spending and non-defense public safety procurement that is not tied to military capability build-out.
Segmentation Overview
- By Armed Forces
- Air Force
- Army
- Navy
- By Type
- Soldier Systems
- Sensors
- C4ISR and Tactical Communications
- Military Platforms
- Weapons and Ammunition
- Unmanned Systems
- Electronic and Cyber Warfare Systems
- Military MRO
- Personal Training and Simulation
- Military Infrastructure
- By Domain
- Land
- Air
- Naval
- Space
- By Procurement Nature
- Indigenous Production
- Foreign Procurement
Data Sources, Market Sizing, and Validation
Desk Research
We start by mapping the demand context using public defense budget releases and procurement disclosures from Saudi government portals, then we compare them with global benchmark datasets such as SIPRI, IMF macro series, and World Bank indicators to anchor affordability and timing. When import dependence is relevant, we check trade statistics from sources such as UN Comtrade, using customs-aligned HS categories, to understand equipment inflows and how categories move over time.
To make the model practical, we also review defense policy notes and budget annexes in the format used for parliamentary releases where available, alongside publications from sector bodies and reputable press to capture program milestones and delivery timing. Company filings, investor presentations, and contract announcements are used to confirm which capability areas are being funded. A paid subscription for company financials and news intelligence is used selectively to cross-check major program values and schedule changes. The desk sources listed here are illustrative only, and we used many other public references during the research process for data collection, validation, and clarification.
Primary Interviews and Surveys
Primary work was used to pressure-test procurement assumptions and to confirm what is counted as defense market value versus adjacent areas like internal security or civilian aerospace. We spoke with a mix of program experts, distributors, integrators, and former procurement and operations professionals, and we kept respondent coverage balanced across the main buying arms and across the country-level demand environment.
Respondents helped us validate capability priorities, typical upgrade cycles, delivery phasing, and how indigenous production and foreign procurement are accounted for in practice, which then tightened the final sizing and forecast assumptions.
Distribution of primary research fieldwork respondents
| Company type | Respondent position |
|---|---|
| Top tier: 27% | CXOs: 14% |
| Mid tier: 52% | Functional/Unit leaders: 35% |
| Smaller Players: 21% | Managers: 51% |
Market-Sizing & Forecasting
Sizing starts with a top-down reconstruction that ties Saudi defense outlays and modernization priorities to category-level demand, then converts that demand into annual market value by applying realistic allocation shares and timing lags. In parallel, we run selective bottom-up approximations using sampled program values, channel checks, and equipment-level price and volume logic, which we use to validate totals and adjust for over-counting.
Inputs used in the model include defense budget direction and execution signals, the procurement mix between indigenous production and foreign procurement, delivery schedules for major platforms, upgrade and maintenance cycles, and the pacing of C4ISR, electronic warfare, and unmanned system adoption. We also track space and cyber program momentum through policy targets and funding signals, because these can shift the value mix even when total spending grows steadily.
For forecasting, scenario analysis is applied around budget sensitivity and program slippage, then a simple multivariate regression is used as a cross-check using macro drivers like GDP trends and oil-linked fiscal space, alongside defense policy priorities confirmed in interviews. Where bottom-up evidence is incomplete for smaller programs, gaps are handled through conservative allocation rules and timing spreads, which are reviewed with experts before finalizing the year-by-year series.
Data Validation & Update Cycle
Validation is done through triangulation across budget signals, program timelines, and independent demand indicators, followed by variance checks at category level so that one large platform does not distort the full market. When a large mismatch appears, the underlying assumption is reopened, and the research team re-contacts sources to confirm whether the issue is timing, scope, or price normalization.
Before sign-off, the model and logic go through multi-step internal reviews, including a final consistency pass on currency conversion timing and year alignment. The report is refreshed annually, and interim updates are made when material events occur, such as major contract awards, delivery delays, or defense budget revisions. Right before delivery, an analyst performs a fresh pass so clients receive the latest updated view.
Mordor Intelligence's Saudi Arabia Defense Market Size Compared With Other Published Estimates
Published numbers for Saudi Arabia defense can look far apart even when the growth story sounds similar, because different studies count different spending buckets and also anchor their base year to different budget cycles. The table helps show how much the chosen scope and timing choices can move the headline value.
The table shows a wide spread that largely comes from what is treated as defense market value, and under Mordor Intelligence's scope the total focuses on defense procurement and modernization categories across forces (including domains like space and cyber) rather than full military expenditure style totals that can bundle broader operating and security items. Additional gaps come from how indigenous production is netted versus grossed up, how upgrades are phased across years, and whether currency conversion uses a fixed average rate or a point-in-time rate tied to budget publication.
Benchmark comparison
| Source | Market Size | Gaps in Research Methodology |
|---|---|---|
| Mordor Intelligence | USD 20.26 B (2025) | |
| Industry Consultancy A | USD 43.50 B (2024) | Often aligns closer to broader defense spend style accounting, which can include wider operating and security-related outlays, and it uses a different base year that may capture a higher budget cycle level. |
| Trade Publisher B | USD 15.87 B (2024) | May narrow the scope toward equipment-centric demand only, which can understate upgrades and newer domains, and it can smooth procurement timing in a way that shifts value away from near-term years. |
Putting the figures side by side makes the drivers easier to see, because year choice, scope boundaries, and timing of major programs explain most of the gap. By keeping assumptions tied to observable budget and program signals, and then re-checking them with interview inputs, the resulting estimate stays traceable and repeatable for planning.


Key Questions Answered in the Report
What is the forecast value of the Saudi Arabia defense market in 2031?
The Saudi Arabia defense market is projected to reach USD 33.32 billion by 2031, reflecting a 6.09% CAGR over 2026-2031.
Which military branch is growing fastest in Saudi Arabia?
The Air Force leads growth at a 6.65% CAGR through 2031 because of fighter jet programs.
How is Vision 2030 affecting defense procurement?
Vision 2030 mandates at least 50% local content, so every major contract now embeds technology transfer and joint manufacturing requirements.
What role does Neo Space Group play in Saudi defense?
Neo Space Group drives space-based ISR projects that will reduce dependence on foreign intelligence and support precision targeting.
How vulnerable is Saudi defense budgeting to oil-price swings?
Defense outlays are ring-fenced, yet oil volatility pressures long-lead programs, prompting a shift toward modular, incrementally funded upgrades.
Which is the fastest growing sub-segment by type?
Sensors segment will showcase remarkable growth with a CAGR of 6.62% during 2026-2031 due to rising demand for advanced military radars and sensors.
Page last updated on:


 Your data is secure and never sold or shared.


