Aerial Imaging Market Size and Share
Market Overview
| Study Period | 2020 - 2031 |
|---|---|
| Market Size (2026) | USD 3.95 Billion |
| Market Size (2031) | USD 16.62 Billion |
| Growth Rate (2026 - 2031) | 33.29% CAGR |
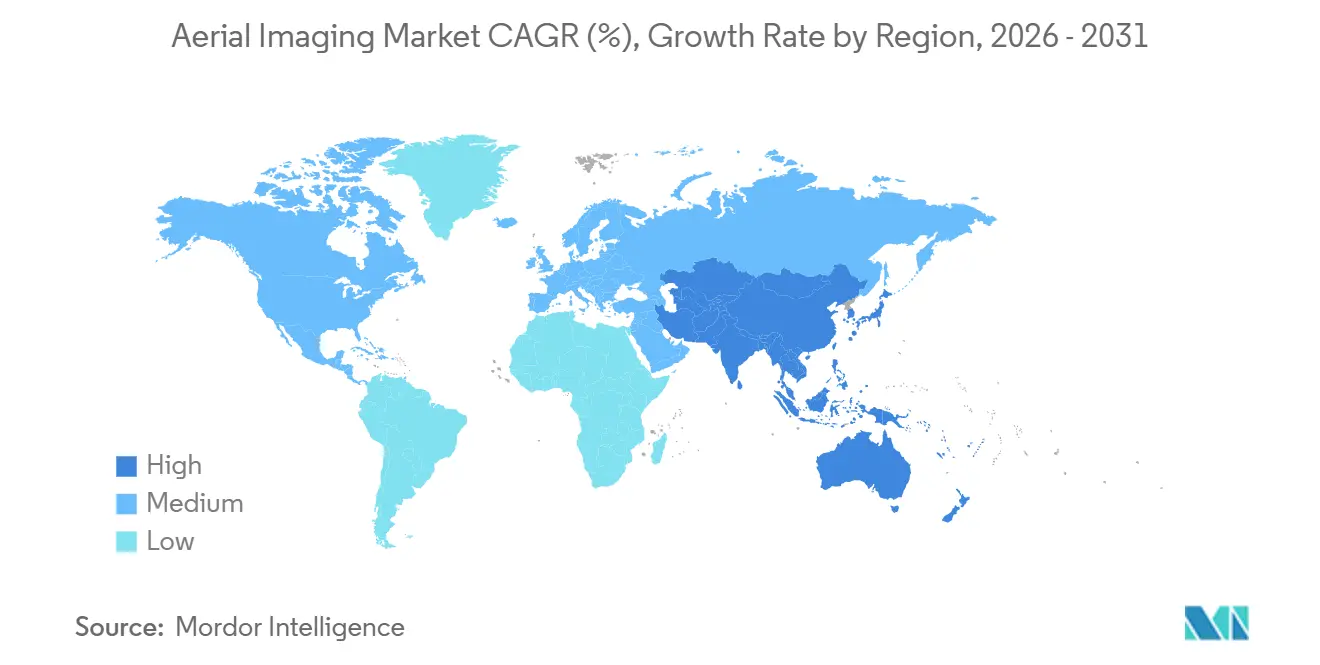
| Fastest Growing Market | Asia Pacific |
| Largest Market | North America |
| Market Concentration | Medium |
Major Players *Disclaimer: Major Players sorted in no particular order Image © Mordor Intelligence. Reuse requires attribution under CC BY 4.0. | |
Aerial Imaging Market Analysis by Mordor Intelligence
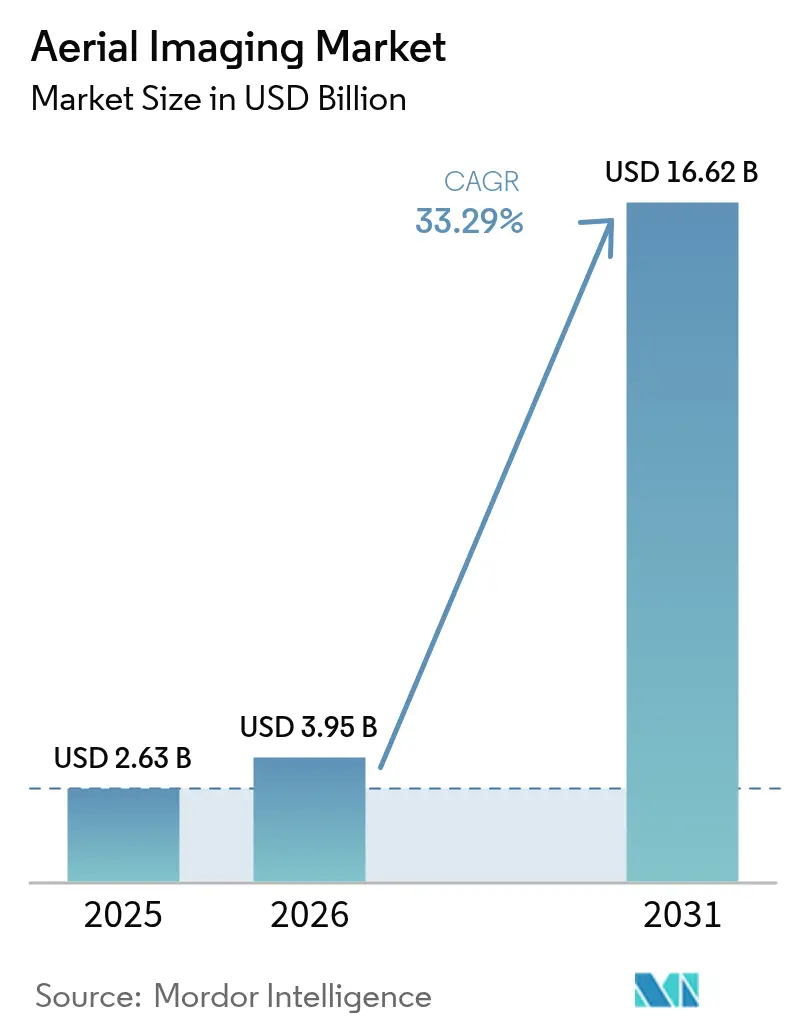
The aerial imaging market size is projected to expand from USD 2.63 billion in 2025, USD 3.95 billion in 2026, and reach USD 16.62 billion by 2031, registering a 33.29% CAGR over 2026-2031. Early adoption obligations for sub-10-centimeter geodata, hybrid-VTOL platforms that solve the range-payload dilemma, and on-device AI chips that shrink processing cycles now frame the sector’s structural trajectory. Government digital-twin programs, energy-sector inspection demand, and subscription-library moats sustained growth in 2025, while on-demand tasking and LiDAR workflows accelerated as turnaround speed and canopy penetration became decisive purchase criteria. Competition from low-earth-orbit constellations is reshaping value propositions, yet aerial operators still own the sub-decimetre and oblique-angle niches. Hybrid-VTOL certifications, declining multirotor hardware costs, and real-time 5G streaming carved new opportunities for small providers. Meanwhile, varying privacy statutes, fragmented flight-approval regimes, and cyber-liability coverage requirements tempered margin expansion even as volume skyrocketed.
Key Report Takeaways
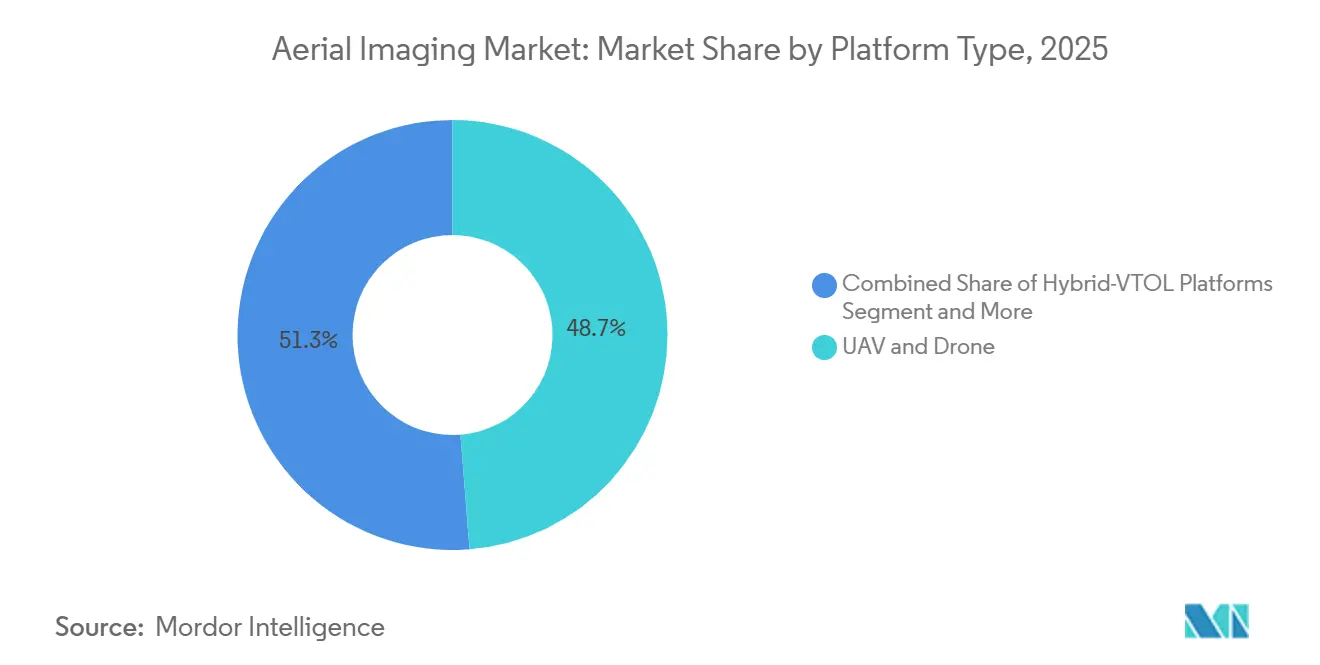
- By platform type, UAVs and drones led with 48.74% revenue share in 2025; hybrid-VTOL platforms are projected to advance at a 33.91% CAGR through 2031.
- By imaging technique, LiDAR commanded 33.78% growth through 2031, outpacing vertical imaging’s 2025 incumbent share of 42.49%
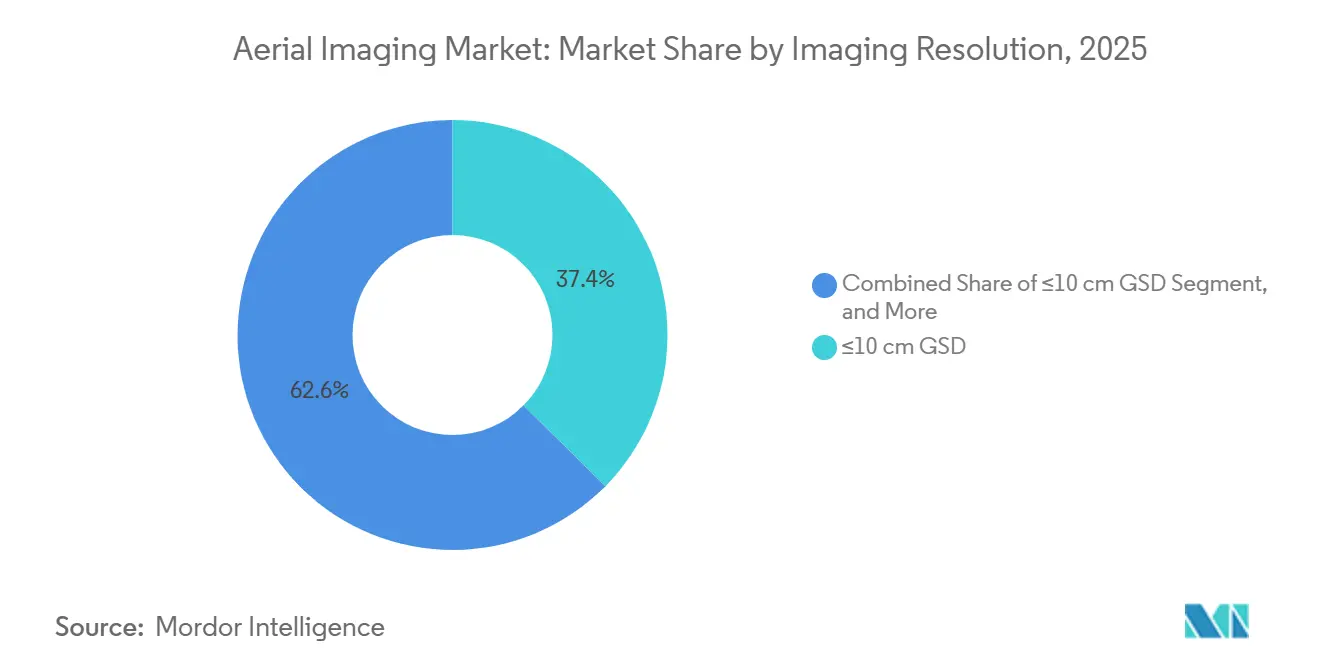
- By imaging resolution, ≤10 centimeter captures seized 37.41% of revenue in 2025 and are forecast to rise at a 34.22% CAGR to 2031.
- By delivery mode, subscription libraries accounted for 53.94% share of the aerial imaging market size in 2025, while on-demand tasking is expanding at a 34.55% CAGR over 2026-2031.
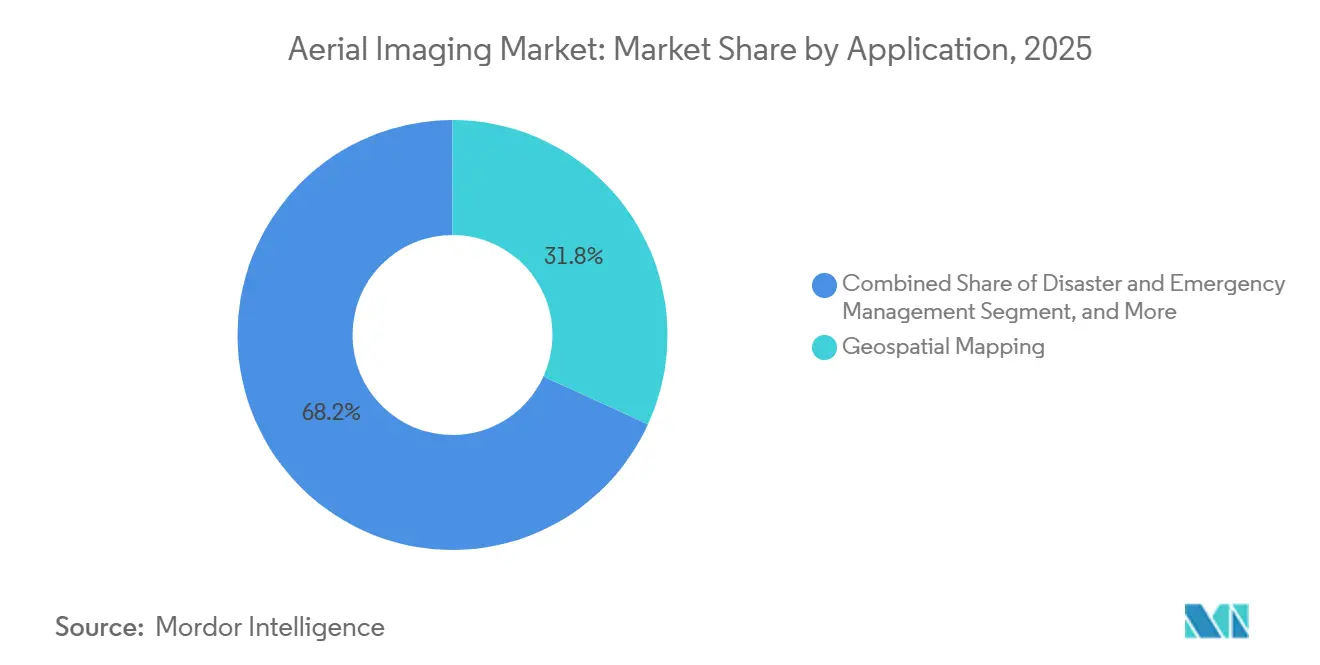
- By application, geospatial mapping held 31.82% of 2025 revenue, whereas disaster and emergency management is advancing at a 34.37% CAGR through 2031.
- By end-user, the energy, power and utilities segment is forecast to post the fastest 34.61% CAGR during 2026-2031, while government and public agencies retained 33.73% share in 2025.
Note: Market size and forecast figures in this report are generated using Mordor Intelligence’s proprietary estimation framework, updated with the latest available data and insights as of 2026.
Global Aerial Imaging Market Trends and Insights
Drivers Impact Analysis*
| Driver | (~) % Impact on CAGR Forecast | Geographic Relevance | Impact Timeline |
|---|---|---|---|
| AI-Augmented Image Analytics Reducing Processing Time | +6.80% | Global, with early adoption in North America and Europe | Short term (≤ 2 years) |
| Proliferation of Location-Based Services, 5G and IoT Ecosystems | +6.20% | Global, accelerated in Asia-Pacific urban corridors | Medium term (2-4 years) |
| Growth in Smart-City and Infrastructure Digital-Twin Projects | +5.90% | Asia-Pacific core, spillover to Middle East | Medium term (2-4 years) |
| Rapid Adoption of UAVs and Drones for Low-Cost Data Capture | +5.40% | Global, particularly South America and Africa for agriculture | Short term (≤ 2 years) |
| Demand for High-Resolution Geodata to Train Autonomous-Vehicle Stacks | +4.70% | North America and Europe, emerging in China | Long term (≥ 4 years) |
| Agricultural Demand for Crop-Health Multispectral Imaging | +4.30% | Global, concentrated in Brazil, India, United States | Medium term (2-4 years) |
| Source: Mordor Intelligence | |||


AI-Augmented Image Analytics Reducing Processing Time
On-device neural accelerators now execute photogrammetry, segmentation, and defect-detection models during flight, collapsing delivery cycles from days to minutes. Operators embed the chips in gimbals and edge boxes weighing under 500 grams, enabling real-time orthomosaic assembly while airframes return to base. North American energy utilities began issuing service-level agreements that stipulate same-day line-fault detection, a requirement unattainable with cloud-only workflows. The processing shift slashed bandwidth costs by 55% because only finished vector layers, not raw imagery, reach the cloud. Smaller regional firms therefore compete on insight latency rather than fleet size. In Europe, GDPR-compliant edge redaction removes license plates and faces before storage, trimming post-processing expense and privacy risk.[1]Singapore Land Authority, “Virtual Singapore Platform Update,” sla.gov.sg
Proliferation of Location-Based Services, 5G and IoT Ecosystems
Standalone 5G deployments deliver sub-10 millisecond uplink latency that allows drones to stream 4K video directly into municipal traffic dashboards. Seoul and Tokyo reached 95% urban 5G coverage by late 2025, turning real-time aerial feeds into routine data layers for congestion management. IoT payloads synchronize gimbal angle, barometric pressure, and IMU data, letting automated software stitch sub-5-centimeter orthomosaics without ground-control points. Logistics firms overlay the live maps with driver GPS to fine-tune last-mile routing. Streaming workflows substitute capital-heavy local processing farms with network capacity, further democratizing entry for cash-light startups. Asia-Pacific corridors therefore exhibit the steepest ramp in tasking volume per square kilometer.
Growth in Smart-City and Infrastructure Digital-Twin Projects
Governments allocated more than USD 18 billion to digital-twin procurements in 2025, embedding quarterly UAV LiDAR refreshes into procurement guidelines. Singapore’s Virtual Singapore platform relies on 3D meshes updated every three months, enabling planners to simulate solar gain and urban heat-island effects before approving permits. The European Union earmarked EUR 1.2 billion (USD 1.28 billion) for cross-border twin interoperability, mandating sub-20-centimeter horizontal accuracy that favours aerial imaging over satellites at city scale. Infrastructure concessionaires integrate annual aerial surveys into maintenance contracts to track pavement degradation and unauthorized encroachments. Recurring datasets convert once-off survey revenue into subscription-like cash flows, raising valuation multiples across providers.
Rapid Adoption of UAVs and Drones for Low-Cost Data Capture
Enterprise quadcopters with thermal and multispectral payloads now retail below USD 15 000, 40% lower than 2024 pricing. The FAA had issued 385 000 Part 107 certificates by December 2025, reflecting surging in-house adoption by construction and agriculture clients. Lithium-polymer energy density rose to 280 Wh kg⁻¹, pushing endurance to 45 minutes and enabling 150-hectare single sorties without battery swaps. Regulatory easing, such as the FAA rule on flights over moving vehicles, unlocked roadside inspection and live-event security. Open-source flight-planning tools paired with cloud photogrammetry lowered skill barriers, letting non-specialists generate ortho-ready mosaics hours after capture.
Restraints Impact Analysis*
| Restraint | (~) % Impact on CAGR Forecast | Geographic Relevance | Impact Timeline |
|---|---|---|---|
| Fragmented Global and Local Air-Regulation Regimes | -3.20% | Global, acute in Europe and Asia-Pacific | Medium term (2-4 years) |
| Rising Data-Privacy and Surveillance-Use Lawsuits | -2.80% | Europe and North America, emerging in Asia-Pacific | Short term (≤ 2 years) |
| Cyber-Attacks on Aerial Imaging Data-Streams | -1.90% | Global, concentrated in critical infrastructure sectors | Short term (≤ 2 years) |
| Competition from Low-Orbit Constellation Satellites | -1.60% | Global, particularly impacting subscription-library models | Long term (≥ 4 years) |
| Source: Mordor Intelligence | |||
Fragmented Global and Local Air-Regulation Regimes
Waiver processes differ widely: FAA approvals averaged 90 days in 2025, while European Union Aviation Safety Agency specific-category authorizations demanded 14 technical annexes and external conformity audits that extended timelines up to nine months. India bars flights within 3 kilometers of borders and military sites, excluding 18% of its landmass without case-by-case clearance. Such divergence forces operators to field jurisdiction-specific compliance teams and maintain multiple fleet configurations, eroding economies of scale. Multi-national clients now split tenders by country, raising bidding overhead and fragmenting revenue streams.
Rising Data-Privacy and Surveillance-Use Lawsuits
A 2025 California class action claimed oblique imagery captured biometric data without consent, invoking the California Consumer Privacy Act. In March 2025 the European Court of Justice ruled that aerial shots containing license plates constitute personal data under GDPR. Real-time anonymization software that blurs faces and plates in 4K at 30 fps costs USD 50 000-120 000, an outlay many small providers cannot absorb. Insurers also raised minimum cyber-liability coverage to USD 5 million for operators handling personally identifiable information, increasing premiums by up to 12% and curbing entry into urban-surveillance projects.
*Our forecasts treat driver/restraint impacts as directional, not additive. The impact forecasts reflect baseline growth, mix effects, and variable interactions.
Segment Analysis
By Platform Type: Hybrid-VTOL Platforms Reshape Range Economics
Hybrid-VTOL systems are forecast to grow at a 33.91% CAGR through 2031, surpassing the aerial imaging market average as utilities embrace rotary-wing take-off paired with fixed-wing cruise for 150-kilometer corridors. UAVs and drones retained 48.74% of 2025 revenue because sub-50-hectare mapping remains their sweet spot. Fixed-wing aircraft still dominate 300-square-kilometer cadastral sorties where hour-plus endurance justifies mobilization costs. Helicopters persist for offshore rigs and alpine LiDAR, tasks that require pilot judgment under instrument flight rules. Hybrid-VTOL adoption accelerated after multiple jurisdictions granted type certifications in late 2025, reducing insurance surcharges and enabling single-operator coverage of 800-kilometer pipelines that once mandated multi-day helicopter campaigns.
Improved tiltrotor designs now deliver 120-minute endurance with 8-kilogram payloads, aligning with high-spec LiDAR weight classes and supporting automated defect detection at 2-centimeter point density. Accordingly, utilities are embedding hybrid-VTOL budgets into asset-integrity programs, a trend expected to lift the aerial imaging market share of the segment beyond 25% by 2031.


By Imaging Technique: LiDAR Gains Traction in Canopy-Penetration Workflows
LiDAR, projected at a 33.78% growth clip, is displacing photogrammetry where dense canopy obscures terrain or where sub-5-centimeter elevation accuracy dictates volumetric billing. The aerial imaging market size for LiDAR workflows expanded after 2024 solid-state sensors arrived at sub-USD 30 000 price points and weighed under 1.5 kilograms, enabling integration on 10-kilogram UAVs. Forestry concessions in Canada and Scandinavia rely on LiDAR to derive basal-area indices beneath conifer crowns, a task traditional orthophotos cannot meet. Vertical nadir captures still held 42.49% of 2025 revenue, favoured in agriculture and cadastral mapping.
Oblique imagery grew inside insurance underwriting and 3D city-model texturing as façades joined structural-integrity checks. Multispectral, hyperspectral, and thermal modalities found traction in crop diagnosis, environmental monitoring, and solar-panel inspection, yet adoption lags due to sensor costs and analytic complexity. Providers that bundle LiDAR scanners with AI terrain-classification pipelines now command premium day-rates, illustrating how sensor-fusion elevates deliverable value.
By Imaging Resolution: Ultra-High Resolution Fuels Digital-Twin Precision
Sub-10-centimeter ground-sample distance images held 37.41% of 2025 revenue and will grow at 34.22% through 2031 because municipal twins and autonomous-vehicle maps need decimeter accuracy. Sensors topping 50 megapixels mounted on stabilized gimbals keep pixel blur under control at legal 120-meter altitudes, letting operators satisfy tender specifications without waiver delays. The 11–25-centimeter tier remained viable for watershed modelling and county-scale agriculture where file-size savings eclipse detail loss.
The 26–50-centimeter bracket enabled nationwide land-cover projects at costs under USD 8 000 per 500 square kilometers. Imagery coarser than 50 centimeters serves rapid reconnaissance during disaster response when speed outranks granularity. Public-works agencies now stipulate crack-width detection thresholds in tenders, effectively locking in ≤10 centimeter resolution for pavement and bridge monitoring. This mandate pulls downstream data-storage and processing demand, further reinforcing high-resolution capture economics.
By Delivery Mode: On-Demand Tasking Gains Momentum in Time-Sensitive Verticals
On-demand tasking is advancing at a 34.55% CAGR to 2031, chipping away at subscription-library dominance as insurers and contractors call for sub-24-hour capture windows. The aerial imaging market share of subscription libraries stood at 53.94% in 2025 because real-estate portals and cadastral agencies value predictable refresh cycles. Price gaps narrowed when operators automated flight planning and leveraged idle capacity; on-demand cost per square kilometre fell 28% in 2025. Hybrid models emerged, granting subscribers priority windows at marginal-cost rates, effectively blending recurring and transactional revenue.
API-first platforms now let clients ingest feasibility checks and finished orthomosaics into enterprise systems without human coordination, shrinking order-to-delivery cycles from weeks to hours. This self-serve convenience particularly resonates with companies that have episodic but critical imagery needs, such as legal discovery and event management.
By Application: Disaster Management Surges on Climate-Event Frequency
Disaster and emergency management is forecast to climb 34.37% through 2031, reflecting the rising number and severity of climate-related incidents. Real-time oblique and thermal feeds integrated into incident-command dashboards proved decisive during 2025 U.S. wildfire seasons and Asia-Pacific typhoon responses. Geospatial mapping retained 31.82% share in 2025 owing to cadastral and corridor survey mandates.
Infrastructure planning and asset inspection applications linked directly to digital-twin initiatives also expanded. Environmental and forestry programs turned to aerial imaging for carbon-offset verification as ESG reporting tightened. Agriculture and precision farming remained stable, but price pressure forced service providers to bundle agronomic insights rather than sell raw geodata. Insurance adopted mandatory aerial surveys for every commercial claim above USD 500 000, making the workflow commonplace rather than exceptional.
By End-User Industry: Energy Sector Leads Vertical Growth
Energy, power and utilities customers will register a 34.61% CAGR through 2031. Aging grids and renewable-generation buildouts drive demand for automated thermal and visual inspection of conductors, insulators, and photovoltaic panels. Government and public agencies held 33.73% of revenue in 2025 thanks to sustained cadastral, transportation, and emergency-response budgets.
Construction and real-estate buyers expanded usage for progress verification and volumetric earthwork, while oil and gas turned to aerial LiDAR for pipeline integrity despite capital-spending caution linked to transition policies. Defense and homeland security purchases continued but faced 18-24-month procurement cycles tied to encryption mandates. Mining operations deployed LiDAR stockpile surveys to align physical and financial inventories, integrating outputs with ERP modules to cut write-off risk.
Geography Analysis
North America generated 34.22% of 2025 revenue. FAA Remote ID enforcement accelerated fleet upgrades, while Department of Defense counter-UAS spending underpinned long-endurance platform demand. Canada’s Arctic mapping and indigenous land-claim surveys generated steady LiDAR contract flow, and Mexico earmarked USD 4.2 billion through 2027 for highway digital twins requiring annual aerial refresh. A dense cluster of autonomous-vehicle developers funded sub-10 centimeter road-network captures, awarding contracts exceeding USD 150 million in 2025 alone.
Asia-Pacific is forecast to grow at 34.24% over 2026-2031, the fastest regional outlook. China invests more than USD 12 billion annually in smart-city twins, India scaled digital-twin oversight for highways and metros, and Japan mandated annual LiDAR flood-risk surveys across 15 000 square kilometers of coastal plains after 2024 typhoon losses. South Korea’s average of 18 5G base stations per square kilometer in Seoul enables live 4K aerial streaming for traffic management. Australia’s mining majors integrated quarterly aerial volumetrics for International Financial Reporting Standards compliance. Regional regulatory heterogeneity favours domestic incumbents, inhibiting one-size-fits-all service models.
Europe maintained steady expansion through EU Digital Europe funding and biodiversity reporting tied to the EU Taxonomy. The United Kingdom cut BVLOS approval times from nine months to 12 weeks, letting utilities cover 22 000 kilometers of transmission lines with automated drones. Germany emphasized renewable-asset thermal inspections, while France budgeted EUR 40 million (USD 42.8 million) annually for sub-15 centimeter rural orthophotos. GDPR-driven anonymization raises processing costs, especially in urban surveillance, dampening margins relative to laxer jurisdictions.
South America, the Middle East, and Africa each contribute smaller bases but show targeted acceleration: Brazilian growers saved USD 85 per hectare using multispectral imaging for nitrogen optimization, Saudi Arabia’s NEOM project demands continuous aerial feeds for its linear city blueprint, and South African miners outsourced LiDAR stockpile management to avoid CAPEX on ground scanners.[2]Directorate General of Civil Aviation India, “Drone Operator Permits Statistics,” dgca.gov.in

Competitive Landscape
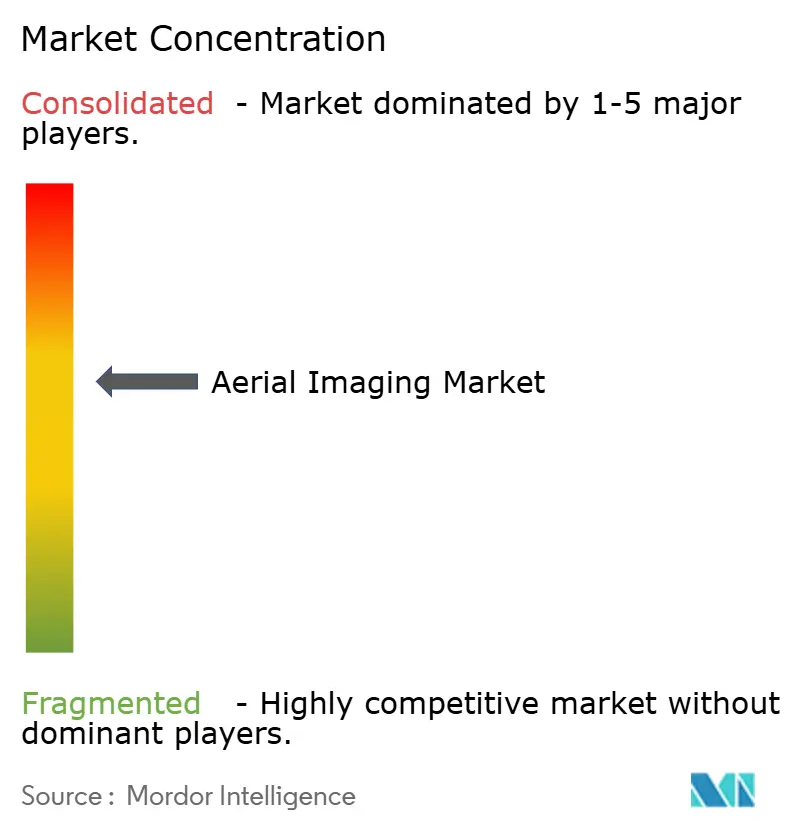
The aerial imaging sector is moderately fragmented. Incumbents such as Nearmap, EagleView, and Maxar defend subscription libraries with proprietary capture fleets and multi-year agency contracts. Drone-native platforms like DroneDeploy and Pix4D thrive in on-demand niches via API-first workflows that plug directly into client asset-management systems.
Hardware makers including DJI and senseFly bundle cloud subscriptions with airframe sales, whereas software-pure-plays focus on analytics and workflow automation. Planet Labs and ICEYE compress revisit intervals below 24 hours from low-earth orbit, challenging aerial incumbents on frequency but not on sub-decimeter resolution or oblique-angle flexibility. Edge-computing architectures under patent by Hexagon and Trimble process imagery aboard UAVs, slashing cloud bandwidth costs and enabling real-time quality assurance. Startups fusing aerial LiDAR with indoor mobile mapping now tackle campus-wide digital twins unreachable by single-modality providers.
Competitive intensity rose as patent filings in automated flight planning increased 35% during 2025, pushing operators toward either vertical specialization (agriculture, utilities, insurance) or deep regional regulatory mastery. Pricing pressure in commoditized agricultural scouting prompts a shift toward decision-support bundles that package analytics with risk-scoring dashboards, cementing client stickiness even as raw imagery commoditizes.[3]ASTM International, “Committee E57 3D Imaging Standards,” astm.org
Aerial Imaging Industry Leaders
Fugro Ltd
Nearmap Ltd
Eagle View Technologies Inc.
Trimble Inc.
Maxar Technologies Inc.
- *Disclaimer: Major Players sorted in no particular order

Recent Industry Developments
- May 2025: John Deere completed the the acquisition of Sentera, integrating drone-management software into Operations Center for real-time agronomic insights.
- April 2025: BRINC Drones raised USD 75 million Series C to scale solutions for first responders.
- March 2025: Sikorsky demonstrated rotor-blown-wing UAS achieving 86-knot cruise and 40 VTOL transitions.
- March 2025: Hexagon announced a EUR 1.45 billion spin-off of its Asset Lifecycle Intelligence business, focusing on SaaS asset-management solutions.


Global Aerial Imaging Market Report Scope
The Aerial Imaging Market Report is Segmented by Platform Type (Fixed-Wing Aircraft, Helicopters, UAVs/Drones, Hybrid-VTOL Platforms, Rest of Platform Type), Imaging Technique (Vertical Imaging, Oblique Imaging, Multispectral/Hyperspectral Imaging, LiDAR-Based Imaging, Thermal/IR Imaging), Imaging Resolution (≤10 cm GSD, 11-25 cm GSD, 26-50 cm GSD, >50 cm GSD), Delivery Mode (On-Demand Tasking, Subscription Libraries), Application (Geospatial Mapping and Land Survey, Infrastructure and Urban Planning, Asset Inventory and Inspection, Environmental and Forestry Monitoring, Disaster and Emergency Management, Security/Surveillance/Defense, Agriculture and Precision Farming, Insurance Underwriting and Claims, Media and Entertainment), End-User Industry (Government and Public Agencies, Construction and Real-Estate, Energy/Power/Utilities, Oil and Gas, Agriculture and Forestry, Defense and Homeland Security, Insurance, Mining and Quarrying, Rest of End-User Industry), and Geography (North America, South America, Europe, Asia-Pacific, Middle East, Africa). The Market Forecasts are Provided in Terms of Value (USD).
| Fixed-Wing Aircraft |
| Helicopters |
| UAVs / Drones |
| Hybrid-VTOL Platforms |
| Rest of Platform Type |
| Vertical (Nadir) Imaging |
| Oblique Imaging |
| Multispectral / Hyperspectral Imaging |
| LiDAR-Based Imaging |
| Thermal / IR Imaging |
| ≤10 cm GSD |
| 11-25 cm GSD |
| 26-50 cm GSD |
| More than 50 cm GSD |
| On-Demand Tasking |
| Subscription Libraries |
| Geospatial Mapping and Land Survey |
| Infrastructure and Urban Planning |
| Asset Inventory and Inspection |
| Environmental and Forestry Monitoring |
| Disaster and Emergency Management |
| Security, Surveillance and Defense |
| Agriculture and Precision Farming |
| Insurance Underwriting and Claims |
| Media and Entertainment |
| Government and Public Agencies |
| Construction and Real-Estate |
| Energy, Power and Utilities |
| Oil and Gas |
| Agriculture and Forestry |
| Defense and Homeland Security |
| Insurance |
| Mining and Quarrying |
| Rest of End-User Industry |
| North America | United States |
| Canada | |
| Mexico | |
| South America | Brazil |
| Argentina | |
| Rest of South America | |
| Europe | United Kingdom |
| Germany | |
| France | |
| Italy | |
| Rest of Europe | |
| Asia-Pacific | China |
| Japan | |
| India | |
| South Korea | |
| Rest of Asia-Pacific | |
| Middle East | Israel |
| Saudi Arabia | |
| United Arab Emirates | |
| Turkey | |
| Rest of Middle East | |
| Africa | South Africa |
| Egypt | |
| Rest of Africa |
| By Platform Type | Fixed-Wing Aircraft | |
| Helicopters | ||
| UAVs / Drones | ||
| Hybrid-VTOL Platforms | ||
| Rest of Platform Type | ||
| By Imaging Technique | Vertical (Nadir) Imaging | |
| Oblique Imaging | ||
| Multispectral / Hyperspectral Imaging | ||
| LiDAR-Based Imaging | ||
| Thermal / IR Imaging | ||
| By Imaging Resolution | ≤10 cm GSD | |
| 11-25 cm GSD | ||
| 26-50 cm GSD | ||
| More than 50 cm GSD | ||
| By Delivery Mode | On-Demand Tasking | |
| Subscription Libraries | ||
| By Application | Geospatial Mapping and Land Survey | |
| Infrastructure and Urban Planning | ||
| Asset Inventory and Inspection | ||
| Environmental and Forestry Monitoring | ||
| Disaster and Emergency Management | ||
| Security, Surveillance and Defense | ||
| Agriculture and Precision Farming | ||
| Insurance Underwriting and Claims | ||
| Media and Entertainment | ||
| By End-User Industry | Government and Public Agencies | |
| Construction and Real-Estate | ||
| Energy, Power and Utilities | ||
| Oil and Gas | ||
| Agriculture and Forestry | ||
| Defense and Homeland Security | ||
| Insurance | ||
| Mining and Quarrying | ||
| Rest of End-User Industry | ||
| By Geography | North America | United States |
| Canada | ||
| Mexico | ||
| South America | Brazil | |
| Argentina | ||
| Rest of South America | ||
| Europe | United Kingdom | |
| Germany | ||
| France | ||
| Italy | ||
| Rest of Europe | ||
| Asia-Pacific | China | |
| Japan | ||
| India | ||
| South Korea | ||
| Rest of Asia-Pacific | ||
| Middle East | Israel | |
| Saudi Arabia | ||
| United Arab Emirates | ||
| Turkey | ||
| Rest of Middle East | ||
| Africa | South Africa | |
| Egypt | ||
| Rest of Africa | ||


Key Questions Answered in the Report
How fast is revenue expected to grow for aerial imaging providers through 2031?
The aerial imaging market is forecast to rise from USD 3.95 billion in 2026 to USD 16.62 billion in 2031, registering a 33.29% CAGR.
Which platform type will see the highest growth by 2031?
Hybrid-VTOL platforms are projected to expand at a 33.91% CAGR through 2031 as utilities favor their combined endurance and vertical-takeoff capability.
Why are ?10 centimeter ground-sample-distance images in demand?
Smart-city twins, autonomous-vehicle map training, and infrastructure crack detection stipulate sub-decimeter resolution, driving 34.22% CAGR for this tier.
What is driving LiDAR adoption in aerial workflows?
Solid-state LiDAR sensors under USD 30 000 and under 1.5 kilograms enable canopy penetration and volumetric accuracy, fueling 33.78% growth through 2031.
Which end-user industry is growing the fastest?
Energy, power and utilities customers are forecast to lead with a 34.61% CAGR thanks to automated thermal and visual inspections of aging grids and renewable assets.
How do regulatory differences affect cross-border drone operations?
Divergent BVLOS waiver processes and privacy statutes force operators to maintain country-specific compliance teams, adding cost and slowing multinational scale-ups.
Page last updated on:


