United Arab Emirates Data Center Server Market Size and Share
Market Overview
| Study Period | 2020 - 2031 |
|---|---|
| Forecast Data Period | 2026 - 2031 |
| Historical Data Period | 2020 - 2024 |
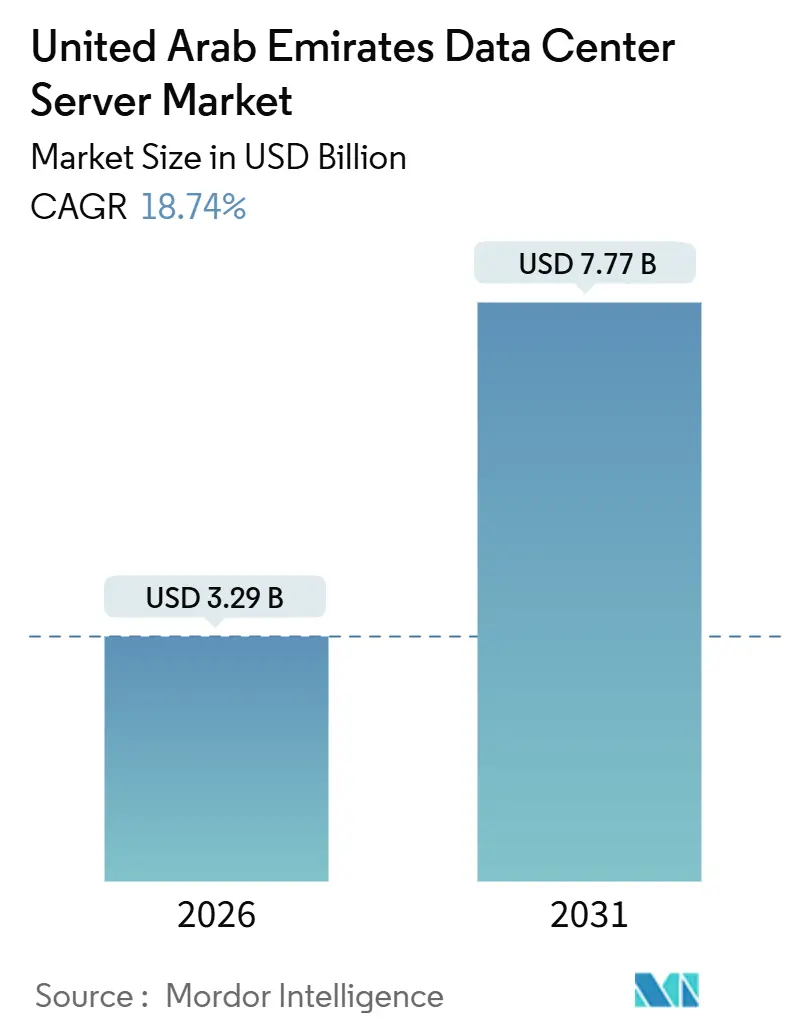
| Market Size (2026) | USD 3.29 Billion |
| Market Size (2031) | USD 7.77 Billion |
| Growth Rate (2026 - 2031) | 18.74% CAGR |
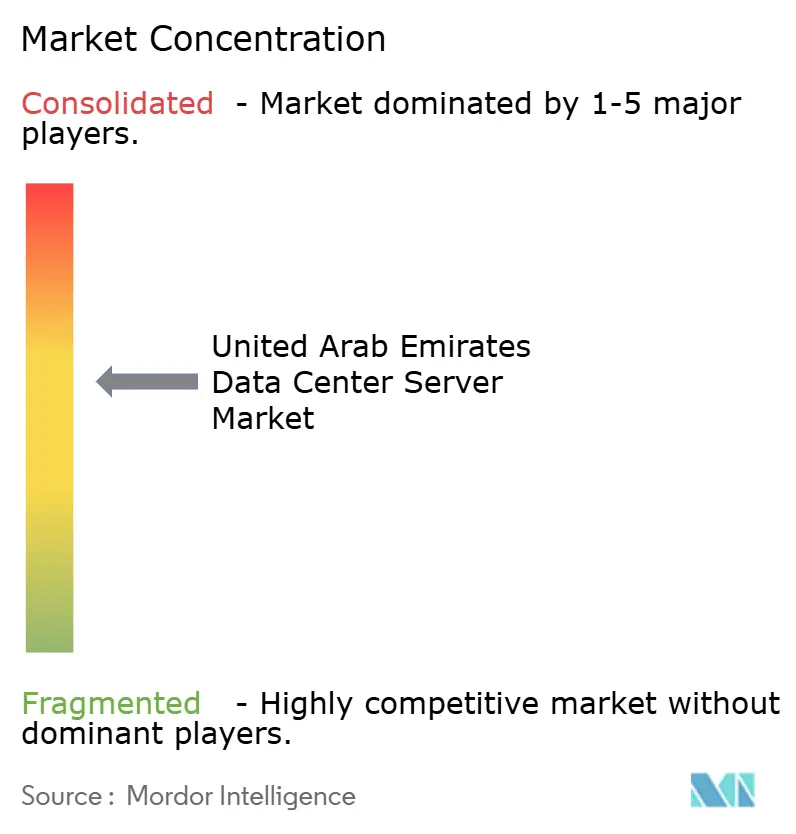
| Market Concentration | Medium |
Major Players *Disclaimer: Major Players sorted in no particular order Image © Mordor Intelligence. Reuse requires attribution under CC BY 4.0. | |
United Arab Emirates Data Center Server Market Analysis by Mordor Intelligence
The United Arab Emirates data center server market size is valued at USD 3.29 billion in 2026 and is projected to reach USD 7.77 billion by 2031, posting an 18.74% CAGR. Rising sovereign-AI ambitions, hyperscale capital inflows, and cloud-first regulations are reshaping buying cycles, pulling forward demand for GPU-dense servers and liquid-cooled racks. Abu Dhabi AI campuses create outsized pull for high-end accelerators, Dubai’s interconnection hub attracts multi-cloud traffic, and preferential green-energy tariffs inside free zones temper operating costs. Long server lead times and water-use caps add friction, yet operators continue to pre-contract capacity to secure export-controlled chips. Competitive dynamics stay fluid as global OEMs court Khazna, Microsoft-G42, and du, while local integrators monetize a three-tier supply chain that spans direct hyperscale contracts, colocation channel sales, and GPU-as-a-Service for enterprises.
Key Report Takeaways
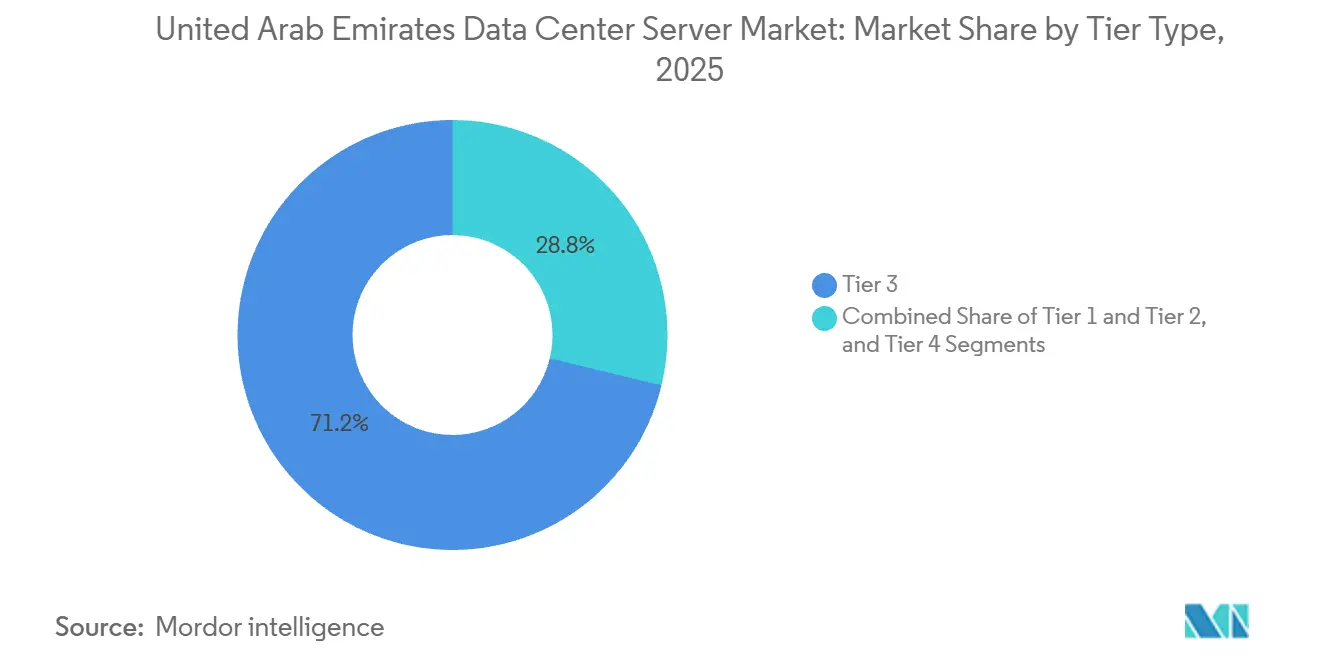
- By tier type, tier 3 led with 71.24% revenue share in 2025 while tier 4 is forecast to expand at a 19.54% CAGR through 2031.
- By data center size, large facilities held 41.77% of the United Arab Emirates data center server market share in 2025 and hyperscale campuses are projected to post a 19.38% CAGR to 2031.
- By data center type, colocation captured 56.87% revenue in 2025 whereas hyperscalers and CSPs are set to grow at a 19.91% CAGR during the same period.
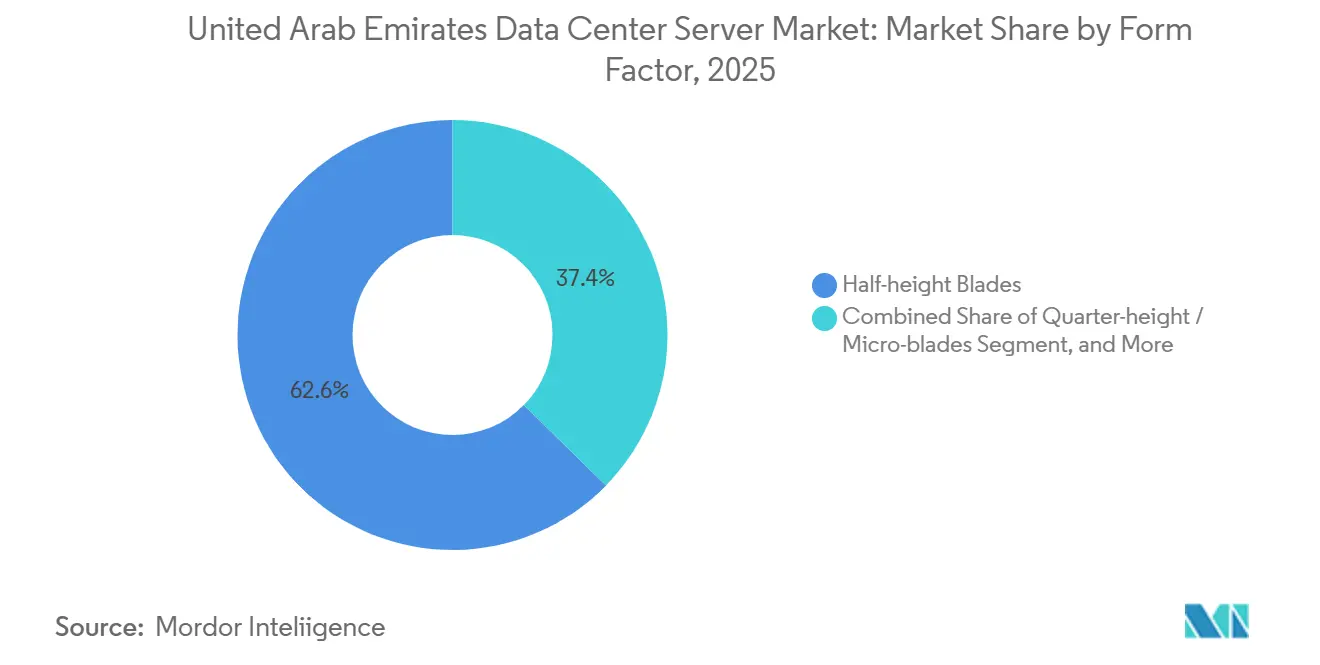
- By form factor, half-height blades retained 62.65% share in 2025 while quarter-height and micro-blades are poised to rise at 19.72% CAGR through 2031.
- By application, AI and ML workloads held 36.76% share in 2025, yet virtualization and private cloud will advance at a 19.83% CAGR to 2031.
Note: Market size and forecast figures in this report are generated using Mordor Intelligence’s proprietary estimation framework, updated with the latest available data and insights as of January 2026.
United Arab Emirates Data Center Server Market Trends and Insights
Drivers Impact Analysis*
| Driver | (~) % Impact on CAGR Forecast | Geographic Relevance | Impact Timeline |
|---|---|---|---|
| Abu Dhabi AI Compute Campuses Driving GPU Demand | +4.2% | Abu Dhabi core, spillover to Dubai | Medium term (2-4 years) |
| Hyperscaler and Colocation CAPEX Inflow | +3.8% | Global capital concentrated in Abu Dhabi and Dubai | Short term (≤ 2 years) |
| Government Cloud-First and Smart Nation Programs | +3.5% | Nationwide, early gains in Abu Dhabi, Dubai, Sharjah | Medium term (2-4 years) |
| Growing BFSI Digitalization | +2.9% | Dubai Financial District, Abu Dhabi Global Market | Short term (≤ 2 years) |
| Fiber-Optic Backbone Expansion | +2.1% | National, subsea landings in Fujairah | Long term (≥ 4 years) |
| Preferential Green-Energy Tariffs in Free Zones | +1.8% | Dubai Silicon Oasis, Masdar City, Khalifa Industrial Zone | Long term (≥ 4 years) |
| Source: Mordor Intelligence | |||
Abu Dhabi AI Compute Campuses Driving GPU Demand
G42’s Stargate UAE site will deliver 200 MW of AI-optimized capacity in 2026, anchoring a planned 5 GW complex that positions the emirate to train foundation models at unprecedented regional scale. MGX injected USD 1.5 billion in 2024, enabling Core42 to deploy NVIDIA H100 clusters that became publicly available the same year. In 2025 Oracle installed the first NVIDIA Blackwell supercluster inside its Abu Dhabi region, accelerating sovereign-AI timelines. Export-control diplomacy now shapes silicon distribution, as the United States cleared G42 to import 35,000 Blackwell GB300 GPUs in November 2025, outstripping many European allocations. Procurement therefore tracks model-training milestones rather than routine refresh cycles, creating lumpy but massive server orders.
Hyperscaler and Colocation CAPEX Inflow
Microsoft and G42 committed to a 200 MW expansion via Khazna in 2025, part of a wider USD 15.2 billion plan that will double sovereign-cloud capacity by 2029. du and Microsoft separately formed a joint venture to build a AED 2 billion (USD 544.9 million) hyperscale campus in Dubai, highlighting high-level state support. Khazna secured USD 2.62 billion in project financing for three additional sites in March 2025, illustrating a new normal in multi-billion-dollar data-center deals. Hyperscalers also view the UAE as a regulatory bridge between EU data rules and Asian latency demands, routing traffic through Dubai’s 15-millisecond path to Mumbai.
Government Cloud-First and Smart Nation Programs
Abu Dhabi’s Digital Strategy 2025-2027 earmarked AED 13 billion (USD 3.54 billion) to migrate 80% of public services to sovereign or hybrid clouds by 2027. Federal directives require ministries to default to cloud-native designs, shifting server demand toward hyper-converged clusters hosted in Tier 3 or higher sites. Dubai’s Universal Blueprint for Artificial Intelligence aims for a global top-10 AI ranking by 2031, spurring GPU-rich procurements for real-time inference across smart-city services. Open Finance rules issued by the Central Bank in 2024 oblige banks to expose APIs, pushing them toward low-latency API-gateway servers inside colocation halls. As sprint-style digital projects proliferate, vendors juggle legacy three-year refresh schedules alongside 12-month cloud-migration waves.
Growing BFSI Digitalization
Emirates NBD migrated core banking to a hybrid stack, boosting server density 40% and slashing per-transaction power by 18% in 2024. Abu Dhabi Global Market hosted 47 fintechs in 2025, each demanding sub-10-millisecond access to payment rails that favor Tier 3 or Tier 4 colocation. Dubai International Financial Centre reported 68% cloud adoption by regulated entities in 2024, shifting purchases from proprietary Unix boxes toward container-ready x86 clusters. Storage-centric servers with NVMe drives capable of 1 million IOPS now dominate BFSI specs, benefiting vendors with validated storage nodes. Redundant server pairs across geographically split sites satisfy updated Stored Value Facilities rules, effectively doubling per-customer footprints.
Restraints Impact Analysis*
| Restraint | (~) % Impact on CAGR Forecast | Geographic Relevance | Impact Timeline |
|---|---|---|---|
| Export-Control Scrutiny on Advanced Chips | -2.7% | Nationwide, most acute in Abu Dhabi AI projects | Short term (≤ 2 years) |
| High Upfront CAPEX and Supply-Chain Bottlenecks | -2.3% | Global, sharpest for hyperscale and Tier 4 builds | Medium term (2-4 years) |
| Escalating Data-Security Breaches | -1.6% | National, BFSI and government verticals | Short term (≤ 2 years) |
| Stricter Water-Usage Rules for Liquid Cooling | -1.2% | Abu Dhabi and Dubai, free-zone relief in Masdar City | Long term (≥ 4 years) |
| Source: Mordor Intelligence | |||
Export-Control Scrutiny on Advanced Chips
The United States Bureau of Industry and Security’s Validated End User framework adds 60- to 90-day lead-time overhead, as each H100 or Blackwell shipment requires Technology Protection Plan audits. Microsoft’s September 2024 license came with quarterly inspection clauses, complicating Azure capacity planning. The massive 35,000-unit Blackwell allocation to G42 in 2025 came with strict non-reexport conditions, locking buyers into full depreciation risk. The compliance hurdle divides the market into entities that can navigate audits and those that settle for prior-generation A100 or AMD MI300X accelerators. Localization efforts, including a planned regional chip-packaging plant backed by Mubadala, gather momentum as buyers hedge supply-chain exposure.
High Upfront CAPEX and Supply-Chain Bottlenecks
Khazna’s 100 MW Ajman build will cost roughly USD 1.1 billion, illustrating the USD 10-12 million per-MW benchmark for Tier 3 construction in the UAE. GPU server lead times lengthened to 26 weeks in 2024, with export approvals adding another 8-10 weeks. Power-distribution and precision-cooling components face similar scarcity; Vertiv cited 3- to 4-month delays on a 16 MW Dubai Silicon Oasis project. CAPEX intensity discourages speculative builds, shifting risk to anchor tenants willing to lock in multi-year commitments. Copper and substrate price volatility further cloud budgeting, prompting force-majeure clauses once rare in pre-2023 contracts.
*Our forecasts treat driver/restraint impacts as directional, not additive. The impact forecasts reflect baseline growth, mix effects, and variable interactions.
Segment Analysis
By Tier Type: Tier 4 Gains as AI Workloads Demand Five-Nines Uptime
Tier 3 facilities commanded 71.24% of the United Arab Emirates data center server market share in 2025, reflecting broad enterprise adoption that accepts limited maintenance windows. Tier 4 sites are projected to register a 19.54% CAGR through 2031 as hyperscalers and sovereign-cloud operators insist on 99.995% uptime for AI inference clusters. A United Arab Emirates data center server market size perspective shows Tier 4 deployments adding the bulk of incremental megawatts between 2026 and 2031. AD Ports Group’s Tier IV certification in December 2025 underscored this pivot to fault-tolerant architecture. Liquid cooling is designed in from day one, shifting power densities beyond 50 kW per rack, a breakpoint where air cooling loses efficiency.
The regulatory ceiling imposed by the National Electronic Security Authority effectively turns Tier III into the minimum compliance bar for government workloads. Enterprises that once opted for Tier II disaster-recovery sites now gravitate toward Tier III concurrent-maintainability, trimming scheduled downtime to under 1.6 hours annually. Khazna’s dual-path power and 2N+1 cooling blueprint typifies the new Tier III baseline. Looking ahead, Tier IV builds are likely to remain hyperscale-only, given their higher capital intensity and stringent redundancy mandates.


By Data Center Size: Hyperscale Campuses Capture AI and Cloud Migration Flows
Large facilities, defined as 1,000-5,000 servers, held 41.77% share in 2025, supplying private suites for multinational tenants inside colocation campuses. The United Arab Emirates data center server market size for hyperscale builds is forecast to grow at 19.38% CAGR, powered by Microsoft-G42’s 200 MW program and du’s AED 2 billion Dubai campus. Medium sites (200-1,000 servers) remain popular among regional headquarters that consolidate Gulf workloads in one emirate. Small edge sites under 200 servers deliver low-latency 5G services in telecom central offices.
Khazna’s modular 20-hall Ajman design allows 5 MW increments that activate as anchor tenants commit, mitigating utilization risk. Hyperscale tenants typically bypass distributors and negotiate direct volume contracts with Dell, HPE, or Supermicro, trading flexibility for unit-cost savings. Enterprises in large and medium halls value colocation neutrality, enabling multi-vendor sourcing and easier cloud repatriation.
By Data Center Type: Hyperscalers and CSPs Gain as Sovereign Cloud Mandates Accelerate
Colocation sites captured 56.87% revenue in 2025, reflecting a preference to lease power and space. Yet hyperscalers and CSPs are projected to post a 19.91% CAGR as sovereign-cloud frameworks oblige public-sector workloads to reside in locally certified regions. Microsoft’s expansion via Khazna enlarges Azure’s sovereign footprint, while Oracle’s Blackwell supercluster strengthens in-country AI capacity.
Enterprises still need on-premises racks for ultra-low-latency or legacy workloads, but many hedge by adopting bare-metal-as-a-service, allowing monthly rentals instead of capex. Equinix’s Dubai IBX sites sit at the heart of this hybrid topology, hosting the UAE Internet Exchange and 3,000 IT providers. [1]Equinix, “Why choose Dubai data centers?,” EQUINIX.COM The United Arab Emirates data center server market share for colocation is expected to gradually yield ground to hyperscale as cloud-native adoption deepens.
By Form Factor: Micro-Blades Gain Traction in Edge and IoT Gateway Deployments
Half-height blades kept 62.65% share in 2025, balancing compute density with airflow. Quarter-height and micro-blades are forecast to grow 19.72% CAGR, driven by telecom edge nodes that fit inside constrained 5G cabinets. [2]du, “du launches GPU-as-a-Service,” DU.AE Full-height blades remain a niche for reservoir simulation or academic HPC.
High office rents in central Dubai, averaging USD 50-70 per square foot, create an economic case for maximizing compute per square meter, accelerating micro-blade adoption. Vendors like Supermicro and Quanta see rising orders for 1U GPU nodes capable of hosting eight accelerators, allowing telecoms to monetize GPU-as-a-Service without expanding footprints.
By Application and Workload: Virtualization Rebounds as Enterprises Repatriate Cloud Workloads
AI and ML consumed 36.76% of server capacity in 2025, led by sovereign-AI projects in Abu Dhabi. The United Arab Emirates data center server market size for virtualization and private cloud is forecast to grow 19.83% CAGR through 2031 as BFSI and government agencies bring workloads home to meet residency rules. HPC, storage-centric, and edge workloads round out the mix.
Cloud egress fees have pushed enterprises to compare bare-metal colocation TCO against hyperscale pay-as-you-go. Findings show 30-40% savings over multi-year horizons, catalyzing reverse migrations to on-premises VMware and OpenStack clusters. Core42’s H100 pool, available on hourly terms, offers an alternative for bursty AI tasks without long-term commitment.
Geography Analysis
Abu Dhabi hosted 16 of the nation’s 35 facilities in 2025 and leads GPU-dense deployments through G42’s Stargate campus and Oracle’s Blackwell supercluster. Dubai maintained 18 data centers, including three Equinix IBX sites that anchor regional peering, and benefits from 15-millisecond links to Mumbai. Fujairah’s solitary site sits adjacent to the 2Africa subsea landing, supplying low-latency transit for content-delivery networks.
Installed capacity reached 358 MW in 2025 and is set to reach roughly 950 MW by 2028, powered by a USD 46.1 billion pipeline that accounts for 55% of GCC totals. Khazna surpassed 300 MW live capacity by end-2023 and targets 850 MW by 2029 through projects in Abu Dhabi, Dubai, and Ajman. Microsoft-G42 and du initiatives will add roughly 250-300 MW by 2027, likely preserving the Abu Dhabi-Dubai duopoly in large-scale builds.
Utilization stood at 98.7% in 2025, signaling tight supply. However, simultaneous hyperscale openings in 2026-2027 could briefly tip the market into oversupply if enterprise cloud migrations lag policy expectations. Free-zone incentives in Masdar City and Dubai Silicon Oasis, including discounted green-energy tariffs and fast-track permitting, continue to steer new projects toward these clusters.
Competitive Landscape
Global OEMs including Dell, Hewlett Packard Enterprise, Lenovo, Cisco, and Supermicro compete for multi-year refresh cycles at Khazna and hyperscalers, capturing a combined 60% shipment share in 2025. [3]ASBIS Middle East, “ASBIS News,” ASBISME.AEHyperscalers lock in pricing through direct contracts, often bundling software stacks such as Azure Stack HCI or Exadata Cloud@Customer. Colocation operators retain vendor neutrality but increasingly upsell managed services that standardize on incumbent hardware.
Telecom incumbents du and Etisalat vertically integrate, offering GPU-as-a-Service to enterprises that prefer opex models over capex, effectively competing with public-cloud GPU rentals. Hewlett Packard Enterprise partnered with Khazna in 2024 to launch the region’s first managed direct-liquid-cooling service, claiming 20.7% higher compute per kilowatt.
AMD plans to challenge NVIDIA’s high-end dominance via a 2026 MI350X cluster built jointly by Cisco and G42, signaling chip-vendor diversification. Compliance remains strict as ISO 27001, ISO 22301, and NESA audits govern any workload touching federal data. Vendors with pre-certified blueprints gain a procurement edge, especially when export-control delays can derail tight AI project timelines.
United Arab Emirates Data Center Server Industry Leaders
International Business Machines (IBM) Corporation
Hewlett Packard Enterprise (HPE)
Lenovo Group Limited
Cisco Systems Inc.
Dell Technologies Inc.
- *Disclaimer: Major Players sorted in no particular order

Recent Industry Developments
- January 2026: Microsoft and G42 completed the first 50 MW phase of their 200 MW Khazna expansion, enabling early access to confidential computing for Abu Dhabi government customers.
- November 2025: Oracle deployed the Middle East’s first NVIDIA Blackwell supercluster inside its Abu Dhabi region to accelerate sovereign-AI projects.
- November 2025: Microsoft and G42 announced a 200 MW data-center capacity program via Khazna, part of a USD 15.2 billion commitment through 2029.
- November 2025: The United States approved G42 to import 35,000 NVIDIA Blackwell GB300 GPUs under the Validated End User framework.


Research Methodology Framework and Report Scope
Market Definitions and Key Coverage
According to Mordor Intelligence, the United Arab Emirates data center server market covers all rack, blade, and micro servers that are newly installed inside purpose-built colocation, hyperscale, enterprise, and edge facilities across the seven emirates; values are reported in USD at end-user sale price, inclusive of on-site integration and three-year service bundles.
Scope exclusion: servers deployed in branch offices, broadcast vans, or telecom street cabinets sit outside this study.
Segmentation Overview
- By Tier Type
- Tier 1 and 2
- Tier 3
- Tier 4
- By Data Center Size
- Small Data Center
- Medium Data Center
- Large Data Center
- Hyperscale Data Center
- By Data Center Type
- Colocation Data Center
- Hyperscalers Data Center/CSPs
- Enterprise and Edge Data Center
- By Form Factor
- Half-height Blades
- Full-height Blades
- Quarter-height / Micro-blades
- By Application / Workload
- Virtualisation and Private Cloud
- High-Performance Computing (HPC)
- Artificial Intelligence/Machine Learning and Data Analytics
- Storage-centric
- Edge / IoT Gateways
Detailed Research Methodology and Data Validation
Primary Research
Mordor analysts interviewed UAE-based facility operators, global OEM product managers, regional distributors, and data center design consultants spanning Dubai, Abu Dhabi, and Sharjah. These conversations validated live rack counts, refresh cycles, and hyperscaler self-build intentions, letting us close information gaps left by secondary sources.
Desk Research
We draw on tier-1 public datasets, including UAE Federal Competitiveness & Statistics Center monthly trade sheets, Telecommunications and Digital Government Regulatory Authority cloud traffic bulletins, Dubai Customs HS-code import logs for 8471 servers, and International Energy Agency data on electricity tariffs, to understand physical inflows, workload growth, and TCO trends. Supplementary context comes from industry bodies such as the Gulf Data Center Association, peer-reviewed pieces in IEEE Access on immersion cooling adoption, and listed vendor 10-Ks that reveal regional revenue splits.
Paid repositories, such as D&B Hoovers for supplier financials, Volza for shipment-level manifests, and Dow Jones Factiva for deal flow, let us cross-match volumes with ASP corridors, after which our analysts reconcile outliers with the open-source stream. This list is illustrative; many additional references underpin our desk work.
Market-Sizing & Forecasting
A top-down construct starts with 2024 installed IT load (MW) and average server wattage to derive unit demand, which is then priced using weighted ASPs by form factor; selective bottom-up checks, including supplier roll-ups and channel stock audits, fine-tune totals. Key variables include hyperscaler capex announcements, server import trajectories, average rack density, UAE enterprise IT spending, and electricity cost sensitivity. A multivariate regression with GDP growth and cloud workload penetration as exogenous drivers projects demand to 2030; where data are scarce, interpolation follows documented adoption lags from comparable GCC markets before being further filtered through primary expert ranges.
Data Validation & Update Cycle
Outputs undergo variance screening against shipment data and electricity meter readings, followed by a two-step peer review. Reports refresh each June, with interim revisions when capex plans, import duties, or large colocation expansions materially shift the baseline; a final analyst pass precedes client delivery.
Why Mordor's United Arab Emirates Data Center Server Baseline Commands Reliability
Published estimates often diverge because firms pick different form factor mixes, treat captive hyperscale halls inconsistently, or refresh datasets on uneven cadences.
Key gap drivers here include: (1) whether tower servers outside Tier-rated halls are counted, (2) inclusion of bundled software and support, (3) extrapolation of ASP inflation, and (4) frequency of model updates when the dirham-pegged currency dulls price volatility.
Benchmark comparison
| Market Size | Anonymized source | Primary gap driver |
|---|---|---|
| USD 2.80 B (2025) | Mordor Intelligence | - |
| USD 0.73 B (2025) | Regional Consultancy A | Excludes hyperscale self-build racks and values only first-time blade installations |
| USD 3.30 B (2024) | Trade Journal B | Adds tower servers in office server rooms and applies uniform 8% ASP uplift without import-duty adjustment |
These comparisons show how selective scope choices or unchecked pricing assumptions swing totals by over a billion dollars, whereas Mordor's disciplined variable set and annual refresh give decision-makers a stable, transparent baseline.


Key Questions Answered in the Report
What is the projected value of the United Arab Emirates data center server sector by 2031?
Total spending is expected to reach USD 7.77 billion by 2031, up from USD 3.29 billion in 2026.
How quickly is Tier 4 adoption expanding across the country?
Tier 4 deployments are forecast to rise at a 19.54% CAGR through 2031 as hyperscalers and sovereign-cloud operators demand 99.995% uptime.
Which emirates host most hyperscale capacity today?
Abu Dhabi and Dubai together accommodate the majority of existing and planned hyperscale campuses, including the 200 MW Microsoft-G42 build and Khazna’s multi-site pipeline.
Why are quarter-height and micro-blade servers gaining traction?
Telecom operators favor these ultra-dense form factors to maximize GPU and CPU counts inside space-constrained 5G edge sites and to reduce real-estate costs in central Dubai.
How do export-control rules affect GPU procurement lead times?
Validated End User licensing adds roughly 60-90 days to import schedules for NVIDIA H100 and Blackwell accelerators, making delivery dates less predictable.
What capital cost should be assumed for building a Tier 3 data center in the UAE?
Typical construction runs between USD 10 million and USD 12 million per megawatt, before accounting for servers and networking gear.
Page last updated on:


