Satellite Bus Market Size and Share
Market Overview
| Study Period | 2020 - 2031 |
|---|---|
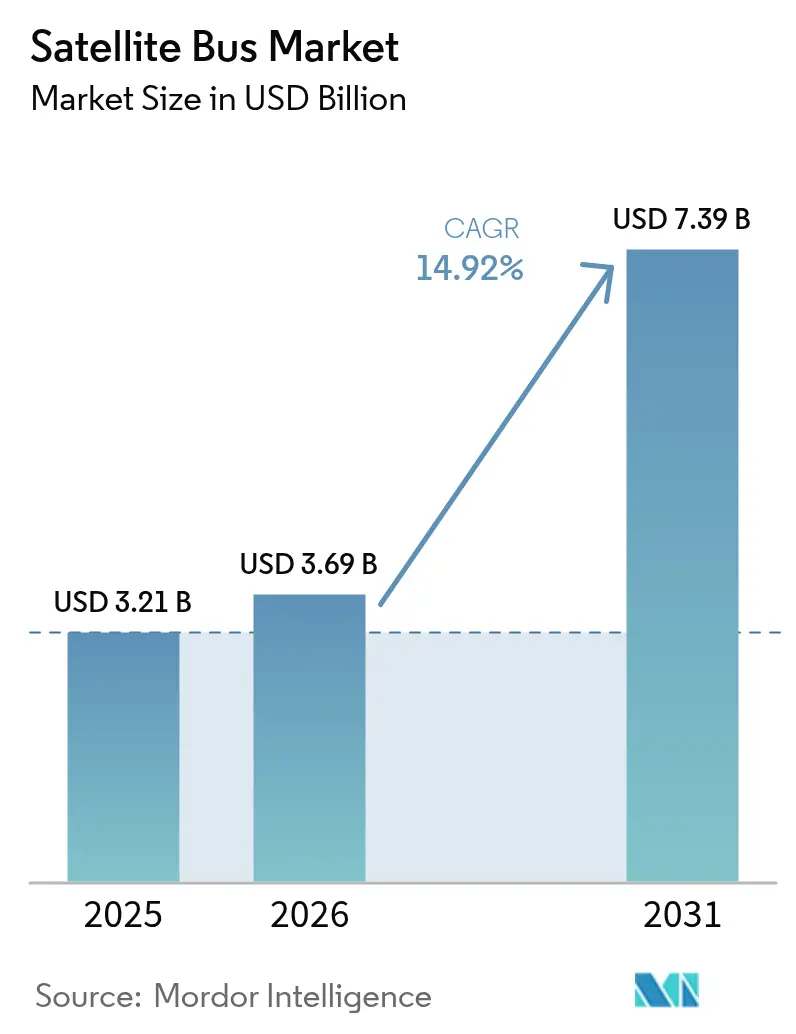
| Market Size (2026) | USD 3.69 Billion |
| Market Size (2031) | USD 7.39 Billion |
| Growth Rate (2026 - 2031) | 14.92% CAGR |
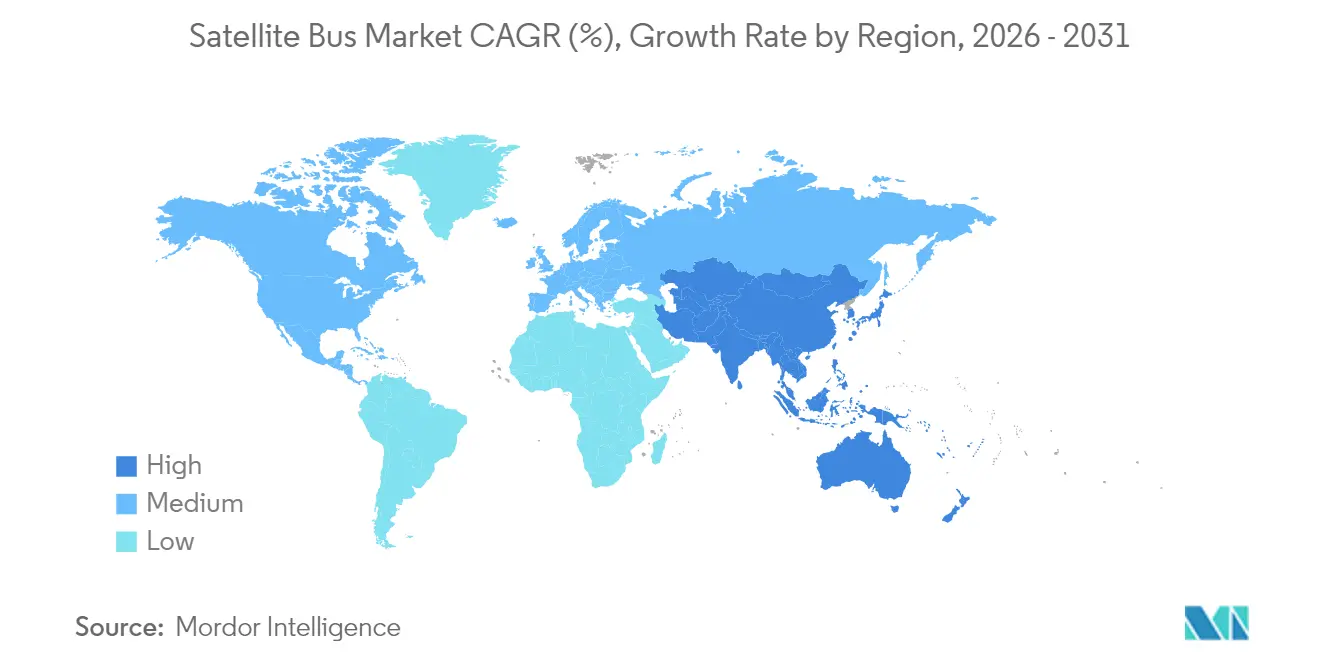
| Fastest Growing Market | Asia Pacific |
| Largest Market | North America |
| Market Concentration | Medium |
Major Players *Disclaimer: Major Players sorted in no particular order Image © Mordor Intelligence. Reuse requires attribution under CC BY 4.0. | |
Satellite Bus Market Analysis by Mordor Intelligence
The satellite bus market size was valued at USD 3.21 billion in 2025 and estimated to grow from USD 3.69 billion in 2026 to reach USD 7.39 billion by 2031, at a CAGR of 14.92% during the forecast period (2026-2031). Constellation operators emphasize rapid build cycles, modular architectures, and software-defined payload hosting, aligning with government resilience programs that demand fast refresh and on-orbit reconstitution. Semiconductor supply constraints, stricter orbital-debris rules, and escalating insurance premiums add cost pressure, favoring bus suppliers with proven designs and vertically integrated production. North America retains demand leadership through transport layer procurements and mega-constellation roll-outs. At the same time, Asia-Pacific emerges as the fastest-growing region as China and India scale domestic manufacturing capacity.
Key Report Takeaways
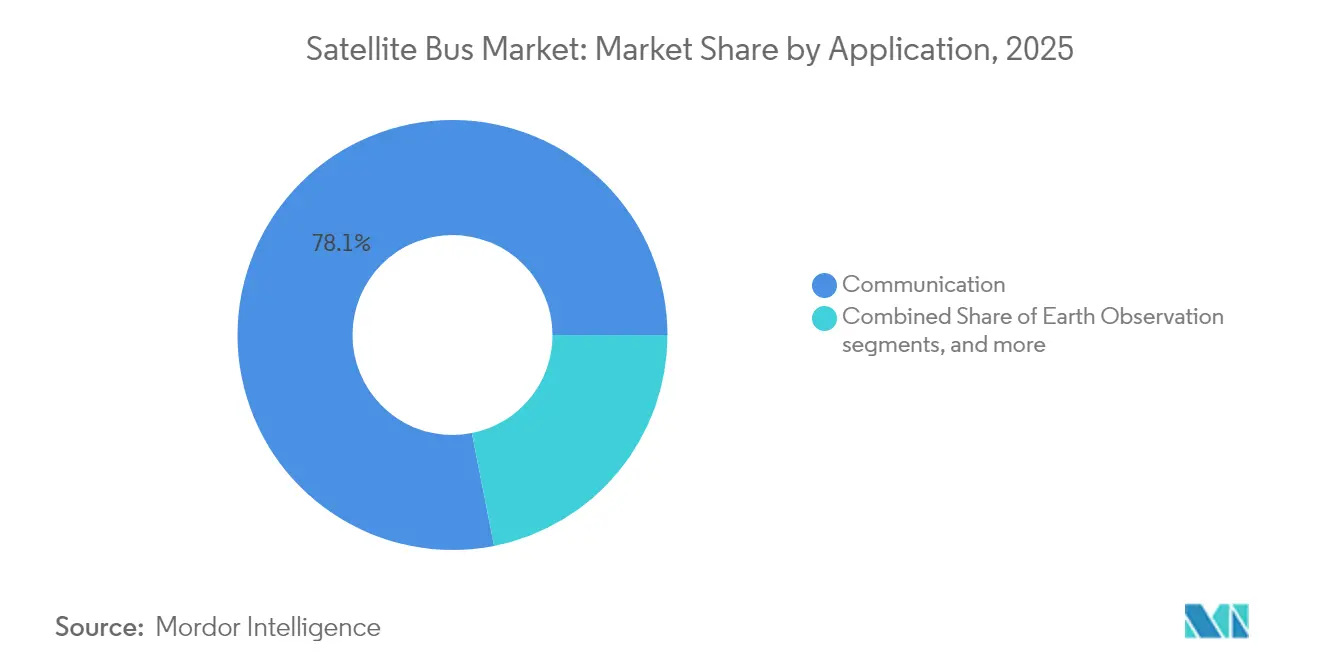
- By application, communication captured 78.10% of the satellite bus market share in 2025; navigation buses recorded the fastest 15.85% CAGR through 2031.
- By mass, platforms above 1,000 kg held 52.30% of the satellite bus market size in 2025, whereas the 100-500 kg class is expected to advance at a 16.32% CAGR to 2031.
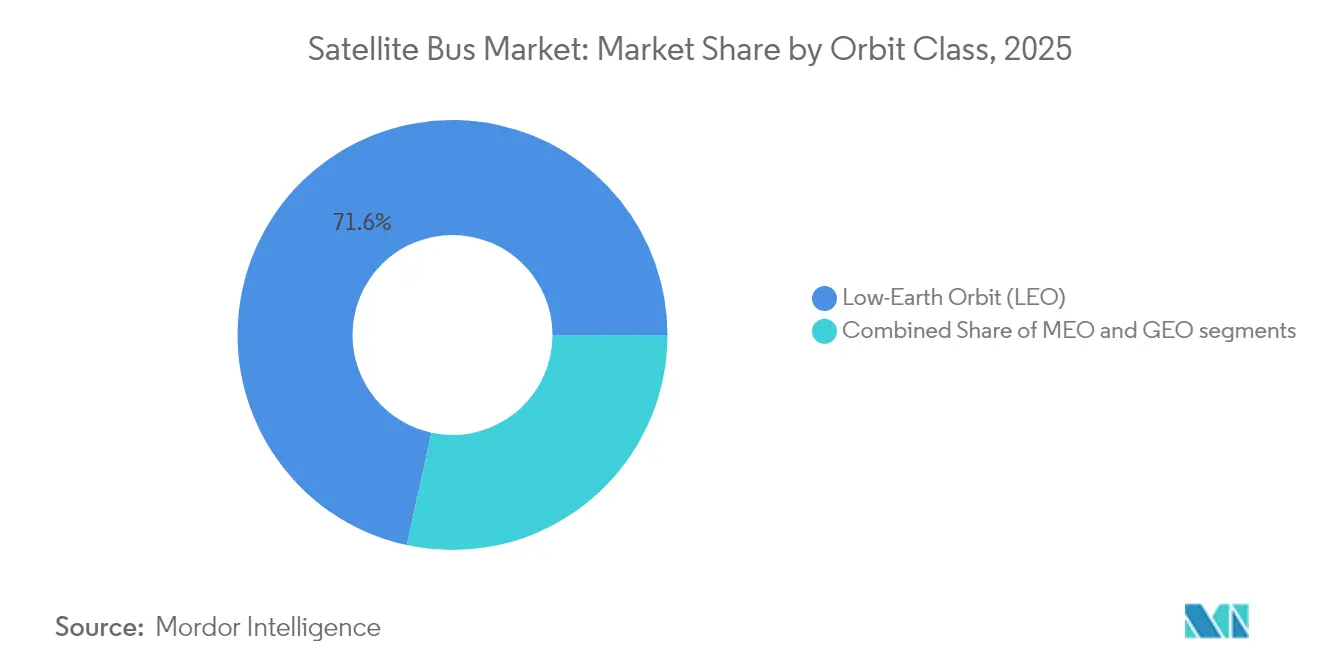
- By orbit class, LEO architectures commanded 71.60% revenue share in 2025, and GEO buses posted the quickest 15.55% CAGR over the forecast period.
- By end user, commercial operators controlled 66.90% of 2025 revenues, while government and military demand is projected to grow at a 15.96% CAGR through 2031.
- By geography, North America led with a 67.90% share in 2025, while Asia-Pacific outpaced all other regions at a 16.65% CAGR.
Note: Market size and forecast figures in this report are generated using Mordor Intelligence’s proprietary estimation framework, updated with the latest available data and insights as of 2026.
Global Satellite Bus Market Trends and Insights
Explosive Demand for Broadband Mega-Constellations
Proliferated broadband networks re-shape the satellite bus market as constellation managers trade bespoke hardware for factory output, exemplified by Starlink’s 23-day build cadence for more than 5,000 buses launched since 2019.[1]SpaceX, “Starlink Mission Updates,” SpaceX, spacex.com The EU’s IRIS² program entails a USD 10.6 billion, 290-satellite commitment that anchors European supply chains, while Amazon’s 3,236-unit Project Kuiper spreads orders across multiple primes to mitigate supplier bottlenecks. Standardized buses enable roll-rate manufacturing, which rewards vendors that can synchronize avionics, power, and thermal modules across batch builds. Software-defined radios and reprogrammable payload interfaces enable operators to refresh services in orbit, thereby lowering the lifetime cost of capability upgrades. These trends reinforce winner-take-all outcomes in which scale defines vendor viability.
Government Resilience Programs and SDA Architectures
SDA’s Transport Layer Tranche 2 alone calls for 126 identical buses with delivery windows compressed from multi-year cycles to months, creating a procurement template that other defense ministries now emulate. NATO’s 2019 recognition of space as an operational domain spurred allied nations to pursue sovereign constellations that demand domestic industrial participation. The Pentagon’s post-Ukraine emphasis on proliferated LEO assets validates distributed architectures that withstand jamming or kinetic attack, thereby making standardized buses mission-critical. Region-specific sourcing requirements fragment demand but simultaneously guarantee volume to local suppliers. Defensive use cases raise appetite for inter-satellite cross-links and rapid on-orbit reconstitution, favoring chassis designed for plug-and-play payload swaps.
Price Inflection from Mass-Produced Modular Buses
York Space Systems’ USD 90 million Denver expansion increases annual output to 500 units, reducing per-bus costs by up to 60% compared to traditional line builds.[2]York Space Systems, “Manufacturing Capabilities,” York Space Systems, yorkspacesystems.com Modular frames enable operators to exchange optical, radar, or communications payloads without requiring new non-recurring engineering, thereby reducing program lead times previously consumed by subsystem re-certification. The “bus-as-a-service” model shifts capital expenditure to operating expense, widening access for small-sat constellations that lack in-house manufacturing bench strength. Complementary services, such as D-Orbit’s ASTROLIFT, provide post-launch deployment and orbital repositioning, further reducing launch mass margins and allowing lower-thrust buses to carry larger commercial payloads. Collectively, these cost inflections heighten pressure on legacy primes to retire custom build lines in favor of automotive-style production.
Dual-Use Intelligence-Surveillance Requirements
Commercial EO operators are increasingly integrating classified-grade encryption and hard-kill, ejectable memory into standard buses, enabling rapid switching between civilian and defense payload packages. The National Reconnaissance Office’s Strategic Commercial Enhancements initiative channels intelligence budgets into private imaging fleets that ride on standardized buses.[3]National Reconnaissance Office, “Strategic Commercial Enhancements,” NRO, nro.gov Maxar and Planet Labs leverage shared bus designs across commercial and government contracts, spreading development costs while satisfying ITAR containment requirements. Governments benefit from commercial refresh rates that halve data latency compared with bespoke reconnaissance systems. Regulatory hurdles create natural moats for domestic suppliers that master the sourcing of export-controlled components.
Restraints Impact Analysis*
| Restraint | (~) % Impact on CAGR Forecast | Geographic Relevance | Impact Timeline |
|---|---|---|---|
| Ongoing semiconductor and reaction-wheel shortages | -1.90% | Global, most acute in Asia-Pacific manufacturing hubs | Short term (≤2 years) |
| Rising orbital-debris mitigation expenses | -1.20% | Global, with policy leadership in Europe and North America | Long term (≥4 years) |
| ITAR and export-control compliance burden | -1.00% | Global, primarily affecting North America and Europe | Medium term (2-4 years) |
| Higher insurance premiums for small-sat buses | -0.80% | Global, concentrated in commercial segments | Short term (≤2 years) |
| Source: Mordor Intelligence | |||
Persistent Semiconductor/Reaction-Wheel Shortages
Lead times for radiation-hard components and reaction wheels increased from 12 weeks in 2024 to 52 weeks by early 2025, necessitating redesigns around second-tier chips and limiting actuator supplies.[4]Semiconductor Industry Association, “2025 Supply Chain Report,” SIA, semiconductors.org Honeywell and L3Harris dominate spacecraft-qualified wheel production, and capacity additions in Phoenix will not fully relieve backlog until late 2026. ITAR rules hamper US primes from multi-sourcing beyond a handful of vetted suppliers, while EU dual-use regulations impose parallel constraints on European vendors. Inventory buffers raise carrying costs, yet spot buys expose programs to counterfeit risk. Consequently, many integrators reserve scarce parts for higher-margin defense buses, which delays commercial runs and dampens the satellite bus market's growth trajectory.
Orbital-Debris Mitigation Costs
The European Space Agency’s Zero Debris Charter obliges post-2030 launches to prove controlled deorbit, adding propulsion modules that increase dry mass by up to 20%. The US FCC mandates LEO satellites deorbit within five years of mission end, compelling operators to carry propellant that might otherwise extend revenue service.[5]Federal Communications Commission, “Satellite Regulations,” FCC, fcc.gov Insurance underwriters responded by increasing premiums by 40% since 2024 for small-sat clusters without active debris-avoidance capabilities, prompting some start-ups to defer their launches or adopt heritage buses with certified passivation modes. These compliance costs skew competitive advantage toward vendors offering integrated low-thrust electric or green-propellant tanks that meet disposal timelines without excessive mass penalties.
*Our forecasts treat driver/restraint impacts as directional, not additive. The impact forecasts reflect baseline growth, mix effects, and variable interactions.
Segment Analysis
By Application: Communication Dominance Drives Standardization
Communication platforms held 78.10% of the 2025 satellite bus market, a dominance rooted in mega-constellation economics that reward chassis uniformity and rapid throughput. Operators favor buses engineered for phased-array payloads, high-density battery packs, and corner-cube precision pointing that supports laser cross-links. Navigation satellites are the fastest-growing segment, securing a 15.85% CAGR to 2031, as Galileo Second Generation and GPS III F/O procurements demand upgraded time-keeping and inter-satellite ranging. Earth-observation fleets are expanding as synthetic-aperture radar and hyperspectral payloads migrate to standardized buses that can meet tighter thermal stability specifications. Space-observation missions piggyback on commercial mass-manufactured frames, benefiting from shared avionics and power conditioning modules. The scale of the communication segment compels suppliers to optimize final-assembly jigs for multi-shift operations, further entrenching shorter supply chains and lower unit pricing across the satellite bus market.
Software-defined radios enable frequency agility, which future-proofs broadband revenue models by reducing reliance on launch cadence for feature upgrades. Navigation satellites, by contrast, demand clock isolation plates and radiation-shielded bays, prompting manufacturers to spin specialized variants on standard backbones. Earth-observation operators configure buses for high-throughput downlinks and reaction-wheel agility, while space situational awareness payloads add star-tracker redundancy. Over time, niche scientific missions have exploited commercial-grade platforms, reducing bespoke build demand and reinforcing a virtuous cycle of volume discounting within the satellite bus market.


By Satellite Mass: Mid-Range Platforms Capture Growth
Satellites in the 100-500 kg band are expected to record a 16.32% CAGR, as constellation architects regard them as the sweet spot between launch pricing and sensor capability. Dual-manifest rideshare capacity on Falcon 9 and Ariane 6 lowers deployment cost per kilogram, making mid-mass buses attractive for operators that prioritize rapid node replenishment. Heavy platforms above 1,000 kg maintain a 52.30% share, thanks to GEO communication craft and high-power EO observatories, which require large solar arrays and ample thermal dissipation. The 10-100 kg class anchors CubeSat networks but suffers from limited battery capacity and propulsion margins for mandatory deorbit.
Manufacturers now build skeletal frames with slide-in power, command, and data-handling panels, shortening fit-check to days. Propulsive deorbit kits consume up to 15% of a small satellite's dry mass, prompting some fleets to enlarge their chassis into the 100-200 kg bracket to preserve payload volume while meeting debris regulations. The satellite bus market thus experiences a gradual up-mass trend among LEO entrants, even as heavy-lift Ariane 6 V and Starship capacity foster new GEO and cislunar bus variants. Modular design allows a single production line to output multiple mass classes, thereby enablessmoothing demand cycles and maximizing capital utilization.
By Orbit Class: LEO Architectures Transform Industry Dynamics
LEO assets captured 71.60% of 2025 revenue on the back of broadband constellations and SDA’s Transport Layer, whose cadence targets multi-year block refresh intervals. Vendors standardized 500-800 km orbital design points to align thermal and radiation models with existing qualification data, shortening compliance timelines. GEO platforms, although comprising only a fraction of the unit count, command premium pricing and exhibit an 15.55% CAGR due to high-throughput Ka-band relays and next-generation broadcast services. MEO fleets primarily cater to navigation and regional connectivity, where fewer nodes suffice, delivering stable, though slower, demand.
LEO’s proliferated architecture reduces individual spacecraft criticality, spurring emphasis on collision-avoidance sensors and autonomous station-keeping software. GEO buses must sustain 15-year life cycles, requiring gallium-arsenide arrays, multi-junction cells, and robust thermal loops, thereby preserving opportunities for large primes. MEO constellations exploit fewer launches but require precise station-keeping and radiation shielding through the Van Allen belts, steering suppliers toward mid-mass bus derivatives. The satellite bus market, therefore, stratifies with high-volume LEO production lines coexisting with boutique GEO shops that overlay AI-based health monitoring to extend mission life.
By End User: Commercial Operators Drive Market Evolution
Commercial companies controlled 66.90% of 2025 bus revenues, a dominance fueled by venture-backed broadband, imaging, and IoT networks that prioritize speed to orbit over bespoke customization. Government and military customers, however, chart a 15.96% CAGR as space ascends into core defense planning, propelling domestic manufacturers into funded block buys. Academic and multilateral organizations leverage off-the-shelf frames for technology demonstrations, but represent a minor share of unit volume.
Dual-use payload hosting lets commercial constellations sell capacity to security agencies, blurring the traditional civil-defense divide and increasing baseline bus specification levels. Export-control overhead favors local suppliers, effectively creating parallel satellite bus market ecosystems in North America, Europe, and Asia. In practice, commercial primes shape technology road maps that governments adopt under customized mission assurance frameworks, reversing the historical flow of innovation from defense to civil. Those dynamics compel primes to maintain variant catalogs capable of toggling between civilian and classified payload accommodations without extending integration lead times.
Geography Analysis
North America is expected to retain 67.90% of the driven by 2025 satellite bus market by 2025, with market revenue behind SDA Transport Layer block buys, Starlink fleet replenishment, and Project Kuiper procurement, all of which require hundreds of buses per year. US ITAR statutes limit foreign sourcing for critical components, creating a captive domestic demand pool for avionics and propulsion suppliers while shielding them from price competition. Canadian participation in NATO space surveillance and Mexico’s agricultural imaging needs add incremental regional volume, reinforcing the integrated North American value chain.
Asia-Pacific registers the fastest 16.65% CAGR through 2031, buoyed by China’s 300% production capacity step-up between 2020-2024 and India’s space liberalization policies that welcome private capital into satellite manufacturing. China’s “space Silk Road” initiative packages satellite buses with downstream data-as-a-service offerings, spurring exports to Belt and Road partner nations. India’s small-sat clusters target communication backhaul and disaster monitoring, aligning with regional digital-inclusion agendas. Japan and South Korea expand supplementary demand for EO and military surveillance buses, while Australia funds sovereign LEO platforms for asset monitoring.
Europe leverages multi-national coordination to sustain its industrial base, with IRIS² and Galileo G2 distributing contracts across France, Germany, and Italy. The European Space Agency’s Zero Debris Charter outlines subsystem road maps and harmonizes propulsion standards, enabling roadmap suppliers to amortize design costs across multiple programs. In the Middle East and Africa, although nascent, investments are being made in national space agencies and Earth-observation fleets to track agricultural yields and infrastructure projects. South American demand centers on Brazil’s technology-transfer partnerships, which pair satellite buses with ground-station rollouts, forming long-term service ecosystems.

Competitive Landscape
The satellite bus market exhibits a moderate concentration level, featuring legacy primes such as Lockheed Martin Corporation, Northrop Grumman Corporation, and Airbus SE, alongside new-space entrants like York Space Systems and NanoAvionics. Heritage suppliers dominate heavy GEO segments through flight-qualified designs and secured supply chains, whereas agile newcomers thrive in LEO constellations by applying automotive production principles. Modular bus frameworks enable commonality across power, propulsion, and thermal subsystems, shortening re-qualification as providers iterate on payload variants.
Strategic moves in 2025 highlight capacity expansions and multiyear block awards. York Space Systems’ 10-fold line-rate increase undergirds bids for SDA and commercial broadband deployments, while Thales Alenia and OHB secure IRIS² buses to sustain European autonomy. Lockheed Martin and Northrop Grumman diversify by co-producing Kuiper buses, mitigating single-program dependency. Firms cultivate in-orbit servicing readiness by embedding grapple fixtures and refueling valves to prolong the value of spacecraft amid stricter deorbit mandates.
Technology road maps converge on software-defined avionics, artificial-intelligence-enabled fault isolation, and electric propulsion optimized for both orbital maintenance and disposal burns. Companies differentiate through vertical integration encompassing reaction-wheel fabrication, star-tracker algorithms, and ground-station virtualization. Partnerships with cloud providers enable edge-compute payload hosting, opening ancillary revenue streams inside standardized buses. Market share battles hinge on scaling output while sustaining quality metrics that minimize on-orbit anomalies, reinforcing barriers for late entrants lacking capital or heritage.
Satellite Bus Industry Leaders
Airbus SE
Honeywell International Inc.
Lockheed Martin Corporation
Northrop Grumman Corporation
Thales Alenia Space (Thales Group)
- *Disclaimer: Major Players sorted in no particular order


Recent Industry Developments
- September 2025: Terran Orbital Corporation, a manufacturer of small satellites for the aerospace and defense industries, delivered 42 satellite bus platforms for the Space Development Agency's (SDA) Proliferated Warfighter Space Architecture Tranche 1 program.
- April 2025: IN-SPACe launched the Satellite Bus as a Service (SBaaS) initiative to support private space innovation in India. This program enables non-governmental entities to access satellite platforms for hosted payload missions.
- February 2025: Apex Technology secured a USD 45.9 million contract from the United States Space Force. The contract aligns with Apex's expansion from low Earth orbit satellites to geostationary, medium Earth orbit, and deep space missions.
- October 2025: ESA placed EUR 2.3 billion in IRIS² bus awards with Thales Alenia Space and OHB SE for 290 secure-communications satellites.


Global Satellite Bus Market Report Scope
| Communication |
| Earth Observation |
| Navigation |
| Space Observation |
| Others |
| Below 10 kg |
| 10–100 kg |
| 100–500 kg |
| 500–1,000 kg |
| Above 1,000 kg |
| Low-Earth Orbit (LEO) |
| Medium-Earth Orbit (MEO) |
| Geosynchronous Orbit (GEO) |
| Commercial |
| Government and Military |
| Others |
| North America | United States | |
| Canada | ||
| Mexico | ||
| South America | Brazil | |
| Rest of South America | ||
| Europe | United Kingdom | |
| France | ||
| Germany | ||
| Russia | ||
| Rest of Europe | ||
| Asia-Pacific | China | |
| India | ||
| Japan | ||
| South Korea | ||
| Australia | ||
| Rest of Asia-Pacific | ||
| Middle East and Africa | Middle East | Saudi Arabia |
| United Arab Emirates | ||
| Rest of Middle East | ||
| Africa | South Africa | |
| Rest of Africa | ||
| By Application | Communication | ||
| Earth Observation | |||
| Navigation | |||
| Space Observation | |||
| Others | |||
| By Satellite Mass | Below 10 kg | ||
| 10–100 kg | |||
| 100–500 kg | |||
| 500–1,000 kg | |||
| Above 1,000 kg | |||
| By Orbit Class | Low-Earth Orbit (LEO) | ||
| Medium-Earth Orbit (MEO) | |||
| Geosynchronous Orbit (GEO) | |||
| By End User | Commercial | ||
| Government and Military | |||
| Others | |||
| By Geography | North America | United States | |
| Canada | |||
| Mexico | |||
| South America | Brazil | ||
| Rest of South America | |||
| Europe | United Kingdom | ||
| France | |||
| Germany | |||
| Russia | |||
| Rest of Europe | |||
| Asia-Pacific | China | ||
| India | |||
| Japan | |||
| South Korea | |||
| Australia | |||
| Rest of Asia-Pacific | |||
| Middle East and Africa | Middle East | Saudi Arabia | |
| United Arab Emirates | |||
| Rest of Middle East | |||
| Africa | South Africa | ||
| Rest of Africa | |||


Market Definition
- Application - Various applications or purposes of the satellites are classified into communication, earth observation, space observation, navigation, and others. The purposes listed are those self-reported by the satellite’s operator.
- End User - The primary users or end users of the satellite is described as civil (academic, amateur), commercial, government (meteorological, scientific, etc.), military. Satellites can be multi-use, for both commercial and military applications.
- Launch Vehicle MTOW - The launch vehicle MTOW (maximum take-off weight) means the maximum weight of the launch vehicle during take-off, including the weight of payload, equipment and fuel.
- Orbit Class - The satellite orbits are divided into three broad classes namely GEO, LEO, and MEO. Satellites in elliptical orbits have apogees and perigees that differ significantly from each other and categorized satellite orbits with eccentricity 0.14 and higher as elliptical.
- Propulsion tech - Under this segment, different types of satellite propulsion systems have been classified as electric, liquid-fuel and gas-based propulsion systems.
- Satellite Mass - Under this segment, different types of satellite propulsion systems have been classified as electric, liquid-fuel and gas-based propulsion systems.
- Satellite Subsystem - All the components and subsystems which includes propellants, buses, solar panels, other hardware of satellites are included under this segment.
| Keyword | Definition |
|---|---|
| Attitude Control | The orientation of the satellite relative to the Earth and the sun. |
| INTELSAT | The International Telecommunications Satellite Organization operates a network of satellites for international transmission. |
| Geostationary Earth Orbit (GEO) | Geostationary satellites in Earth orbit 35,786 km (22,282 mi) above the equator in the same direction and at the same speed as the earth rotates on its axis, making them appear fixed in the sky. |
| Low Earth Orbit (LEO) | Low Earth Orbit satellites orbit from 160-2000km above the earth, take approximately 1.5 hours for a full orbit and only cover a portion of the earth’s surface. |
| Medium Earth Orbit (MEO) | MEO satellites are located above LEO and below GEO satellites and typically travel in an elliptical orbit over the North and South Pole or in an equatorial orbit. |
| Very Small Aperture Terminal (VSAT) | Very Small Aperture Terminal is an antenna that is typically less than 3 meters in diameter |
| CubeSat | CubeSat is a class of miniature satellites based on a form factor consisting of 10 cm cubes. CubeSats weigh no more than 2 kg per unit and typically use commercially available components for their construction and electronics. |
| Small Satellite Launch Vehicles (SSLVs) | Small Satellite Launch Vehicle (SSLV) is a three-stage Launch Vehicle configured with three Solid Propulsion Stages and a liquid propulsion-based Velocity Trimming Module (VTM) as a terminal stage |
| Space Mining | Asteroid mining is the hypothesis of extracting material from asteroids and other asteroids, including near-Earth objects. |
| Nano Satellites | Nanosatellites are loosely defined as any satellite weighing less than 10 kilograms. |
| Automatic Identification System (AIS) | Automatic identification system (AIS) is an automatic tracking system used to identify and locate ships by exchanging electronic data with other nearby ships, AIS base stations, and satellites. Satellite AIS (S-AIS) is the term used to describe when a satellite is used to detect AIS signatures. |
| Reusable launch vehicles (RLVs) | Reusable launch vehicle (RLV) means a launch vehicle that is designed to return to Earth substantially intact and therefore may be launched more than one time or that contains vehicle stages that may be recovered by a launch operator for future use in the operation of a substantially similar launch vehicle. |
| Apogee | The point in an elliptical satellite orbit which is farthest from the surface of the earth. Geosynchronous satellites which maintain circular orbits around the earth are first launched into highly elliptical orbits with apogees of 22,237 miles. |


Research Methodology
Mordor Intelligence follows a four-step methodology in all our reports.
- Step-1: Identify Key Variables: In order to build a robust forecasting methodology, the variables and factors identified in Step-1 are tested against available historical market numbers. Through an iterative process, the variables required for market forecast are set and the model is built on the basis of these variables.
- Step-2: Build a Market Model: Market-size estimations for the historical and forecast years have been provided in revenue and volume terms. For sales conversion to volume, the average selling price (ASP) is kept constant throughout the forecast period for each country, and inflation is not a part of the pricing.
- Step-3: Validate and Finalize: In this important step, all market numbers, variables and analyst calls are validated through an extensive network of primary research experts from the market studied. The respondents are selected across levels and functions to generate a holistic picture of the market studied.
- Step-4: Research Outputs: Syndicated Reports, Custom Consulting Assignments, Databases & Subscription Platforms.


