North America Satellite Bus Market Size and Share
Market Overview
| Study Period | 2017 - 2030 |
|---|---|
| Forecast Data Period | 2025 - 2030 |
| Historical Data Period | 2017 - 2023 |
| Market Size (2025) | USD 14.54 Billion |
| Market Size (2030) | USD 28.17 Billion |
| Growth Rate (2025 - 2030) | 14.14% CAGR |
| Market Concentration | High |
Major Players*Disclaimer: Major Players sorted in no particular order Image © Mordor Intelligence. Reuse requires attribution under CC BY 4.0. | |

North America Satellite Bus Market Analysis by Mordor Intelligence
The North America Satellite Bus Market size is estimated at 14.54 billion USD in 2025, and is expected to reach 28.17 billion USD by 2030, growing at a CAGR of 14.14% during the forecast period (2025-2030).
The North American satellite bus industry is experiencing significant transformation driven by technological advancements and increasing commercial space activities. The region's space systems sector demonstrates robust growth, with the United States government alone investing approximately USD 24 billion in space programs in 2022, highlighting the strong governmental commitment to space exploration and satellite manufacturing technology development. The Canadian space sector further strengthens the regional landscape by contributing USD 2.3 billion to the Canadian GDP, with 90% of Canadian space firms being small and medium-sized businesses. This diverse ecosystem of established players and innovative startups is fostering competition and driving technological innovation in satellite bus manufacturing.
The industry is witnessing a remarkable shift in satellite deployment patterns across various orbital classes, reflecting evolving market demands and technological capabilities. Between 2017 and 2022, North American operators successfully deployed over 3,021 satellites into Low Earth Orbit (LEO), 33 satellites into Geostationary Earth Orbit (GEO), and 7 satellites into Medium Earth Orbit (MEO). This distribution pattern demonstrates the industry's growing preference for LEO satellites, particularly for applications requiring lower latency and higher resolution imaging capabilities. The trend is further supported by major commercial players developing advanced satellite platforms specifically designed for LEO constellations.
Commercial space activities are experiencing unprecedented growth, with private companies taking leading roles in commercial satellite deployment and innovation. The region has witnessed the emergence of numerous commercial partnerships and contracts for satellite bus manufacturing, particularly for communication and Earth observation applications. This trend is evidenced by the successful deployment of over 2,500 communications satellites by North American operators between 2017 and 2022, demonstrating the robust demand for satellite-based communication services. Companies are increasingly focusing on developing versatile satellite bus platforms that can accommodate various payload requirements while maintaining cost-effectiveness.
The industry is characterized by significant technological advancement in satellite bus design and manufacturing processes. Companies are investing in developing more efficient and capable satellite buses that can support diverse mission requirements across different orbital classes. Major manufacturers are introducing innovative solutions for communication and broadcasting missions, including advanced platforms designed for long-term, stable service in various orbital environments. These developments are complemented by an increasing emphasis on standardization and modular design approaches, enabling faster production cycles and more cost-effective satellite manufacturing strategies. The industry's focus on technological innovation is driving improvements in satellite performance, reliability, and operational efficiency across all orbital classes.
North America Satellite Bus Market Trends and Insights
The trend for better fuel and operational efficiency has been witnessed
- A satellite bus (or spacecraft bus) is the main body and structural component of a satellite or spacecraft, in which the payload and all scientific instruments are held. Moreover, the growing utilization of commercial satellite platforms for dual (military and civil) purposes has boosted the satellite bus market. Satellite communications are envisioned to be an essential part of the 5G infrastructure. In order to provide seamless connectivity between terrestrial and satellite, the satellite transport conduit is being integrated into the overall communication map. This will result in new opportunities for extending satellite services in urban and rural areas.
- China is investing significant resources toward augmenting its space-based capabilities. The country has launched the largest number of nano and microsatellites in Asia-Pacific. In April 2022, Chinese startup SpaceWish’s nanosatellite was launched into LEO boarding CZ-2C (3) rocket. XINGYUAN-2 is a 6U remote sensing CubeSat that weighs approximately 7.5 kg.
- In addition, the indigenous development of nano and microsatellites has been one of the areas of emphasis for the industry in India. Many startups and universities are developing these satellites at various levels in the country. For instance, in December 2018, Exseed Space launched a nanosatellite named ExseedSAT 1 to provide vital communication for radio amateurs. This was India’s first privately owned satellite into space. Countries like Australia, Malaysia, South Korea, and Singapore are also investing in the development of nano and microsatellites.
-by-country,-Number-of-Satellites-Launched,-North-America,-2017---2022.svg)


The increasing space expenditures of different space agencies are expected to impact the satellite industry positively
- Government's spending on space programs in North America hit approximately around 20 billion in 2021. The region is the epicenter of space innovation and research, with the presence of the world's biggest space agency, NASA. Since, the major investments in this field attracts various other sub system and component manufacturers and creates opportunities for them.
- In the region, in 2022, the US government spent nearly USD 24 billion on its space programs, making it the highest spender on space in the world. Apart from the United States, the Canadian space sector adds USD 2.3 billion to the Canadian GDP and employs 10,000 people, according to the Canadian government. The government reports that 90% of Canadian space firms are small- and medium-sized businesses. The Canadian Space Agency (CSA) budget is modest, and the estimated budgetary spending for 2022-23 was USD 329 million.
- In terms of research and investment grant, the region's governments and the private sector have dedicated funds for research and innovation in the space sector. Agencies spend available budgetary resources by making financial promises called obligations. For instance, till February 2023, the National Aeronautics and Space Administration (NASA) distributed USD 333 million as research grants.

OTHER KEY INDUSTRY TRENDS COVERED IN THE REPORT
- The increased importance of satellite miniaturization has aided the growth
Segment Analysis: Application
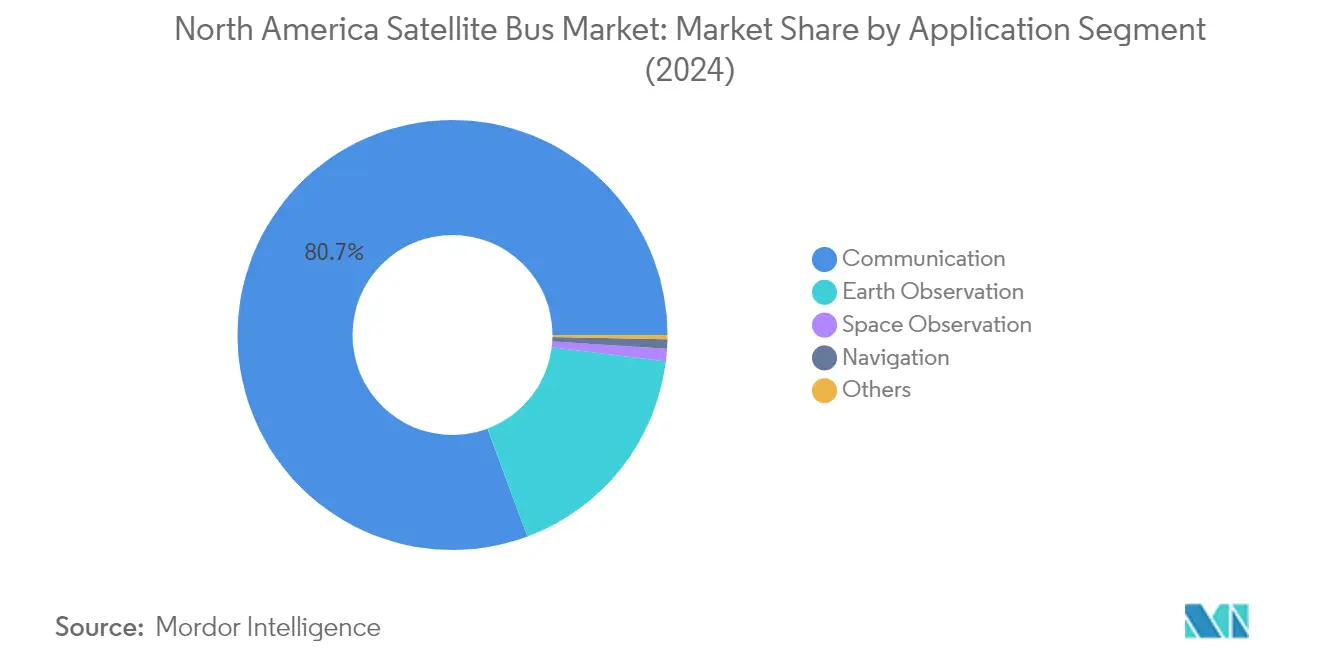
Communication Segment in North America Satellite Bus Market
The communication segment dominates the North America satellite bus market, commanding approximately 79% market share in 2024. This significant market position is driven by the growing demand for uninterrupted connectivity across various sectors, including media, entertainment, aviation, television, internet, and telecommunications. The segment's strength is particularly evident in the increasing adoption of satellite communication for motion communication solutions across military vehicles, utility vehicles, ships, and trains. The miniaturization of electronic components has enabled the creation of more lightweight and affordable satellite buses while maintaining advanced technological capabilities. Major government organizations and commercial entities in the region continue to forge strategic agreements for their satellite communication needs, with particular emphasis on developing advanced communication satellites for both civilian and military applications.

Navigation Segment in North America Satellite Bus Market
The navigation segment is emerging as the fastest-growing segment in the North America satellite bus market, with a projected growth rate of approximately 38% during 2024-2029. This remarkable growth is primarily driven by the increasing demand for precise positioning systems across various applications, particularly in commercial shipping, military operations, and civilian navigation needs. The segment's expansion is further supported by ongoing technological advancements in satellite navigation systems, with space agencies emphasizing new product development and upgrades. The growth is also bolstered by rising investments in automation technologies and smart infrastructure development across the region, which heavily rely on satellite navigation capabilities for accurate positioning and timing services.
Remaining Segments in Application
The other significant segments in the North America satellite bus market include Earth observation and space observation applications. The Earth observation segment plays a crucial role in climate monitoring, natural resource management, and disaster response activities, while the space observation segment focuses on studying celestial bodies, conducting space research, and supporting various scientific missions. These segments collectively contribute to the market's diversity and technological advancement, with Earth observation particularly gaining prominence due to increasing environmental monitoring needs and climate change studies. The space observation segment continues to drive innovation in satellite bus technology through requirements for advanced imaging and data collection capabilities.
Segment Analysis: Satellite Mass
100-500kg Segment in North America Satellite Bus Market
The 100-500kg satellite segment, commonly referred to as minisatellites, dominates the North America satellite bus market with approximately 65% market share in 2024. These satellites have become increasingly popular due to advancements in miniaturization technology and decreasing launch service costs. The segment's prominence is driven by various applications, including Earth observation, remote sensing, scientific research, and communication. These satellites are particularly favored for constellation deployments, where multiple satellites work together to provide comprehensive Earth surface coverage or support specific mission objectives. Major companies have developed specialized satellite buses for this weight range, offering modular and flexible designs that can be customized to meet specific mission requirements.
10-100kg Segment in North America Satellite Bus Market
The 10-100kg segment, representing microsatellites, is projected to experience the highest growth rate of approximately 30% during 2024-2029. This remarkable growth is attributed to the increasing demand for cost-effective satellite solutions with shorter development timelines. The segment's expansion is driven by applications such as Earth observation, communications, technology development, and satellite positioning. The flexibility and responsiveness of microsatellites to new technological opportunities make them particularly attractive for various commercial and military applications. Companies are actively developing new and advanced microsatellite bus technologies with enhanced capabilities to support aggressive, disruptive satellite missions in this weight category.
Remaining Segments in Satellite Mass
The remaining segments in the market include satellites below 10kg (nanosatellites), 500-1000kg (medium-sized satellites), and above 1000kg (large satellites). Nanosatellites are gaining traction for their cost-effectiveness and suitability for educational and research missions. Medium-sized satellites serve crucial roles in communications and Earth observation, offering a balance between capability and cost. Large satellites, primarily used for complex communication and broadcasting missions, continue to be essential for applications requiring high-capacity data transmission and global coverage. Each of these segments serves specific market needs and contributes to the overall ecosystem of satellite applications.
Segment Analysis: Orbit Class
LEO Segment in North America Satellite Bus Market
Low Earth Orbit (LEO) dominates the North American satellite bus market, commanding approximately 73% of the total market value in 2024. This significant market share is driven by the increasing adoption of LEO satellites for various applications, including Earth observation, remote sensing, and communication networks. The segment's dominance is further strengthened by the growing deployment of satellite constellations by major commercial operators for global connectivity solutions. LEO satellites are particularly attractive due to their lower latency, reduced power requirements, and cost-effectiveness compared to satellites in higher orbits. The segment has seen substantial growth due to technological advancements in miniaturization and the increasing demand for high-speed internet connectivity and real-time Earth observation capabilities.
MEO Segment in North America Satellite Bus Market
The Medium Earth Orbit (MEO) segment is experiencing the fastest growth in the North American satellite bus market, with a projected growth rate of approximately 18% during 2024-2029. This remarkable growth is primarily driven by increasing investments in navigation and communication satellite systems operating in MEO. The segment's expansion is supported by the rising demand for reliable global positioning systems and the deployment of advanced communication networks. MEO satellites offer an optimal balance between coverage area and signal latency, making them particularly suitable for navigation systems and telecommunications applications. The segment is witnessing increased adoption from both commercial and military sectors, with new technological developments enabling enhanced capabilities for various applications, including global navigation satellite systems and broadband communications.
Remaining Segments in Orbit Class
The Geostationary Earth Orbit (GEO) segment continues to play a crucial role in the North American satellite bus market, particularly for applications requiring constant coverage of specific geographical areas. GEO satellites are essential for broadcasting, weather monitoring, and certain military communications applications where continuous coverage of a fixed area is required. Despite having a smaller market share compared to LEO and MEO segments, GEO satellites maintain their importance in applications where stable, long-term coverage of specific regions is crucial. The segment continues to evolve with technological advancements in high-throughput satellites and electric propulsion systems, enabling more efficient and capable GEO satellite platforms.
Segment Analysis: End User
Commercial Segment in North America Satellite Bus Market
The commercial segment dominates the North America satellite bus market, accounting for approximately 68% of the total market value in 2024. This significant market share is driven by the increasing adoption of satellite technology by private companies for various applications, including telecommunications, Earth observation, and internet connectivity. Major technology companies like SpaceX and Amazon are leading this commercial push with ambitious satellite constellation projects. The segment's growth is further supported by the rising demand for satellite-based services in urban and rural areas, particularly for broadband internet connectivity and data services. Commercial satellite operators are increasingly investing in advanced satellite bus technologies to improve performance, reduce costs, and enhance service delivery capabilities. The segment is also benefiting from the growing trend of space commercialization and the increasing participation of private companies in space exploration and satellite deployment activities.
Military & Government Segment in North America Satellite Bus Market
The military and government segment is experiencing robust growth in the North America satellite bus market, with a projected growth rate of approximately 18% during 2024-2029. This growth is primarily driven by increasing defense budgets and the growing emphasis on space-based military capabilities. The segment is witnessing significant developments in satellite technology for military applications, including advanced reconnaissance, secure communications, and navigation systems. The U.S. Department of Defense's increasing focus on space superiority and the need for enhanced satellite-based surveillance and communication capabilities are major growth drivers. Military satellites require more specialized and robust satellite buses compared to commercial satellites, as they need to operate in harsh environments and withstand extreme conditions. The segment is also benefiting from various government initiatives to modernize space infrastructure and enhance national security capabilities through advanced satellite systems.
Remaining Segments in End User Segmentation
The other end-user segment in the North America satellite bus market primarily consists of research institutions, universities, and non-governmental organizations. These organizations play a crucial role in advancing satellite technology through various research and development initiatives. Academic institutions are particularly active in developing small satellites for scientific research and educational purposes. Research organizations are focusing on innovative satellite bus designs and technologies that could potentially transform the industry. Non-governmental organizations are utilizing satellite technology for various applications, including environmental monitoring, disaster management, and humanitarian missions. The segment benefits from various research grants and funding programs that support space-related research and development activities.
Competitive Landscape
Top Companies in North America Satellite Bus Market
The North American satellite bus market is characterized by continuous innovation and strategic developments from major players like Lockheed Martin Corporation, Airbus SE, Northrop Grumman Corporation, and Thales Group. Companies are focusing on developing advanced satellite bus platforms with enhanced capabilities for various applications, including communications, Earth observation, and navigation. The industry witnesses frequent collaborations between manufacturers and space agencies, particularly for military and government projects. Market leaders are investing heavily in research and development to create more efficient, cost-effective satellite bus solutions while expanding their manufacturing facilities to meet growing demand. There is also a notable trend towards developing modular and scalable satellite platform designs that can accommodate various payload requirements and mission specifications.
Market Dominated by Established Defense Contractors
The North American satellite bus market exhibits a relatively consolidated structure dominated by large defense contractors and aerospace conglomerates with established relationships with government agencies and military organizations. These companies possess extensive manufacturing capabilities, proprietary technologies, and deep industry expertise built over decades of operations. The market has high entry barriers due to the complex technical requirements, substantial capital investments needed, and stringent regulatory compliance standards.
The competitive landscape is shaped by long-term contracts, particularly in the military and government segments, which provide stable revenue streams for established players. Market consolidation occurs through strategic acquisitions, as demonstrated by Northrop Grumman's acquisition of Orbital ATK, which enhanced its space systems capabilities. Companies are also forming strategic partnerships and joint ventures to combine complementary capabilities and expand their market presence, particularly in emerging satellite applications and technologies.
Innovation and Adaptability Drive Future Success
Success in the North American satellite bus market increasingly depends on companies' ability to innovate and adapt to evolving customer requirements while maintaining cost competitiveness. Incumbent players must continue investing in next-generation technologies, including artificial intelligence, advanced materials, and improved propulsion systems, while optimizing their production processes to reduce costs and delivery times. Companies need to develop flexible satellite platform designs that can accommodate various mission requirements and payload configurations while maintaining high reliability and performance standards.
For new entrants and smaller players, success lies in identifying and serving niche market segments or developing innovative solutions that address specific customer needs not met by larger competitors. Companies must also navigate complex regulatory requirements, particularly in military and government applications, while building strong relationships with key stakeholders. The ability to offer comprehensive end-to-end solutions, including integration services and post-launch support, will become increasingly important as customers seek turnkey solutions. Additionally, companies must maintain strong cybersecurity measures and adapt to evolving space regulations to ensure long-term success in the market. The development of robust satellite components and satellite structure will be crucial in meeting these demands.
North America Satellite Bus Industry Leaders
Airbus SE
Honeywell International Inc.
Lockheed Martin Corporation
Northrop Grumman Corporation
Thales
- *Disclaimer: Major Players sorted in no particular order


Recent Industry Developments
- October 2020: NanoAvionics expanded its presence in the United Kingdom by beginning operations at its new facility in Basingstoke for satellite assembly, integration, and testing (AIT), as well as sales, technical support, and R&D activities.
- August 2020: SNC introduced two new satellite platforms to its spacecraft offerings, the SN-200M satellite bus, designed for medium Earth orbit (MEO), and SN-1000.
- July 2020: SNC was awarded a contract by the Defense Innovation Unit (DIU) for repurposing its Shooting Star transport vehicle to an Unmanned Orbital Outpost, a scalable and autonomous space.


North America Satellite Bus Market Report Scope
Communication, Earth Observation, Navigation, Space Observation, Others are covered as segments by Application. 10-100kg, 100-500kg, 500-1000kg, Below 10 Kg, above 1000kg are covered as segments by Satellite Mass. GEO, LEO, MEO are covered as segments by Orbit Class. Commercial, Military & Government are covered as segments by End User.| Communication |
| Earth Observation |
| Navigation |
| Space Observation |
| Others |
| 10-100kg |
| 100-500kg |
| 500-1000kg |
| Below 10 Kg |
| above 1000kg |
| GEO |
| LEO |
| MEO |
| Commercial |
| Military & Government |
| Other |
| Application | Communication |
| Earth Observation | |
| Navigation | |
| Space Observation | |
| Others | |
| Satellite Mass | 10-100kg |
| 100-500kg | |
| 500-1000kg | |
| Below 10 Kg | |
| above 1000kg | |
| Orbit Class | GEO |
| LEO | |
| MEO | |
| End User | Commercial |
| Military & Government | |
| Other |


Market Definition
- Application - Various applications or purposes of the satellites are classified into communication, earth observation, space observation, navigation, and others. The purposes listed are those self-reported by the satellite’s operator.
- End User - The primary users or end users of the satellite is described as civil (academic, amateur), commercial, government (meteorological, scientific, etc.), military. Satellites can be multi-use, for both commercial and military applications.
- Launch Vehicle MTOW - The launch vehicle MTOW (maximum take-off weight) means the maximum weight of the launch vehicle during take-off, including the weight of payload, equipment and fuel.
- Orbit Class - The satellite orbits are divided into three broad classes namely GEO, LEO, and MEO. Satellites in elliptical orbits have apogees and perigees that differ significantly from each other and categorized satellite orbits with eccentricity 0.14 and higher as elliptical.
- Propulsion tech - Under this segment, different types of satellite propulsion systems have been classified as electric, liquid-fuel and gas-based propulsion systems.
- Satellite Mass - Under this segment, different types of satellite propulsion systems have been classified as electric, liquid-fuel and gas-based propulsion systems.
- Satellite Subsystem - All the components and subsystems which includes propellants, buses, solar panels, other hardware of satellites are included under this segment.
| Keyword | Definition |
|---|---|
| Attitude Control | The orientation of the satellite relative to the Earth and the sun. |
| INTELSAT | The International Telecommunications Satellite Organization operates a network of satellites for international transmission. |
| Geostationary Earth Orbit (GEO) | Geostationary satellites in Earth orbit 35,786 km (22,282 mi) above the equator in the same direction and at the same speed as the earth rotates on its axis, making them appear fixed in the sky. |
| Low Earth Orbit (LEO) | Low Earth Orbit satellites orbit from 160-2000km above the earth, take approximately 1.5 hours for a full orbit and only cover a portion of the earth’s surface. |
| Medium Earth Orbit (MEO) | MEO satellites are located above LEO and below GEO satellites and typically travel in an elliptical orbit over the North and South Pole or in an equatorial orbit. |
| Very Small Aperture Terminal (VSAT) | Very Small Aperture Terminal is an antenna that is typically less than 3 meters in diameter |
| CubeSat | CubeSat is a class of miniature satellites based on a form factor consisting of 10 cm cubes. CubeSats weigh no more than 2 kg per unit and typically use commercially available components for their construction and electronics. |
| Small Satellite Launch Vehicles (SSLVs) | Small Satellite Launch Vehicle (SSLV) is a three-stage Launch Vehicle configured with three Solid Propulsion Stages and a liquid propulsion-based Velocity Trimming Module (VTM) as a terminal stage |
| Space Mining | Asteroid mining is the hypothesis of extracting material from asteroids and other asteroids, including near-Earth objects. |
| Nano Satellites | Nanosatellites are loosely defined as any satellite weighing less than 10 kilograms. |
| Automatic Identification System (AIS) | Automatic identification system (AIS) is an automatic tracking system used to identify and locate ships by exchanging electronic data with other nearby ships, AIS base stations, and satellites. Satellite AIS (S-AIS) is the term used to describe when a satellite is used to detect AIS signatures. |
| Reusable launch vehicles (RLVs) | Reusable launch vehicle (RLV) means a launch vehicle that is designed to return to Earth substantially intact and therefore may be launched more than one time or that contains vehicle stages that may be recovered by a launch operator for future use in the operation of a substantially similar launch vehicle. |
| Apogee | The point in an elliptical satellite orbit which is farthest from the surface of the earth. Geosynchronous satellites which maintain circular orbits around the earth are first launched into highly elliptical orbits with apogees of 22,237 miles. |


Research Methodology
Mordor Intelligence follows a four-step methodology in all our reports.
- Step-1: Identify Key Variables: In order to build a robust forecasting methodology, the variables and factors identified in Step-1 are tested against available historical market numbers. Through an iterative process, the variables required for market forecast are set and the model is built on the basis of these variables.
- Step-2: Build a Market Model: Market-size estimations for the historical and forecast years have been provided in revenue and volume terms. For sales conversion to volume, the average selling price (ASP) is kept constant throughout the forecast period for each country, and inflation is not a part of the pricing.
- Step-3: Validate and Finalize: In this important step, all market numbers, variables and analyst calls are validated through an extensive network of primary research experts from the market studied. The respondents are selected across levels and functions to generate a holistic picture of the market studied.
- Step-4: Research Outputs: Syndicated Reports, Custom Consulting Assignments, Databases & Subscription Platforms.


