Russia Commercial Vehicle Market Size and Share
Market Overview
| Study Period | 2019 - 2030 |
|---|---|
| Forecast Data Period | 2025 - 2030 |
| Historical Data Period | 2019 - 2023 |
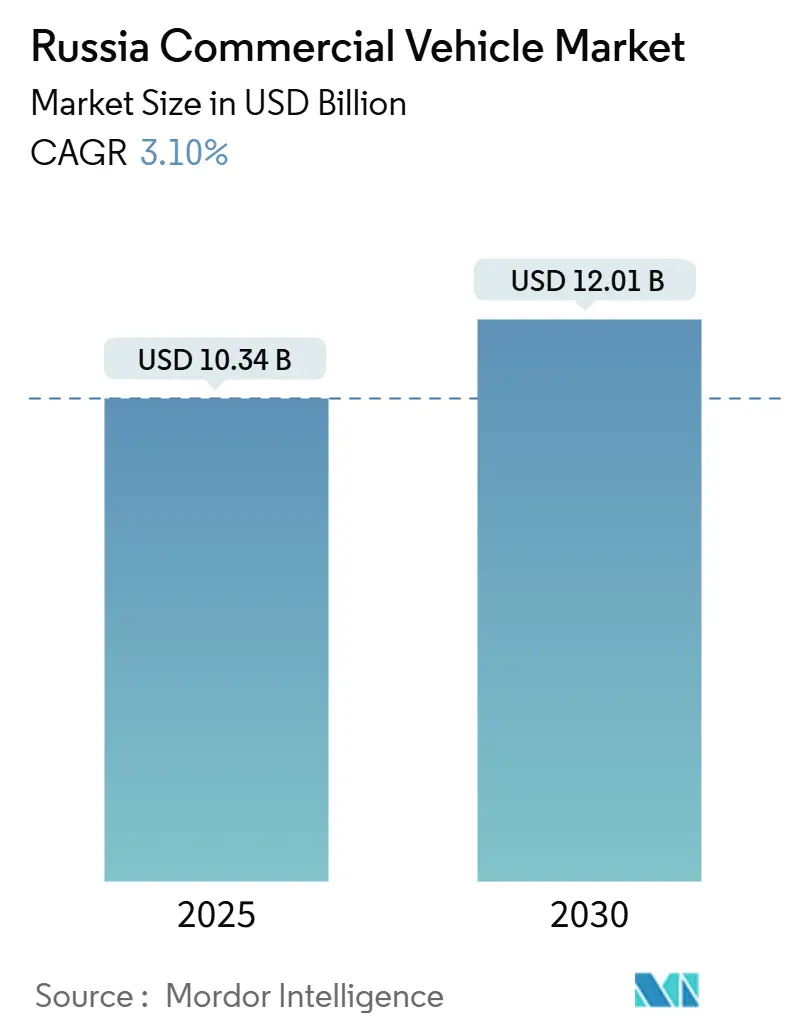
| Market Size (2025) | USD 10.34 Billion |
| Market Size (2030) | USD 12.01 Billion |
| Growth Rate (2025 - 2030) | 3.10% CAGR |
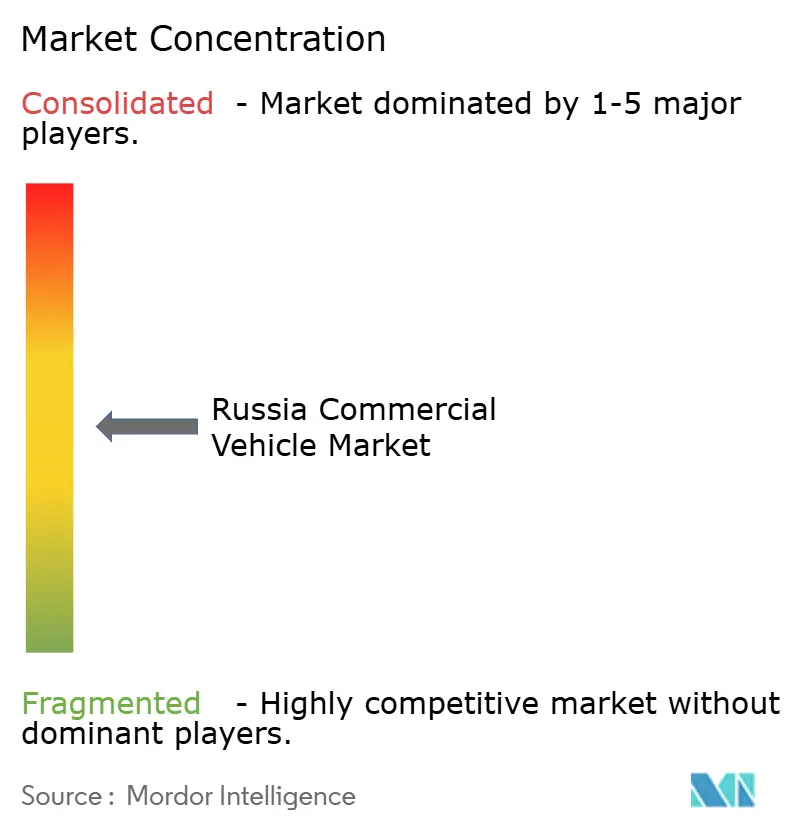
| Market Concentration | Medium |
Major Players
*Disclaimer: Major Players sorted in no particular order Image © Mordor Intelligence. Reuse requires attribution under CC BY 4.0. |
|
Russia Commercial Vehicle Market Analysis by Mordor Intelligence
The Russia commercial vehicle market size stands at USD 10.34 billion in 2025 and is projected to reach USD 12.01 billion by 2030, advancing at a 3.10% CAGR over 2025-2030. This outlook hides a deep restructuring as sanctions, new trade corridors, and fiscal interventions reset supply chains, financing norms, and brand hierarchies. Chinese imports now dominate new registrations, domestic manufacturers rely heavily on government procurement, and leasing rates above 30% continue to stretch replacement cycles. Urban logistics demand has moved sharply toward light commercial vehicles, while gas-based propulsion gains traction wherever refueling infrastructure arrives. Competitive positioning hinges on price, localization depth, and access to working capital rather than on technology differentiation alone, making the Russia commercial vehicle market unusually sensitive to fiscal and regulatory signals.
Key Report Takeaways
- By vehicle type, light commercial vehicles captured 46.13% of the Russian commercial vehicle market share in 2024 and are forecast to grow at an 8.24% CAGR through 2030.
- By tonnage, the up-to-3.5-ton segment accounted for 40.28% share of the Russian commercial vehicle market size in 2024 and is projected to expand at a 7.53% CAGR to 2030.
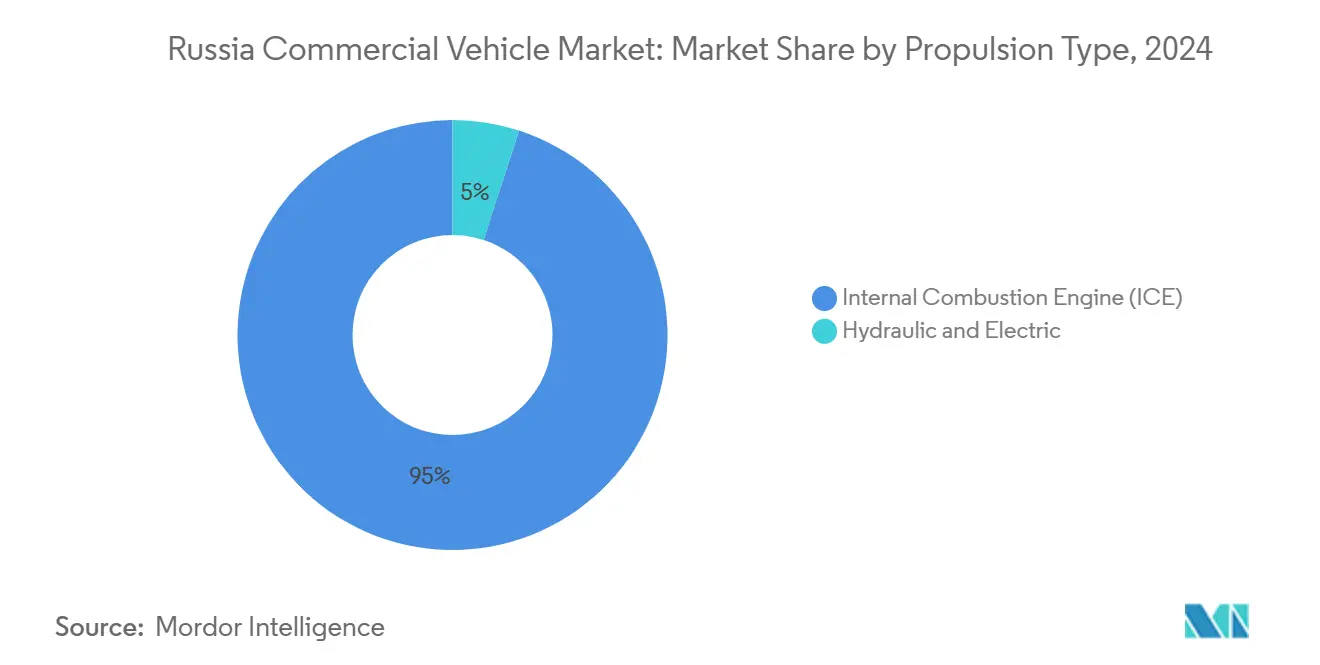
- By propulsion, internal combustion engines held 95.02% share of the Russia commercial vehicle market in 2024, while hydraulic and electric alternatives are advancing at an 18.07% CAGR over 2025-2030.
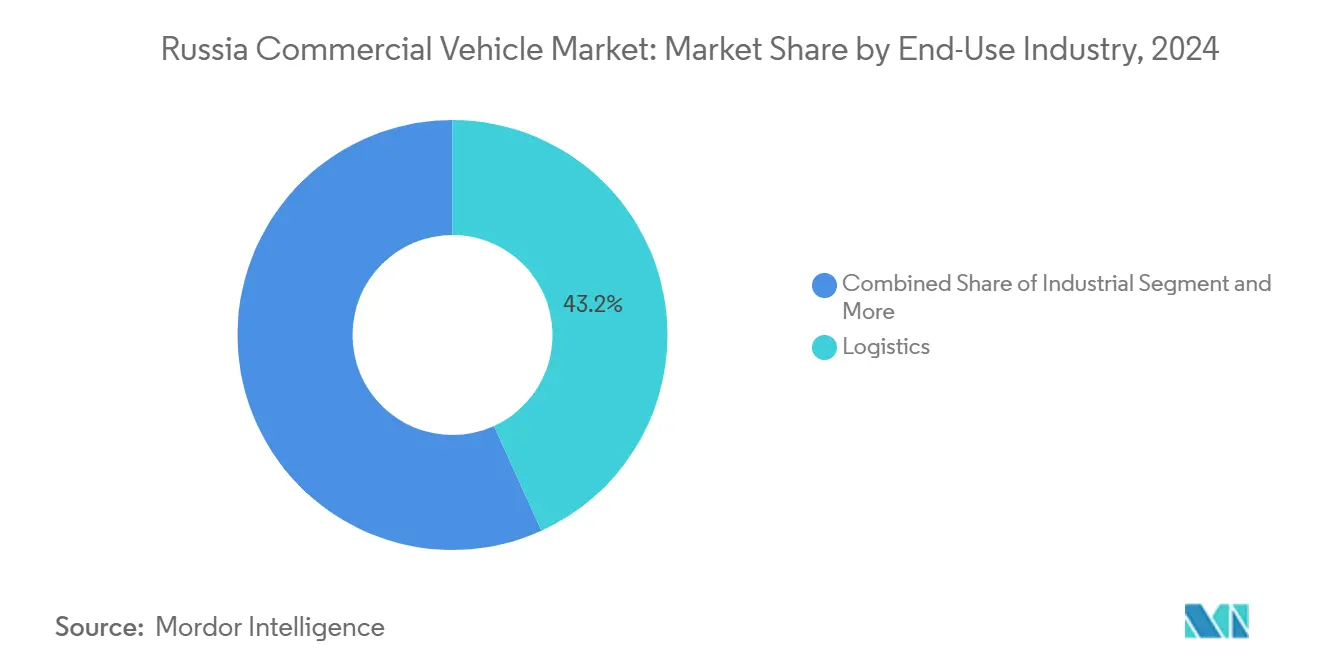
- By end-use industry, logistics applications led with 43.17% revenue share in 2024 and are forecast to grow at a 9.12% CAGR through 2030.
- By vehicle class, Class 1–3 platforms commanded 48.26% of the Russian commercial vehicle market in 2024 and are set to rise at an 8.36% CAGR to 2030.
Russia Commercial Vehicle Market Trends and Insights
Drivers Impact Analysis*
| Driver | (~) % Impact on CAGR Forecast | Geographic Relevance | Impact Timeline |
|---|---|---|---|
| Logistics E-Commerce Boom | +0.9% | Moscow, St Petersburg, major urban centers | Short term (≤ 2 years) |
| State Fleet-Renewal Subsidies | +0.7% | Nationwide, federal procurement hubs | Medium term (2-4 years) |
| Sino-Russian Power-Train Localization | +0.6% | Tatarstan, Nizhny Novgorod clusters | Long term (≥ 4 years) |
| Surge in Chinese Truck Imports | +0.4% | Border provinces, port regions | Short term (≤ 2 years) |
| Freight-Rate Inflation Favoring Fuel-Efficient Trucks | +0.4% | Long-haul corridors | Medium term (2-4 years) |
| CNG/LNG Price Advantage | +0.3% | Gas-rich regions | Long term (≥ 4 years) |
| Source: Mordor Intelligence | |||
Logistics E-commerce Boom Elevating Last-Mile LCV Demand
E-commerce logistics transformation drives structural demand shifts toward light commercial vehicles as delivery expectations compress to 1-2 day standards across Russian metropolitan markets. Online retail penetration accelerates fleet modernization requirements, particularly in the up to 3.5-ton segment, where maneuverability and fuel efficiency determine profitability margins. Municipal delivery restrictions and environmental compliance requirements favor smaller, cleaner vehicles over traditional heavy-duty platforms. The shift toward platform-based logistics and algorithmic dispatch systems rewards operators who invest in connected, fuel-efficient light commercial vehicles capable of supporting real-time tracking and route optimization technologies.
State Fleet-Renewal Subsidies Favoring Domestic OEMs
Government Resolution No. 1875 establishes preferential procurement regimes that create material advantages for Russian-origin commercial vehicles in public and quasi-public fleet purchases[1]"Letter of the Ministry of Finance of the Russian Federation dated 31.01.2025 No 24-01-06/8697 "On the Application of the Provisions of the Decree of the Government of the Russian Federation dated December 23, 2024 No 1875 "On Measures to Provide National Treatment in the Procurement of Goods, Works, Services for State and Municipal Needs, Procurement of Goods, Works, Services by Certain Types of Legal Entities," Finance Russia, minfin.gov.ru. . The national regime framework applies prohibition, restriction, and preference measures across federal, regional, and municipal procurement, with EAEU member state suppliers receiving parity treatment while foreign competitors face systematic disadvantages. This regulatory architecture creates sustained demand tailwinds for domestic OEMs capable of meeting certification and registry requirements, though implementation timelines extend through 2027 as supply chains adapt to new compliance frameworks.
Growing Sino-Russian JV Localization of Power-Train Components
Chinese manufacturers establish deeper integration through joint ventures and technology transfer agreements that reduce import dependencies while maintaining cost competitiveness. SINOTRUK, SHACMAN, and FAW Jiefang expand local assembly operations beyond simple CKD arrangements, incorporating Russian suppliers for non-critical components and establishing service networks that support long-term market presence. The European Commission's documentation of Chinese state support across financing, grants, tax preferences, and input provision reveals systematic cost advantages that extend beyond Russia to global markets, suggesting sustained competitive pressure on domestic manufacturers. Localization efforts focus on power-train components where Russian suppliers possess metallurgical and engineering capabilities, creating hybrid value chains that combine Chinese design and manufacturing expertise with Russian materials and labor. These partnerships accelerate technology transfer in areas such as emission control systems and fuel injection technologies, positioning joint ventures to capture market share as domestic content requirements tighten over the forecast period.
Surge in Chinese Truck Imports Lowering Fleet CAPEX
Chinese commercial vehicle imports fundamentally alter fleet economics by offering comparable functionality at substantially lower acquisition costs than domestic alternatives. Import volumes from China rose sharply across multiple vehicle categories, with Chinese manufacturers capturing dominant positions in segments previously served by Russian or Western OEMs. However, recent safety violations and regulatory enforcement actions demonstrate Moscow's willingness to restrict Chinese imports when domestic industry interests align with safety concerns, creating uncertainty around long-term import access. Fleet operators balance lower upfront costs against potential service and parts availability risks, with many choosing Chinese imports for non-critical applications while maintaining domestic vehicles for core operations requiring maximum uptime and support.
Restraints Impact Analysis*
| Restraint | (~) % Impact on CAGR Forecast | Geographic Relevance | Impact Timeline |
|---|---|---|---|
| Leasing Interest Rates Above 30% | -0.9% | Nationwide, Thin-Banking Provinces | Short Term (≤ 2 Years) |
| Higher Utilization Fees on Imports | -0.5% | Import-Heavy Regions | Medium Term (2-4 Years) |
| Shortage of Drivers and Mechanics | -0.3% | Tier-2 Cities, Rural Hubs | Long Term (≥ 4 Years) |
| Sanctions Blocking Euro-6 Electronics | -0.2% | Premium Segments Countrywide | Long Term (≥ 4 Years) |
| Source: Mordor Intelligence | |||
Over 30% Leasing Interest Rates Suppressing Replacement Cycles
Elevated financing costs create systemic barriers to fleet modernization as commercial vehicle operators defer replacement decisions and extend service intervals beyond optimal economic thresholds. Central Bank monetary policy maintains restrictive interest rates that translate into leasing costs exceeding 30% for many commercial vehicle transactions, fundamentally altering fleet investment calculations and pushing operators toward used vehicle markets or extended maintenance programs. The logistics sector crisis reflects these financing constraints, with approximately one-third of Russian logistics companies facing bankruptcy risks due to unsustainable debt service obligations. High interest rates compound operational pressures from falling freight tariffs and rising fuel costs, creating a deflationary spiral where fleet operators cannot generate sufficient returns to justify new vehicle acquisitions. Financial institutions' risk assessment models penalize commercial vehicle lending due to collateral depreciation concerns and sector volatility, further constraining credit availability for fleet expansion and modernization initiatives.
Rising Utilization (Scrappage) Fees on Imported CVs
Escalating utilization fees on imported commercial vehicles create material cost disadvantages that shift competitive dynamics toward domestic manufacturers while constraining overall market growth. Fee increases of 75-80% in 2025 represent significant cost inflation for operators dependent on imported vehicles, particularly affecting Chinese imports that previously competed primarily on acquisition price advantages. These regulatory costs function as de facto tariffs that protect domestic industry while generating fiscal revenues, though they simultaneously reduce fleet operators' purchasing power and delay replacement cycles across the market. Utilization fee structures create asymmetric impacts across vehicle categories and end-use applications, with smaller operators and specialized applications bearing disproportionate cost burdens. The policy framework signals government intent to reduce import dependencies, yet implementation creates short-term market distortions that suppress overall demand while domestic capacity remains insufficient to meet replacement requirements at competitive price points.
*Our forecasts treat driver/restraint impacts as directional, not additive. The impact forecasts reflect baseline growth, mix effects, and variable interactions.
Segment Analysis
By Propulsion Type: ICE Dominance Faces Alternative Fuel Pressure
Internal Combustion Engine propulsion maintains overwhelming market control with 95.02% share in 2024, yet Hydraulic and Electric alternatives accelerate at 18.07% CAGR through 2030, driven by energy price arbitrage and environmental compliance requirements. CNG and LNG adoption gains momentum as natural gas pricing advantages create compelling operational economics for fleet operators, particularly in long-haul and heavy-duty applications where fuel costs represent substantial operational expenses. Diesel fuel prices increased 9.6% in 2024, with further increases of 3.4% recorded in early 2025, pushing operators toward alternative fuel technologies that offer cost stability and reduced exposure to petroleum price volatility[2]"Rising fuel prices in Russia and in the world in 2025: impact on the cargo transportation market," Zavgar, zavgar.online..
Government support for CNG/LNG infrastructure development creates network effects that accelerate adoption rates in gas-rich regions and industrial corridors. Electric propulsion faces infrastructure constraints and battery cost challenges, though urban delivery applications increasingly favor electric light commercial vehicles for regulatory compliance and operational cost advantages. Hybrid systems emerge as transitional technologies that combine ICE reliability with electric efficiency, particularly in stop-and-go urban applications where regenerative braking provides measurable fuel savings.


By Vehicle Type: LCV Leadership Driven by Urban Logistics
Light Commercial Vehicles command 46.13% market share in 2024 and sustain the fastest growth at 8.24% CAGR through 2030, reflecting structural shifts toward urban logistics and last-mile delivery solutions. E-commerce expansion and changing consumer expectations drive outsized demand for maneuverable, fuel-efficient vehicles capable of navigating congested urban environments while meeting delivery time requirements. Medium Commercial Vehicles serve specialized applications in construction and regional distribution, while Heavy Commercial Vehicles face cyclical pressures from reduced infrastructure spending and elevated financing costs that delay fleet modernization.
The BAZ truck production initiative demonstrates domestic capacity expansion efforts, with initial production of 200 units in 2025 scaling to 2,000 units by 2027, though volumes remain modest relative to overall market demand. LCV dominance reflects urbanization trends and regulatory environments that favor smaller, cleaner vehicles over traditional heavy-duty platforms in metropolitan markets. Fleet operators increasingly prioritize total cost of ownership over acquisition price, driving demand for vehicles that optimize fuel efficiency, maintenance costs, and regulatory compliance across diverse operating environments.
By Tonnage: Sub-3.5 Ton Segment Captures Urban Delivery Growth
The up to 3.5-ton segment holds 40.28% market share in 2024 and grows at 7.53% CAGR through 2030, driven by urban delivery requirements and regulatory frameworks that favor lighter platforms. This tonnage category benefits from simplified licensing requirements, reduced operational restrictions, and lower total cost of ownership compared to heavier alternatives, making it attractive for small and medium enterprises entering commercial transport markets. The 3.5 to 6-ton segment serves specialized applications requiring greater payload capacity while maintaining urban maneuverability, while vehicles above 6 tons face headwinds from financing constraints and reduced infrastructure investment.
Autonomous truck deployment initiatives target the above 6-ton segment for highway applications, with 100 driverless trucks planned for Russian highways in 2025, though implementation focuses on controlled environments and specific route corridors. Weight-based regulations and urban access restrictions create structural advantages for lighter vehicles in metropolitan markets, while fuel efficiency improvements and maintenance cost reductions favor operators who optimize fleet composition around specific tonnage requirements rather than pursuing maximum payload capacity across all applications.
By End-Use Industry: Logistics Sector Drives Market Expansion
Logistics applications dominate with 43.17% market share in 2024 and accelerate at 9.12% CAGR through 2030, reflecting e-commerce growth and supply chain modernization requirements across Russian metropolitan markets. Construction and Mining applications face cyclical pressures from reduced government infrastructure spending and commodity price volatility, though specialized vehicle requirements maintain steady demand for heavy-duty platforms. Industrial applications serve manufacturing and energy sector requirements, while Others encompass municipal services and specialized transport needs.
In April 2025, Russian Railways reported a loading volume of 93 million tons, marking a 9% drop from the previous year's 100 million tons. This decline prominently impacted major cargo categories, including building materials, coal, oil, and metals[3]"Reduction in the main types of cargo," Logistics News, lognews.ru..

By Vehicle Class: Class 1-3 Dominance Reflects Urban Focus
Class 1 to 3 vehicles capture 48.26% market share in 2024 and grow at 8.36% CAGR through 2030, driven by urban delivery requirements and regulatory frameworks that favor lighter commercial platforms. These classes benefit from simplified licensing, reduced operational restrictions, and lower total cost of ownership, making them attractive for emerging logistics companies and urban delivery services. Class 5 to 6 vehicles serve medium-duty applications requiring greater payload capacity while maintaining operational flexibility, while Class 7 to 8 vehicles face headwinds from financing constraints and specialized application requirements.
The shift toward lighter vehicle classes reflects changing freight patterns as e-commerce and urban logistics drive demand for frequent, smaller deliveries rather than traditional bulk transport applications. Regulatory compliance costs and environmental restrictions favor lighter platforms in metropolitan markets, while fuel efficiency improvements and maintenance cost advantages create compelling economics for operators who optimize fleet composition around specific class requirements rather than pursuing maximum capacity across all applications.
Geography Analysis
Moscow and St Petersburg combined generated nearly 38% of the Russia commercial vehicle market in 2024 thanks to dense retail hubs, large municipal budgets, and superior service networks. Federal transport subsidies of RUB 4.79 billion and RUB 1.34 billion, respectively, financed bus renewals, snowplows, and postal vans. Surrounding oblasts leverage these capitals for spare-parts logistics, making dealer proximity a purchase determinant.
The Volga Federal District supplies major assembly plants and metallurgy feedstock, positioning Tatarstan and Nizhny Novgorod as joint-venture hotspots. KAMAZ’s headquarters in Naberezhnye Chelny anchors a supplier belt that blends Russian castings with Chinese power-train kits. The Urals pivot toward off-road rigid frames for mining, with URAL Automotive maintaining robust after-sales networks under harsh-climate duty cycles.
Far-Eastern border areas absorb the highest ratio of Chinese imports, aided by roll-on/roll-off ferry lines and bilateral yuan-ruble settlements. Yet new safety audits in late 2024 cut registrations of a few Chinese tractor models, reflecting federal leverage over the trade tap. Siberia’s energy corridors stimulate LNG truck demand because of abundant gas infrastructure, while local policy grants tax rebates on methane tanks.
Competitive Landscape
The Russian commercial vehicle market shows moderate concentration. Domestic leaders KAMAZ, GAZ, and URAL struggle with rising component costs and weak ruble purchasing power. Chinese entrants SINOTRUK, SHACMAN, FAW Jiefang, and Dongfeng deliver landed prices that undercut local list tags by double-digit margins even after higher utilization fees.
Strategically, Chinese brands localize weld shops and paint lines to qualify for domestic-preference tenders. Russian OEMs reply by targeting export outlets. KAMAZ inked an agreement to assemble trucks in Senegal, while AvtoVAZ plans to pick up Lada in Ethiopia. GAZ promotes factory CNG conversions as a hedge against diesel price spikes.
Technology competition centers on telematics, LNG tanks, and Euro-5 after-treatment systems that avoid sanction-restricted Euro-6 electronics. Heinzmann fuel-management modules, tested in motor-sport rallies, will migrate into next-generation mid-duty trucks by 2027. Domestic wiring harnesses and sensors suppliers scale up, yet most high-value ECUs remain sourced from China.
Russia Commercial Vehicle Industry Leaders
-
KAMAZ
-
SINOTRUK
-
GAZ Group
-
SHACMAN
-
FAW Trucks Co.,Ltd.
- *Disclaimer: Major Players sorted in no particular order

Recent Industry Developments
- February 2025: In Russia, fuel price increases accelerate with diesel rising 3.4% in early 2025, following a 9.6% increase in 2024, driving fleet operators toward alternative fuel technologies and efficiency improvements.
- January 2025: Russian vehicle production increases 30-40% in 2024 according to Deputy PM Denis Manturov, with multiple manufacturers planning capacity expansions and new model launches including Moskvich 8 crossover and revived Volga brand production targeting 100,000 units annually.


Russia Commercial Vehicle Market Report Scope
| Internal Combustion Engine (ICE) |
| Hydraulic and Electric |
| Light Commercial Vehicles (LCV) |
| Medium Commercial Vehicles (MCV) |
| Heavy Commercial Vehicles (HCV) |
| Up to 3.5 Ton |
| 3.5 to 6 Ton |
| Above 6 Ton |
| Construction and Mining |
| Logistics |
| Industrial |
| Others |
| Class 1 to 3 |
| Class 5 to 6 |
| Class 7 to 8 |
| By Propulsion Type | Internal Combustion Engine (ICE) |
| Hydraulic and Electric | |
| By Vehicle Type | Light Commercial Vehicles (LCV) |
| Medium Commercial Vehicles (MCV) | |
| Heavy Commercial Vehicles (HCV) | |
| By Tonnage | Up to 3.5 Ton |
| 3.5 to 6 Ton | |
| Above 6 Ton | |
| By End-Use Industry | Construction and Mining |
| Logistics | |
| Industrial | |
| Others | |
| By Vehicle Class | Class 1 to 3 |
| Class 5 to 6 | |
| Class 7 to 8 |


Key Questions Answered in the Report
What is the current value of the Russia commercial vehicle market?
The market stands at USD 10.34 billion in 2025 and is set to reach USD 12.01 billion by 2030.
Which vehicle type sells the most units in Russia?
Light commercial vehicles lead with 46.13% share in 2024 and maintain the fastest growth to 2030.
How fast are alternative fuel trucks growing in Russia?
Hydraulic and electric trucks are expanding at an 18.07% CAGR over 2025-2030, although ICE models still dominate.
What role do state subsidies play in truck demand?
Resolution 1875 grants Russian-made trucks a 15% price preference in public tenders, boosting domestic order books.
Why are leasing rates a restraint for fleet renewal?
Interest charges above 30% make new-truck leases unaffordable for many carriers, so operators delay replacement.
Which regions favor CNG/LNG trucks?
Gas-rich corridors in Siberia and the Far East adopt CNG/LNG rigs fastest thanks to abundant fueling infrastructure.
Page last updated on:


