
Market Overview
| Study Period | 2021 - 2031 |
|---|---|
| Forecast Data Period | 2026 - 2031 |
| Base Year Market Size (2025) | 6.79 gigawatt |
| Market Volume (2026) | 7.78 gigawatt |
| Market Volume (2031) | 15.31 gigawatt |
| Growth Rate (2026 - 2031) | 14.52 % |
| Market Concentration | Medium |
Major Players *Disclaimer: Major Players sorted in no particular order Image © Mordor Intelligence. Reuse requires attribution under CC BY 4.0. | |
Romania Solar Energy Market Analysis by Mordor Intelligence
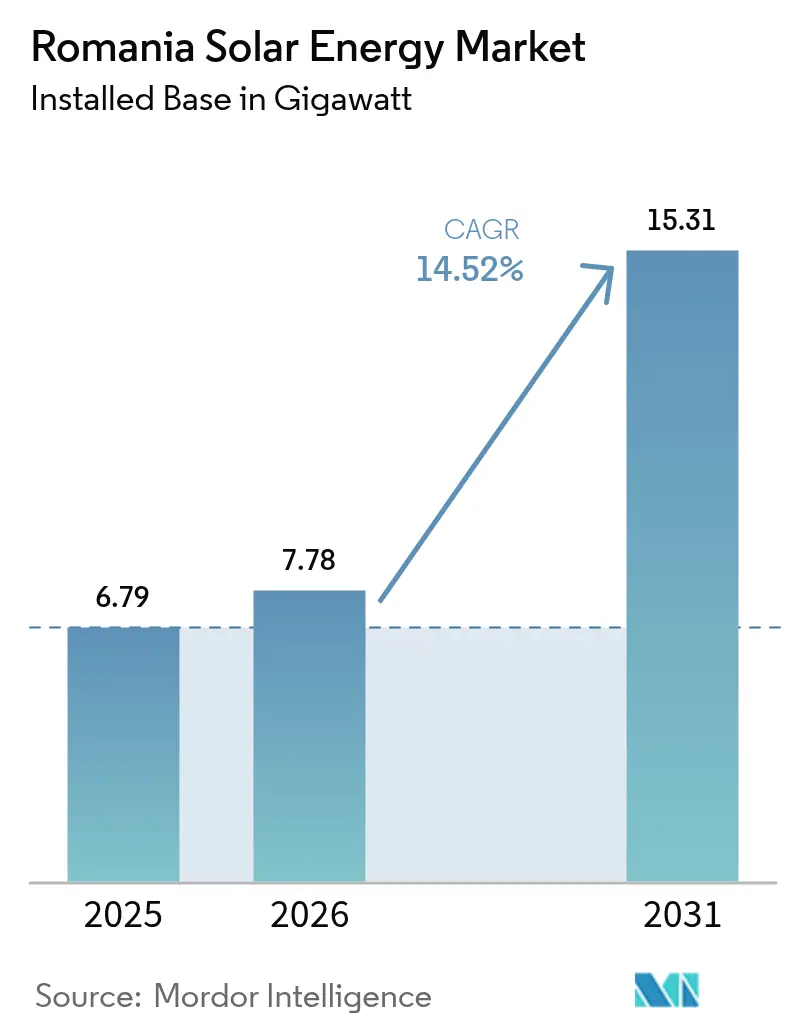
Romania Solar Energy Market size in 2026 is estimated at USD 7.78 gigawatt, growing from 2025 value of USD 6.79 gigawatt with 2031 projections showing USD 15.31 gigawatt, growing at 14.52% CAGR over 2026-2031.
This acceleration is powered by Recovery and Resilience Facility grants, streamlined dual-use agricultural rules, and surging corporate PPAs that anchor new capacity to long-term offtake contracts. Grid digitalization, falling solar PV costs, and a EUR 3 billion Contracts for Difference (CfD) scheme further enhance revenue certainty for utility-scale projects. Romania’s pivot away from coal has also re-positioned distribution utilities as active enablers of rooftop programs, while local manufacturing incentives are shortening supply chains and supporting job creation. Together, these factors advance the Romanian solar energy market as a central and eastern European deployment hub.
Key Report Takeaways
- By technology, solar photovoltaic accounted for 100.00% of the Romania solar energy market share in 2025.
- By grid type, on-grid systems dominated the Romanian solar energy market with a 95.10% share in 2025.
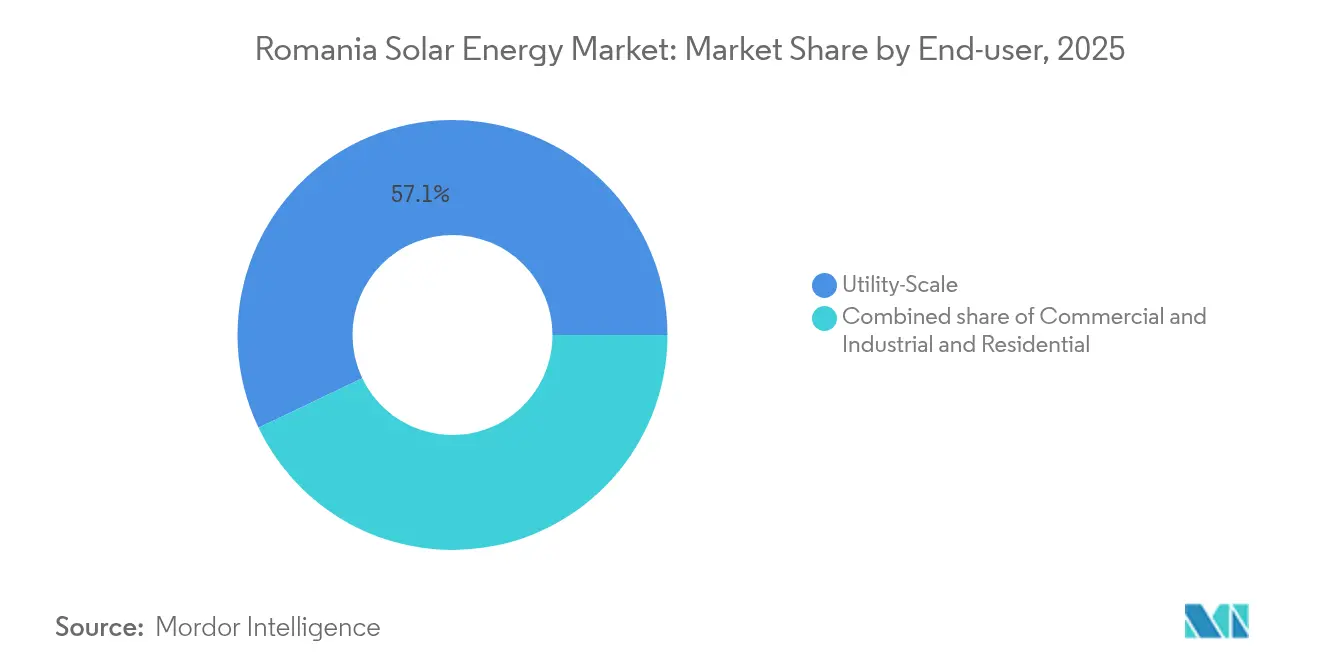
- By end-user, utility-scale plants led the Romanian solar energy market with a 57.10% share in 2025, while the residential segment is projected to grow at an 18.55% CAGR to 2031.
Note: Market size and forecast figures in this report are generated using Mordor Intelligence’s proprietary estimation framework, updated with the latest available data and insights as of 2026.
Romania Solar Energy Market Trends and Insights
Drivers Impact Analysis*
| Driver | (~) % Impact on CAGR Forecast | Geographic Relevance | Impact Timeline |
|---|---|---|---|
| EU-funded renewable stimulus (RRF) | +3.20% | National, south and west counties | Medium term (2-4 years) |
| Supportive feed-in premiums & green certificates | +2.80% | National, rural focus | Long term (≥ 4 years) |
| Corporate PPA demand surge | +2.10% | Industrial corridors nationwide | Short term (≤ 2 years) |
| Declining LCOE of solar PV | +1.90% | Global cost dynamic, local uptake | Medium term (2-4 years) |
| Grid digitalization enabling distributed PV | +1.50% | Urban and peri-urban areas | Long term (≥ 4 years) |
| Agri-PV pilots unlocking dual land use | +1.30% | Southern agricultural regions | Long term (≥ 4 years) |
| Source: Mordor Intelligence | |||
EU-funded renewable stimulus (RRF)
Romania’s National Recovery and Resilience Plan allocates EUR 2.8 billion to renewables, with an additional EUR 400 million from the Modernisation Fund dedicated to solar and wind energy. Contracts already cover 831 public-sector PV projects, totaling 296.76 MW, and are backed by €367.6 million in grants.(1)Newsweek Romania, “Fabrica de soare a României: 831 de proiecte…,” newsweek.roThese programs remove capital-cost barriers, target 3 GW of new capacity by 2026, and stimulate private co-investment that multiplies public outlays. Spillover estimates imply each public euro attracts roughly 1.1 euros of private spending EIB.ORG. The model also scales installer skills and supply-chain depth, accelerating subsequent commercial and residential solar uptake.
Supportive feed-in premiums & green certificates
The dual incentive framework combines feed-in premiums with tradable green certificates, offering stable income streams that enhance the bankability of installations up to 400 kW. Streamlined ANRE rules reduce permitting times and transaction costs, allowing small systems to monetize surplus power while enjoying premium tariffs. Although Emergency Ordinance 20/2025 removes certificate obligations for major industrial buyers, it steers those consumers toward direct solar procurement, preserving demand for new rooftop and ground-mounted plants. The blended policy approach reduces financing spreads relative to full merchant exposure.
Corporate PPA demand surge
Long-term solar PPAs are now a preferred hedge for manufacturers facing volatile wholesale prices. DRI-OMV Petrom signed a 100 GWh annual physical delivery contract, the country’s largest corporate renewable energy agreement, setting price discovery benchmarks for future deals.(2)European Investment Bank, “Investment Report 2023/2024,” eib.org Source: Green-Forum, “nextE,” green-forum.eu Independent power producers are building plants expressly around such agreements, while Emergency Ordinance 143/2021 lifted bilateral-trading restrictions and simplified risk-sharing structures. Daytime PV production coincides with industrial load profiles, making solar PPAs more attractive than wind for certain sectors.
Declining LCOE of solar PV
Module prices fell by about 60% between 2022 and 2024, enabling Romanian projects to secure CfD strike prices near EUR 51/MWh—already under fossil-fuel benchmarks. Domestic manufacturing is emerging through a 1.5 GW-per-year plant, which is receiving EUR 32.92 million in PNRR aid.(3)TaiyangNews, “Government Backs 1.5 GW Solar Module Production…,” taiyangnews.info Lower capex, better module efficiency, and cheaper debt combine to keep the Romania solar energy market on a steep growth path despite maturing incentives.
Restraints Impact Analysis*
| Restraint | (~) % Impact on CAGR Forecast | Geographic Relevance | Impact Timeline |
|---|---|---|---|
| Lengthy grid-connection permitting | −2.4% | National, rural peripheries | Short term (≤ 2 years) |
| Competition from on-shore wind repowering | −1.8% | Coastal and mountain zones | Medium term (2-4 years) |
| Farmland-protection zoning limits sites | −1.6% | High-value agricultural land | Long term (≥ 4 years) |
| Rising domestic interest rates post-2023 | −1.1% | Nationwide | Short term (≤ 2 years) |
| Source: Mordor Intelligence | |||
Lengthy grid-connection permitting
Transelectrica’s application backlog tops 31.74 GW, stretching approval times beyond 12 months and inflating carrying costs. Planned auction-based capacity allocation from 2026 may prioritize shovel-ready assets, yet network reinforcements remain critical, especially in solar-rich south-east counties.(4)Profit.ro, “Panouri solare flotante…,” profit.roDelays compress developers’ CfD windows and raise execution risk.
Competition from on-shore wind repowering
Recent CfD auctions saw wind bids at EUR 65/MWh compared to solar’s EUR 51/MWh, supporting 1.1 GW of repowering versus 432 MW of new PV. Established wind farms have existing grid ties and faster permitting, prompting developers to chase repower premiums that may outcompete greenfield solar on prime sites. Solar operators answer with hybrid PV-storage concepts that raise capacity factors and grid-service revenues.
*Our forecasts treat driver/restraint impacts as directional, not additive. The impact forecasts reflect baseline growth, mix effects, and variable interactions.
Segment Analysis
By Technology: Solar PV Dominates Through Cost Leadership
Solar PV accounted for the entire Romania solar energy market share in 2025, underscoring the absence of CSP due to modest direct normal irradiance and higher capital intensity. The Romania solar energy market size for PV is projected to grow at a 14.52% CAGR to 2031, propelled by rooftop incentives and utility-scale CfDs. Local module plants with a total annual output of 1.779 GW are eligible for Net-Zero Industry Act procurement bonuses, thereby improving domestic content competitiveness.
Romanian solar energy market developers are increasingly integrating battery storage and tracker systems to enhance capacity factors and secure grid-service revenue. Manufacturing localization lowers logistics costs and de-risks supply chains amid global trade tensions. CSP remains sidelined due to uneconomical LCOE relative to PV plus storage.




By Grid Type: Off-Grid Surge Driven by Rural Electrification
On-grid plants represented 95.10% of the 2025 capacity, a share expected to remain above 90% through 2031, as CfD auctions favor utility-connected projects. The Romania solar energy market size for on-grid systems benefits from €56.2 million earmarked for transmission upgrades. Distributed automation and smart meters help networks absorb rising daytime injections, lowering curtailment.
Off-grid capacity, although modest, is projected to grow at a 20.80% CAGR through 2031, driven by agrivoltaics and rural microgrid pilots. Emergency Ordinance 134/2024 removed double taxation on batteries, enabling solar-plus-storage packages that replace diesel gensets for farms and telecom towers. These solutions unlock energy access and cost savings where grid extensions are uneconomic.
By End-User: Residential Segment Accelerates Through Prosumer Growth
Utility-scale parks held 57.10% of the Romania solar energy market share in 2025, favored by CfDs and economies of scale. Projects such as the 155 MW Rătești plant illustrate improvements in bankability due to a predictable offtake. The segment retains volume leadership, though its growth rate moderates as the base expands.
Residential systems post the fastest 18.55% CAGR to 2031, catalyzed by financing aimed at homeowner associations that mandates ≥10 kWp PV plus storage sized at ≥50% of array capacity. Net-metering and simplified 400 kW licensing also spur commercial rooftops. Corporate PPAs provide support for behind-the-meter C&I arrays that reduce grid charges and carbon liabilities.
Geography Analysis
Southern counties, such as Constanța, Călărași, and Giurgiu, host the bulk of utility-scale pipelines due to their 1,900-2,400 annual sunshine hours and flat topography, which eases construction. Projects pair PV with wind and storage to optimize grid usage. Western industrial clusters favor on-site C&I arrays that align generation with daytime loads, trimming power bills and Scope 2 emissions.
Bucharest’s metropolitan area leads rooftop deployment. Higher retail tariffs and municipal incentives accelerate the uptake of prosumer systems in apartment blocks, while abundant installation capacity shortens project cycles. Smart-meter penetration supports granular billing and flexible tariffs.
Northern and mountainous zones utilize distributed PV to supplement hydroelectric and biomass energy sources. Agrivoltaic pilots in high-value horticultural regions protect revenue diversity amid climate risks, ensuring that solar deployment extends beyond resource-rich south-east corridors.
Regulatory Landscape
Romania’s solar market operates under the electricity and renewable-energy legal framework administered by ANRE. National support instruments span prosumer rules, green certificates, and feed-in premium mechanisms for smaller plants, alongside a state-aid Contracts for Difference (CfD) program for utility-scale solar. The policy stack has been used to mobilize investment alongside EU funding, including Romania’s National Recovery and Resilience Plan (PNRR) allocations for renewables and grid modernization, which support public-sector PV deployments and strengthen bankability for private developers.
In May 2026, ANRE introduced a stricter grid-connection and licensing package (Orders 15/2026 and 16/2026), tightening milestones and increasing financial discipline for projects above 1 MW through higher guarantees and time-bound requirements. By linking connection rights to permitting progress, the change targets speculative capacity bookings in a context of a large connection application backlog. It also raises the value of project readiness (permitting, financing, and EPC contracting) when securing ATR and establishment authorizations, including for hybrid solar-plus-storage and agrivoltaic projects that are receiving authorizations.
Competitive Landscape
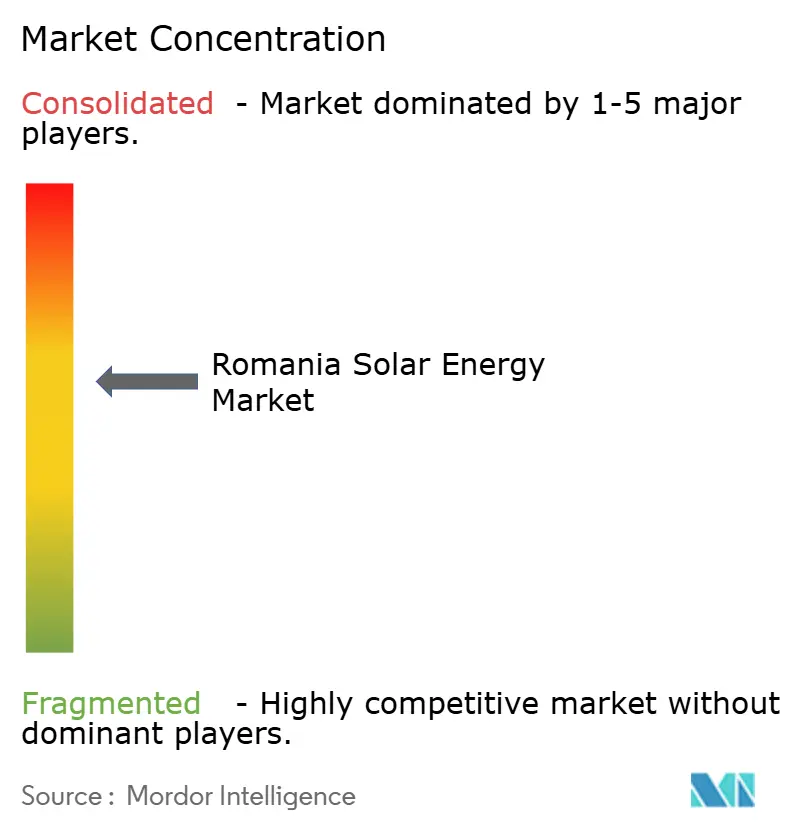
Romania’s solar arena is moderately concentrated, with Photon Energy Group and Enel Green Power Romania anchoring the top tier, while Nofar Energy, Econergy, and NextE Renewable are expanding aggressively. International developers form local joint ventures to navigate the permitting and community engagement processes. Strategies differentiate through vertical integration, corporate PPA portfolios, and storage co-location.
Domestic manufacturing entrants, such as SC Heliomit SRL and KBK Kraft Projekt, strengthen supply security and qualify for EU content bonuses, creating a cost advantage. Lenders such as the EIB and EBRD channel green loans to developers that meet ESG standards, thereby lowering the weighted average cost of capital relative to purely commercial debt.
Value-added services, such as digital O&M, grid-support inverters, and energy-as-a-service offerings, serve as market differentiators. Players that bundle these capabilities with bankable pipelines position themselves to capture long-run share as Romania's solar energy market additions scale beyond 1 GW per year.
Romania Solar Energy Industry Leaders
Sunshine Solar Energy SRL
Danagroup.hu
Amerisolar AP
Enel Green Power SpA
Photon Energy Group
- *Disclaimer: Major Players sorted in no particular order

Market Opportunities and Future Outlook
Utility-scale additions are increasingly organized around revenue certainty and grid access rather than pure capacity build, creating room for developers to combine CfD support, corporate PPAs, and hybridization with battery energy storage to manage intraday price volatility. Romania’s CfD program remains a central commercialization pathway for large PV, with the second auction in August 2025 awarding 1,488 MW of solar capacity. ANRE’s subsequent amendments to network-capacity allocation methodology (Order 79/2025) further emphasize the importance of queue position, compliance, and deliverability.
On the demand side, corporate procurement continues to support newbuild pipelines, as reflected by OMV Petrom and CE Oltenia moving forward with a 550 MW solar joint-venture portfolio (Ișalnița, Tismana, and Rovinari), with large equipment deliveries scheduled for 2026. At the system level, Romania’s updated NECP targets a 57.8% renewables share in the electricity sector by 2030. In parallel, grid digitalization programs and rules enabling solar-plus-storage packages for distributed users support scaling by installers, aggregators, and C&I solution providers, as connection capacity and balancing requirements become as consequential as module pricing.
Recent Industry Developments
- July 2026: Shikun and Binui Energy commenced commercial operation of the 104 MW Simleu Silvaniei solar park in Salaj county. The commissioning increased the companies operating Romanian solar capacity to about 175 MW, reinforcing competitive pressure from new entrants that can execute grid-connected projects through to COD.
- June 2026: OMV Petrom and CE Oltenia reported the arrival of the first batch of roughly 800,000 photovoltaic panels for their 550 MW solar portfolio across Ișalnița, Tismana, and Rovinari, with construction under way. The milestone de-risks procurement for one of the largest multi-site solar programs in the country and signals sustained momentum behind corporate-backed utility-scale buildouts.
- December 2024: OMV Petrom completed the acquisition of a 710 MW solar portfolio from Jantzen Energy. The transaction accelerated OMV Petrom's renewable footprint in Romania and supported the buildout of captive and contracted green power volumes for industrial operations.


Research Methodology Framework and Report Scope
Market Definition and Coverage
For this methodology, the Romania solar energy market is defined as the country-level installed solar power base and annual additions, tracked in gigawatts and tied to grid-connected and behind-the-meter solar deployment.
Scope exclusions: This sizing does not treat batteries, broader renewable generation, or solar equipment manufacturing revenue as part of the market total.
Segmentation Overview
- By Technology
- Solar Photovoltaic (PV)
- Concentrated Solar Power (CSP)
- By Grid Type
- On-Grid
- Off-Grid
- By End-User
- Utility-Scale
- Commercial and Industrial (C&I)
- Residential
- By Component (Qualitative Analysis)
- Solar Modules/Panels
- Inverters (String, Central, Micro)
- Mounting and Tracking Systems
- Balance-of-System and Electricals
- Energy Storage and Hybrid Integration
Data Sources, Market Sizing, and Validation
Desk Research
Desk research was used to build the starting dataset for installed capacity, generation signals, and policy timelines that directly shape new solar commissioning in Romania. We referenced public sources such as Eurostat energy statistics, the International Energy Agency data tables, the International Renewable Energy Agency renewable capacity series, and the European Commission releases on energy and climate policy.
To keep assumptions realistic, we also reviewed grid and market disclosures, and then cross-checked them with company filings, investor presentations, and reputable press coverage of new projects and auction outcomes. For hard-to-track items like project pipelines, ownership changes, and commissioning status, a paid subscription covering company financials and intelligence was used selectively, and patent databases were checked to understand where technology focus is shifting. The sources listed here are illustrative, and many other public and paid references were used during data collection, validation, and clarification.
Primary Interviews and Surveys
Interviews and surveys with Romanian utility, developer, installer, distributor, regulator, and finance experts are conducted within Romania. Their input helps test additions, project timing, prosumer activity, pricing direction, and policy effects. It also helps fill evidence gaps and triangulate assumptions before final analysis.
Distribution of primary research fieldwork respondents
| Company type | Respondent position |
|---|---|
| Top tier: 28% | CXOs: 18% |
| Mid tier: 47% | Functional/Unit leaders: 32% |
| Smaller Players: 25% | Managers: 50% |
Market-Sizing & Forecasting
Sizing starts from a top-down reconstruction of Romania solar capacity using official capacity series and grid-linked signals, and then we map that base into annual additions and a forward build schedule. The model is corroborated through selective bottom-up approximations, where sampled project lists, typical project size bands, and developer-level channel checks are used to sanity-check the national totals and correct for timing mismatches.
Key inputs used to keep the model grounded include historic installed capacity progression, commissioning and grid-connection timelines, auction and support-scheme calendars, utility-scale versus rooftop mix shifts, and module and inverter pricing direction that affects build economics. Where project pipelines are incomplete, the gap is handled by applying conversion ratios that were validated in interviews and adjusted by the observed lag between permitting and energization.
For forecasting, scenario analysis is used so capacity additions can be flexed based on policy execution and grid readiness, and then the final path is anchored to what experts see as the most likely case for near-term awards and build-outs. We apply the top-down and bottom-up checks once more at the end so the forecast stays consistent with the installed base and realistic annual build capacity.
Data Validation & Update Cycle
Validation is done through multiple checks that compare the modeled installed base and annual additions against independent signals like official capacity series movements, major commissioning announcements, and grid-related milestones. When a number looks off, the assumption behind it is traced back, and we either rework the input series or re-contact a relevant respondent to confirm what changed.
Before sign-off, the model and logic go through an internal analyst review so that outliers, sudden jumps, and year-to-year swings are explained and documented. Reports are refreshed annually, and interim updates are made when material events occur, such as major auction results, rule changes, or large project commissioning. Right before delivery, a fresh pass is completed to ensure clients receive the most current view available.
Mordor Intelligence's Romania Solar Energy Market Sizing Compared With Other Published Estimates
Published market sizes for Romania solar often differ because some sources report installed base in gigawatts, while others talk about project pipeline, generation output, or even equipment spending, and the numbers can look similar even when the meaning is not the same.
In our checks, the largest gaps usually come from whether a figure counts only operating capacity versus including late-stage projects that are permitted but not yet connected, and from how rooftop prosumer systems are captured when registration data lags. Currency and price assumptions can also distort comparisons when a capacity market is incorrectly converted into a revenue headline.
Benchmark comparison
| Source | Market Size | Gaps in Research Methodology |
|---|---|---|
| Mordor Intelligence | USD 6.79 B (2025) | |
| Trade Platform A | USD 5.27 B (2024) | This figure is presented as installed base for 2024 and is often carried forward without a clear adjustment for commissioning cutoffs, which can understate the latest year if late-year connections are missed. |
| Industry Brief B | USD 7.78 B (2026) | This number reflects a forward year and can look larger mainly because it embeds a build-out assumption tied to policy timing, which is not directly comparable to an operating-capacity snapshot year. |
The table shows that timing and what gets counted as live capacity versus expected additions can move the result more than any single data source choice. By keeping the cutoff tied to operating capacity and then stress-testing the build schedule with grid and commissioning feedback, the estimate stays comparable year to year, which is the approach used by Mordor Intelligence.


Key Questions Answered in the Report
How large is Romania’s installed solar capacity in 2026?
The Romania solar energy market size reached 7.78 GW in 2026.
What is the projected capacity for 2031?
Installed capacity is forecast to rise to 15.31 GW by 2031.
What growth rate is expected between 2026 and 2031?
Capacity is set to expand at a 14.52% CAGR over the forecast period.
Which segment is growing the fastest?
Residential installations are advancing at an 18.55% CAGR through 2031.
How dominant is solar PV technology?
Solar PV accounts for 100.00% of capacity, with no commercial CSP presence.
What policy supports rooftop adoption?
Net-metering, simplified 400 kW licensing, and financing for ≥10 kWp systems with storage spur residential uptake.
Page last updated on:




