
Technology, Media and Telecom
5th MayPricing Strategy for Semiconductor Components
3 Min Read
Robotic Total Stations Market is Segmented by Accuracy Level (0. 5''- 1'' Accuracy, and 2''- Others Accuracy), Application (Surveying, Engineering and Construction, and Excavation), End-Use Industry (Construction, Mining, Oil and Gas, Utilities and Energy, and Agriculture and Forestry), Component (Hardware, and Software / Firmware), and Geography (North America, South America, Europe, Asia-Pacific, and Middle East and Africa).
Market Overview
| Study Period | 2020 - 2031 |
|---|---|
| Market Size (2026) | USD 1.01 Billion |
| Market Size (2031) | USD 1.36 Billion |
| Growth Rate (2026 - 2031) | 6.12 % CAGR |
| Fastest Growing Market | Asia Pacific |
| Largest Market | Asia Pacific |
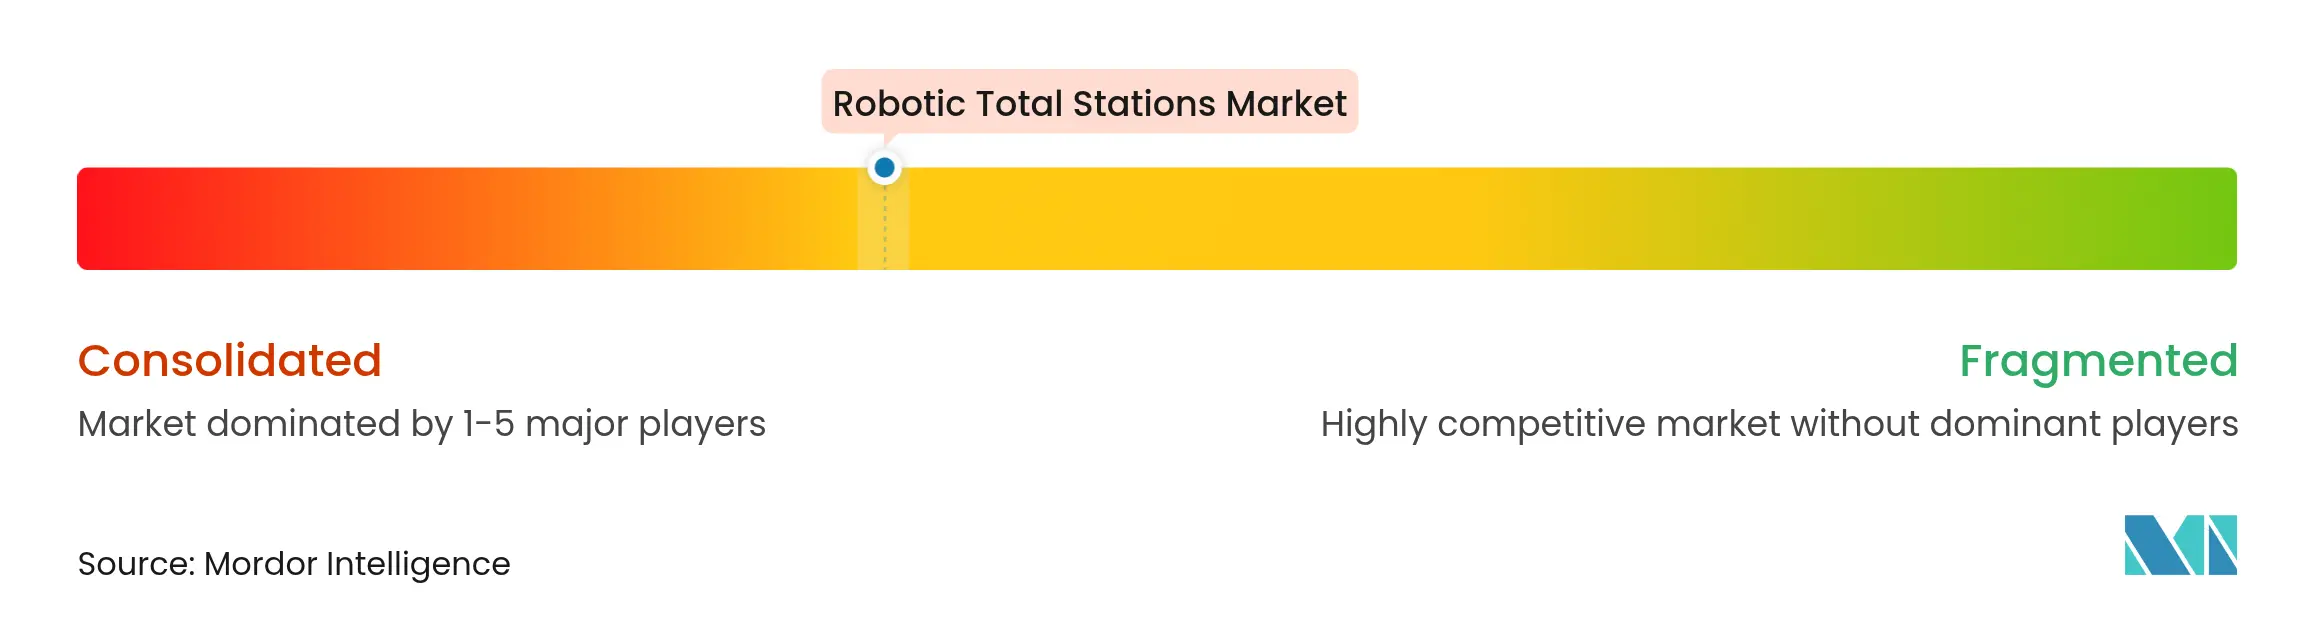
| Market Concentration | Medium |
Major Players *Disclaimer: Major Players sorted in no particular order. Image © Mordor Intelligence. Reuse requires attribution under CC BY 4.0. |
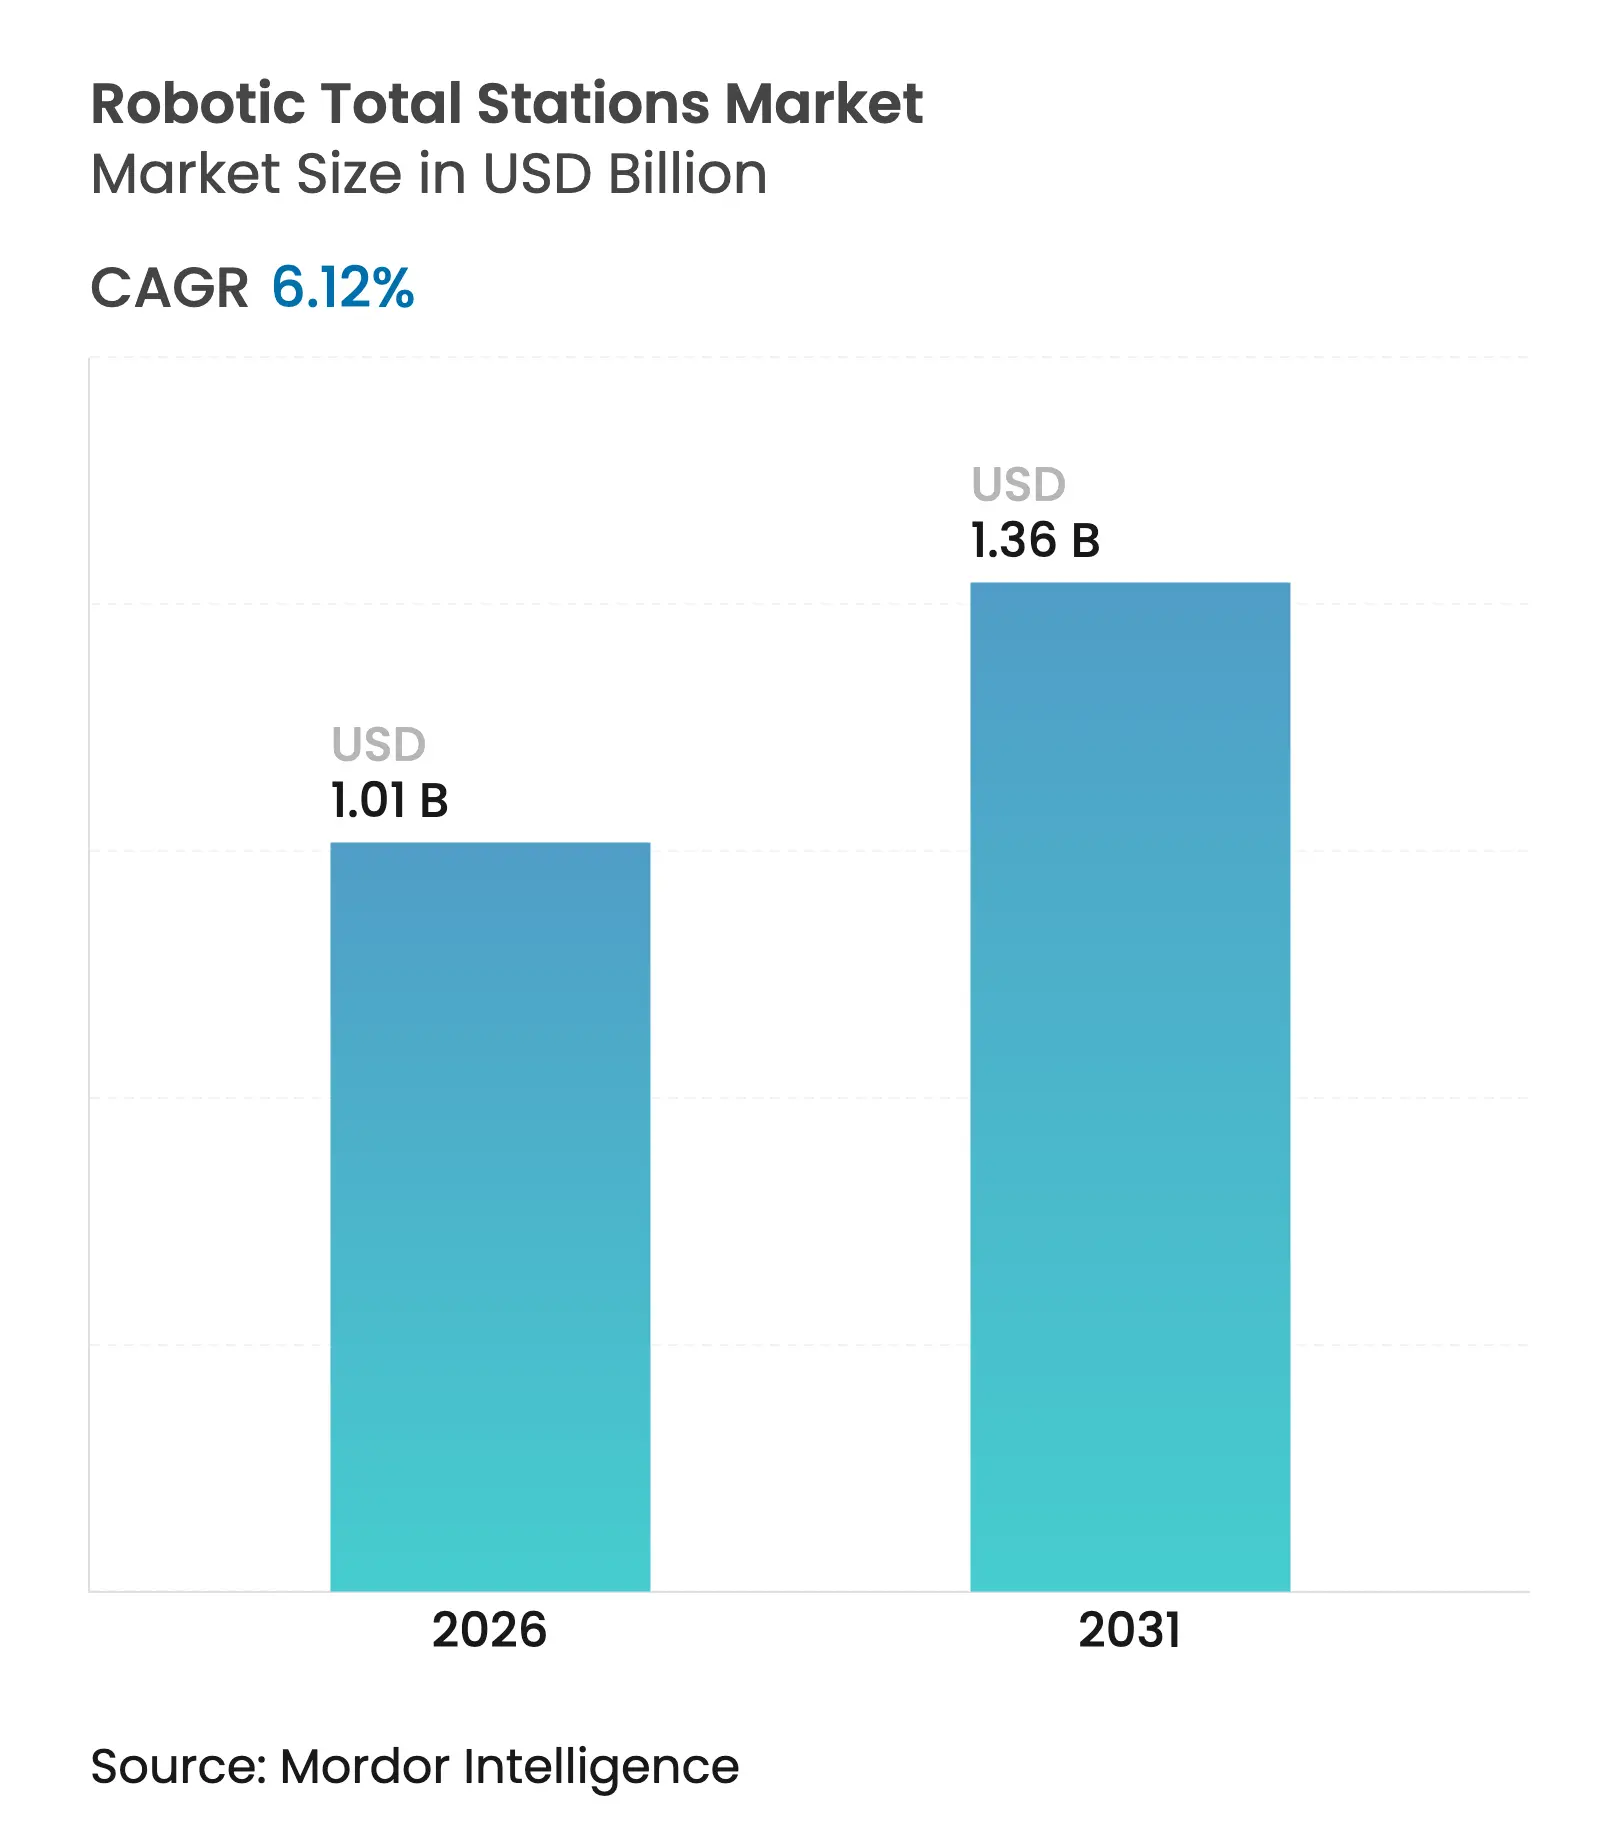
The robotic total stations market size was valued at USD 0.95 billion in 2025 and estimated to grow from USD 1.01 billion in 2026 to reach USD 1.36 billion by 2031, at a CAGR of 6.12% during the forecast period (2026-2031). This trajectory underscores how single-operator optical instruments have become indispensable as infrastructure owners demand centimetre-level accuracy and verifiable “digital as-built” models that tie directly into Building Information Modelling (BIM) environments. Surging megaproject activity, particularly in rail, road, and renewable-energy build-outs, continues to accelerate adoption as contractors replace two-person crews with robotic workflows that cut layout time by up to 80% Autodesk. Manufacturers are equally shifting the value proposition toward AI-enabled software that delivers autonomous target recognition, predictive maintenance, and secure cloud synchronisation, ensuring the robotic total stations market keeps pace with labour-short construction sites and tightening carbon-audit mandates.
Key Report Takeaways
Note: Market size and forecast figures in this report are generated using Mordor Intelligence's proprietary estimation framework, updated with the latest available data and insights as of 2026.
Drivers Impact Analysis
| Driver | (~) % Impact on CAGR Forecast | Geographic Relevance | Impact Timeline | |||
|---|---|---|---|---|---|---|
Infrastructure megaproject pipeline
Infrastructure megaproject pipeline
| +1.8% | Global, with a concentration in Asia-Pacific and the Middle East | Medium term (2-4 years) |
(~) % Impact on CAGR Forecast
:
+1.8%
|
Geographic Relevance
:
Global, with a concentration in Asia-Pacific and the Middle
East
|
Impact Timeline
:
Medium term (2-4 years)
|
Adoption of BIM-to-field robotic workflows
Adoption of BIM-to-field robotic workflows
| +1.5% | North America and the EU, expanding to APAC | Short term (≤ 2 years) | |||
Single-operator labour-savings vs. manual total stations
Single-operator labour-savings vs. manual total stations
| +1.2% | Global | Short term (≤ 2 years) | |||
Mandated "digital as-built" deliverables in
public works tenders
Mandated "digital as-built" deliverables in
public works tenders
| +1.0% | APAC core, spill-over to North America | Medium term (2-4 years) | |||
GNSS jamming driving optical instrument demand on defence
sites
GNSS jamming driving optical instrument demand on defence
sites
| +0.7% | Global, concentrated in conflict regions | Long term (≥ 4 years) | |||
Carbon-footprint auditing on construction sites (scope-3
traceability)
Carbon-footprint auditing on construction sites (scope-3
traceability)
| +0.5% | EU and North America, expanding globally | Long term (≥ 4 years) | |||
| Source: Mordor Intelligence | ||||||
Infrastructure megaproject pipeline accelerates precision-surveying demand
Historic outlays on transport links such as the Grand Paris Express, the Fehmarnbelt Fixed Link, and China’s Belt and Road corridors have positioned the robotic total stations market at the centre of multi-year excavation, tunnelling, and bridge projects where GNSS is unavailable and millimetre tracking is critical.[1]VINCI Construction, “Fehmarnbelt Fixed Link Project Overview,” vinci-construction.com Contractors running around-the-clock shifts now rely on automated prism tracking to protect personnel from collapsing faces and to feed live deformation data back into digital twins, reinforcing the technology’s value proposition.
BIM-to-field robotic workflows transform construction layout processes
The seamless hand-off of 3D model coordinates to total stations through applications such as Autodesk Point Layout and Leica iCON has slashed rework and reduced layout time by up to 80% on complex builds. Government-backed i-Construction programs in Japan require robotic instruments to pull directly from IFC files, ensuring every anchor bolt and utility sleeve lands exactly where the model specifies.
Single-operator labour savings address workforce shortages
ATRplus and AutoPole innovations allow one person to control the layout while the instrument automatically tracks the prism, doubling productivity and freeing scarce surveyors for higher-value tasks. Swiss contractor Aregger AG cut staffing on large hotel builds in half without losing accuracy. Municipal pipeline crews in Flums, Switzerland, achieved similar gains underground, avoiding costly trench reopens.
Mandated digital as-built deliverables drive government adoption
Transport for NSW in Australia, Denmark’s ICT regulations, and the United States Department of Transportation Digital As-Builts initiative have embedded robotic total stations in procurement language, forcing bidders to guarantee IFC-aligned, centimetre-accurate handover files. These mandates de-risk asset maintenance and water down lifecycle costs, stimulating fresh demand across public works portfolios.
Restraints Impact Analysis
| Restraint | (~) % Impact on CAGR Forecast | Geographic Relevance | Impact Timeline | |||
|---|---|---|---|---|---|---|
High capital cost and pay-back period
High capital cost and pay-back period
| -1.3% | Global, particularly affecting SMEs | Short term (≤ 2 years) |
(~) % Impact on CAGR Forecast
:
-1.3%
|
Geographic Relevance
:
Global, particularly affecting SMEs
|
Impact Timeline
:
Short term (≤ 2 years)
|
Competing LiDAR and drone photogrammetry solutions
Competing LiDAR and drone photogrammetry solutions
| -0.9% | Global, concentrated in surveying applications | Medium term (2-4 years) | |||
Shortage of certified robotic-instrument technicians
Shortage of certified robotic-instrument technicians
| -0.7% | Global, acute in developing markets | Long term (≥ 4 years) | |||
Cyber-hardening requirements for job-site connectivity
Cyber-hardening requirements for job-site connectivity
| -0.4% | Global, emphasis on defense and critical infrastructure | Medium term (2-4 years) | |||
| Source: Mordor Intelligence | ||||||
High capital costs create adoption barriers for small and medium enterprises
Unit prices exceeding USD 50,000 plus 20–30% lifecycle add-ons for software and service plans make financing difficult for many regional contractors. In emerging markets, limited leasing facilities extend payback timelines to four years, stalling penetration despite proven productivity upside.
Competing LiDAR and drone technologies challenge traditional surveying uses
UAV-mounted LiDAR sensors such as DJI Zenmuse L2 have demonstrated 0.07 m RMSE across open sites, covering hectares in a single flight. While robotic total stations still dominate bolt-set or beam-placement tasks, drones encroach on large-area topographic and volume-calculation work, forcing vendors to diversify into hybrid optical-drone ecosystems.
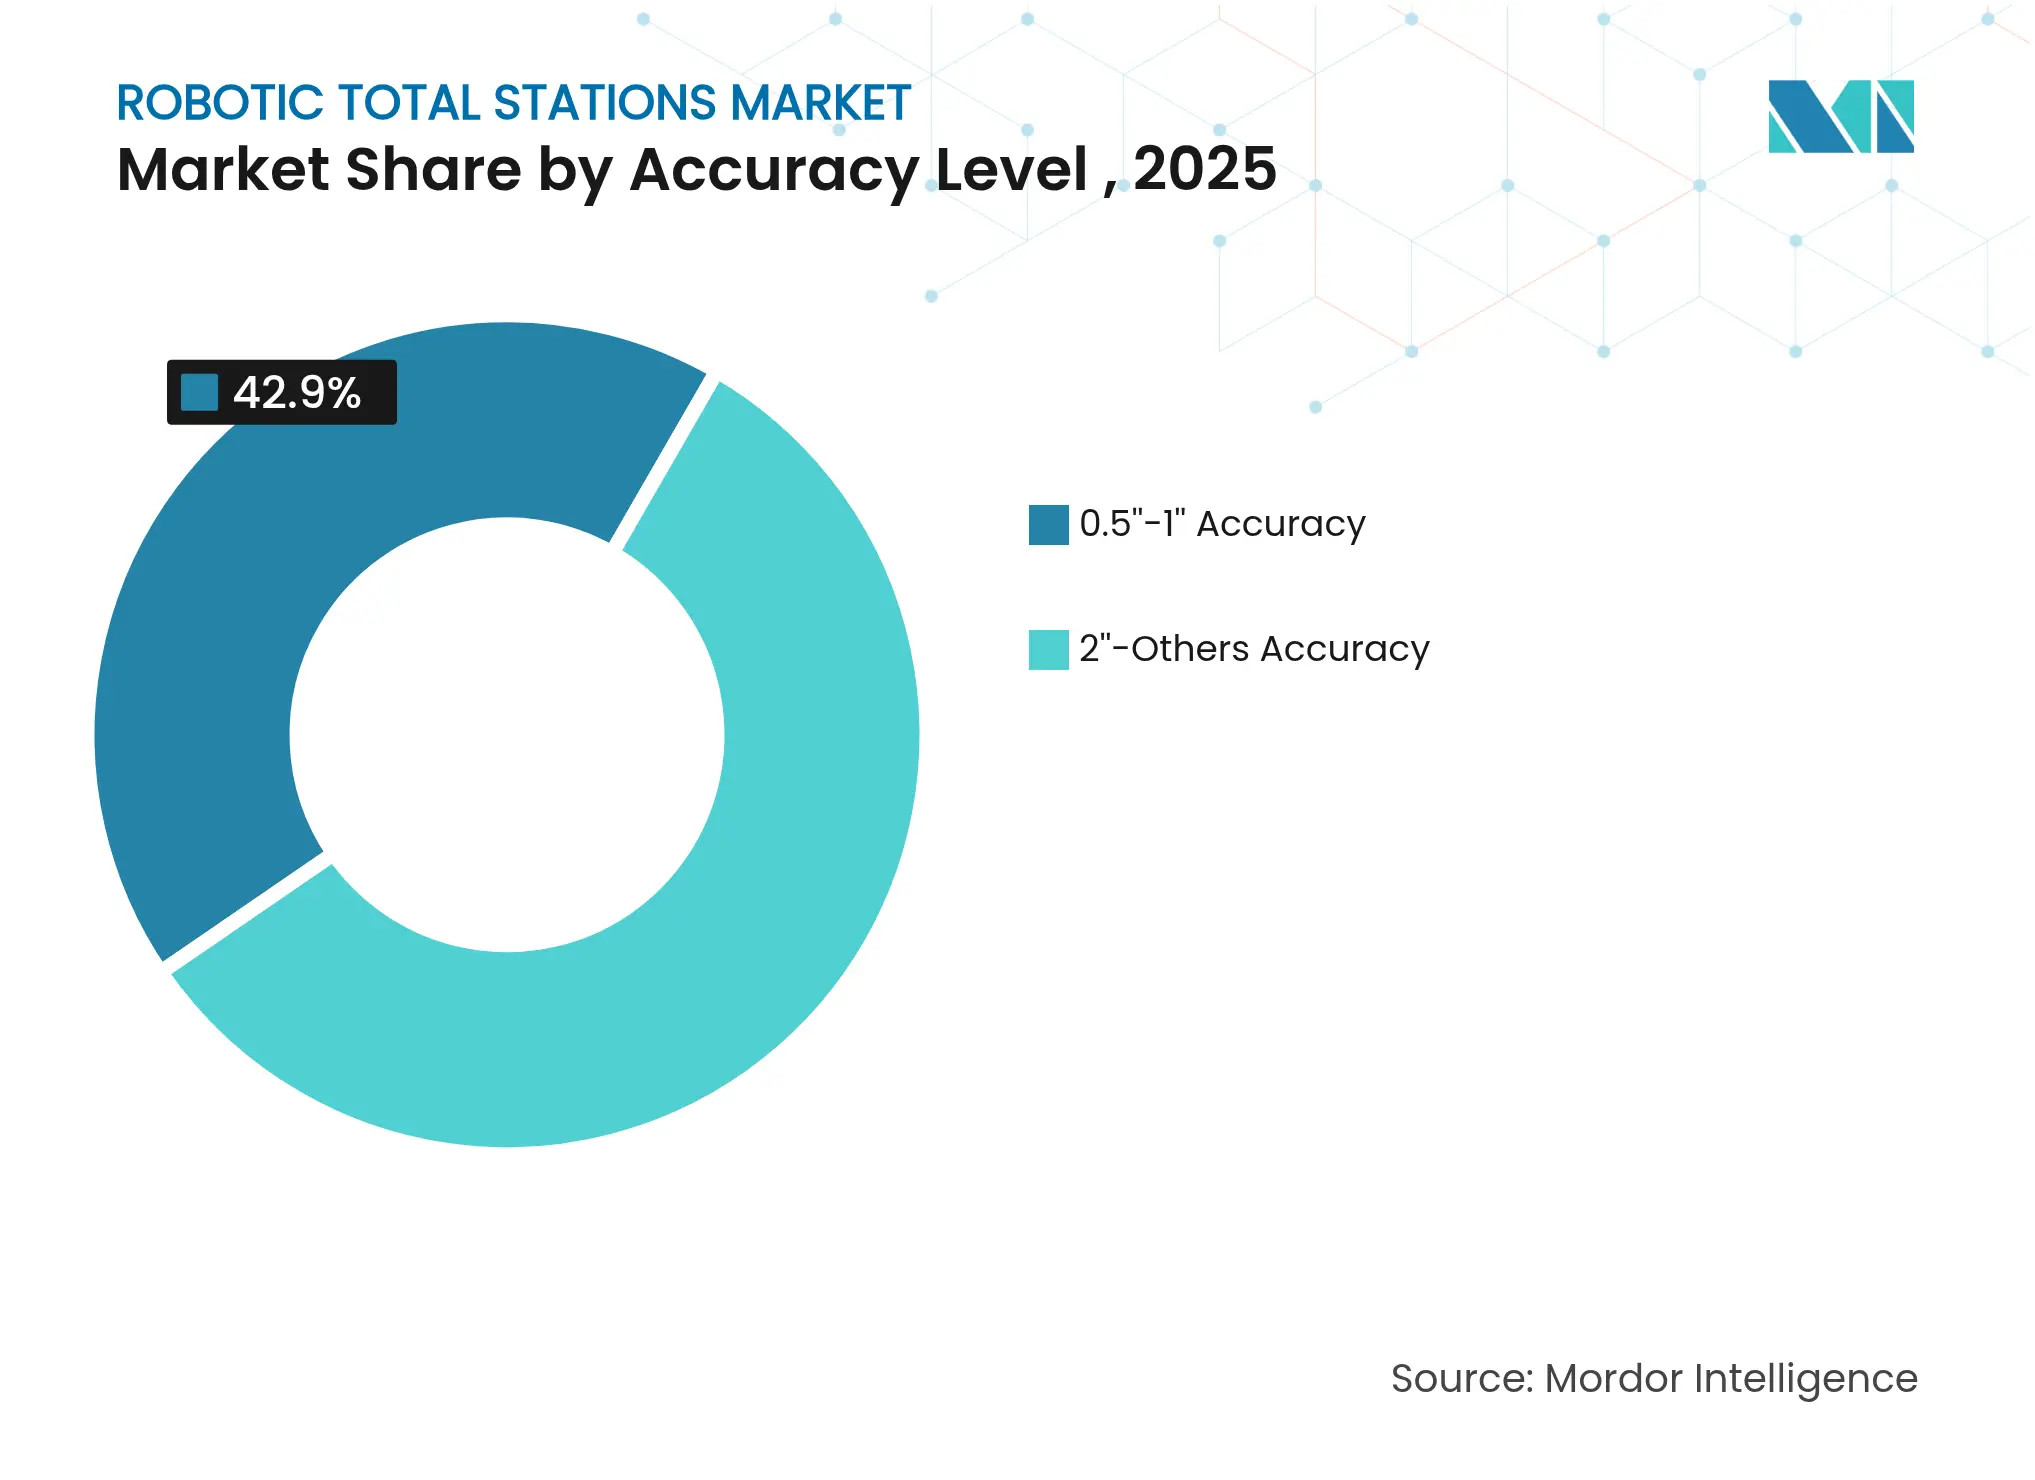
By Accuracy Level: Premium precision drives growth
The robotic total stations market size for high-precision 0.5"-1" instruments is forecast to grow 7.94% CAGR through 2031 as contractors demand sub-centimetre tolerances on wind-turbine foundations, suspension-bridge cable nodes, and semiconductor fabs. Topcon’s 2024 GT-1500/700 with Silky Drive technology epitomised this shift, packing extra-smooth servo motors into a compact frame that engineers can shoulder single-handedly. Contractors that once alternated between two instruments on high-rise core walls now rely on one premium robot to complete both control and set-out cycles in fewer passes.
The wider 2"-Others band retained a 57.10% robotic total stations market share in 2025, thanks to cost-sensitive builders erecting warehouses, housing tracts, and utility corridors. Software upgrades are closing the gap by back-calculating atmospheric refraction and drift, effectively lifting traditional robots into the 1" class without hardware swaps. As mid-tier prices continue to fall, competitive pressure could blur today’s neat accuracy brackets.
Note: Segment shares of all individual segments available upon report purchase
By Application: Excavation workflows lead innovation
Excavation work captured the fastest 6.95% CAGR as DOTs specified real-time grade-control integration for cut-fill optimisation. Georgia DOT trials showed robotic-guided blades maintaining a 0.25-foot tolerance during final grading, reducing over-excavation rework by 12% Georgia DOT. Earthmovers can now receive live offsets from a prism on the dozer blade, eliminating stakes and reducing traffic conflicts.
Engineering and construction still commanded 43.00% of the robotic total stations market demand in 2025, spanning anchor-bolt setting, concrete lift verification, and façade install checks. Beyond core building tasks, continuous monitoring functions have crept into slope stabilisation and heritage-site preservation, broadening the technology’s revenue streams and flattening seasonal swings.
By End-Use Industry: Utilities drive energy transition
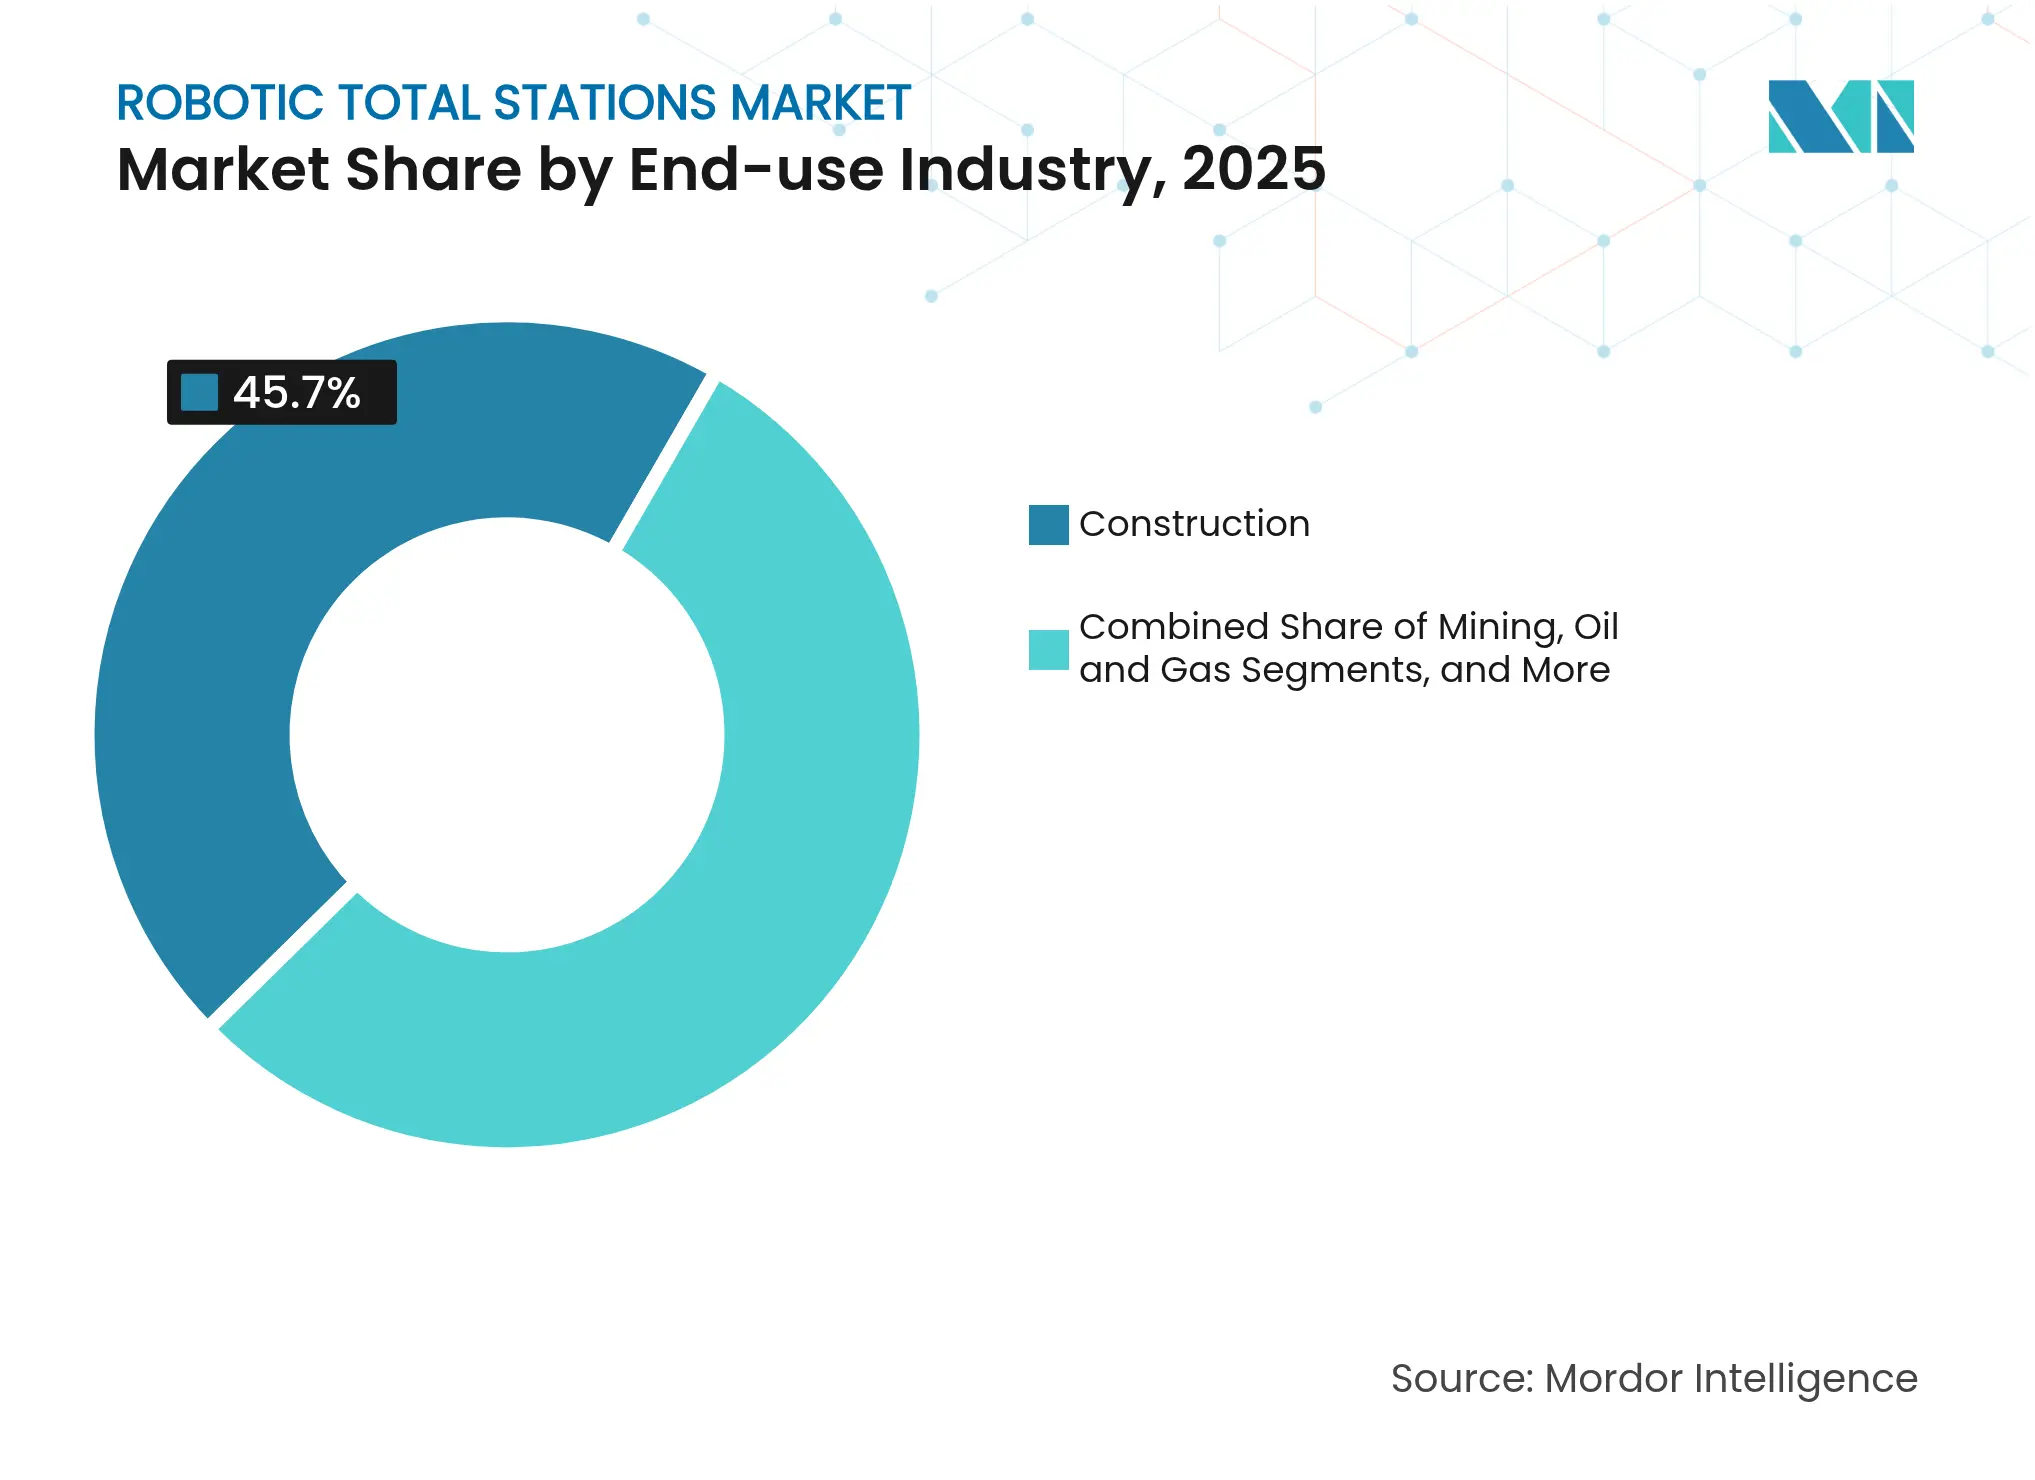
Utilities and energy projects logged the highest 8.05% CAGR as grid developers erected wind farms and solar arrays at a gigawatt scale. Hexagon-enabled metrology contributed to 16.6 GW of wind installations in India and China during 2024, underscoring the need for accurate tower alignment across uneven terrain. Site engineers increasingly place reference prisms on nacelle hubs to track yaw alignment and drivetrain stress.
Mainstream construction nonetheless held the largest robotic total stations market share at 45.70% in 2025, reflecting entrenched usage across commercial high-rise, institutional campuses, and public-sector infrastructure. Mining, oil and gas, and forestry each remain viable niches where harsh environments make robotic optical instruments preferable over GNSS.
Note: Segment shares of all individual segments available upon report purchase
By Component: Software intelligence transforms hardware
Hardware captured 85.20% of revenue in 2025, yet software and firmware raced ahead at 10.1% CAGR. Trimble’s Connect and Scale initiative showed annual recurring revenue of USD 2.18 billion in Q1 2025, proving that perpetual licences are giving way to subscription bundles wrapping analytics, cyber-security, and IoT telemetry.
Cloud-processed point clouds now stream back into design offices within minutes, allowing virtual clash detection before the next pour. Predictive-maintenance dashboards flag tachymeter drive wear or cracked lens housings days before failure, shrinking downtime windows on critical-path pours and tunnel drives.
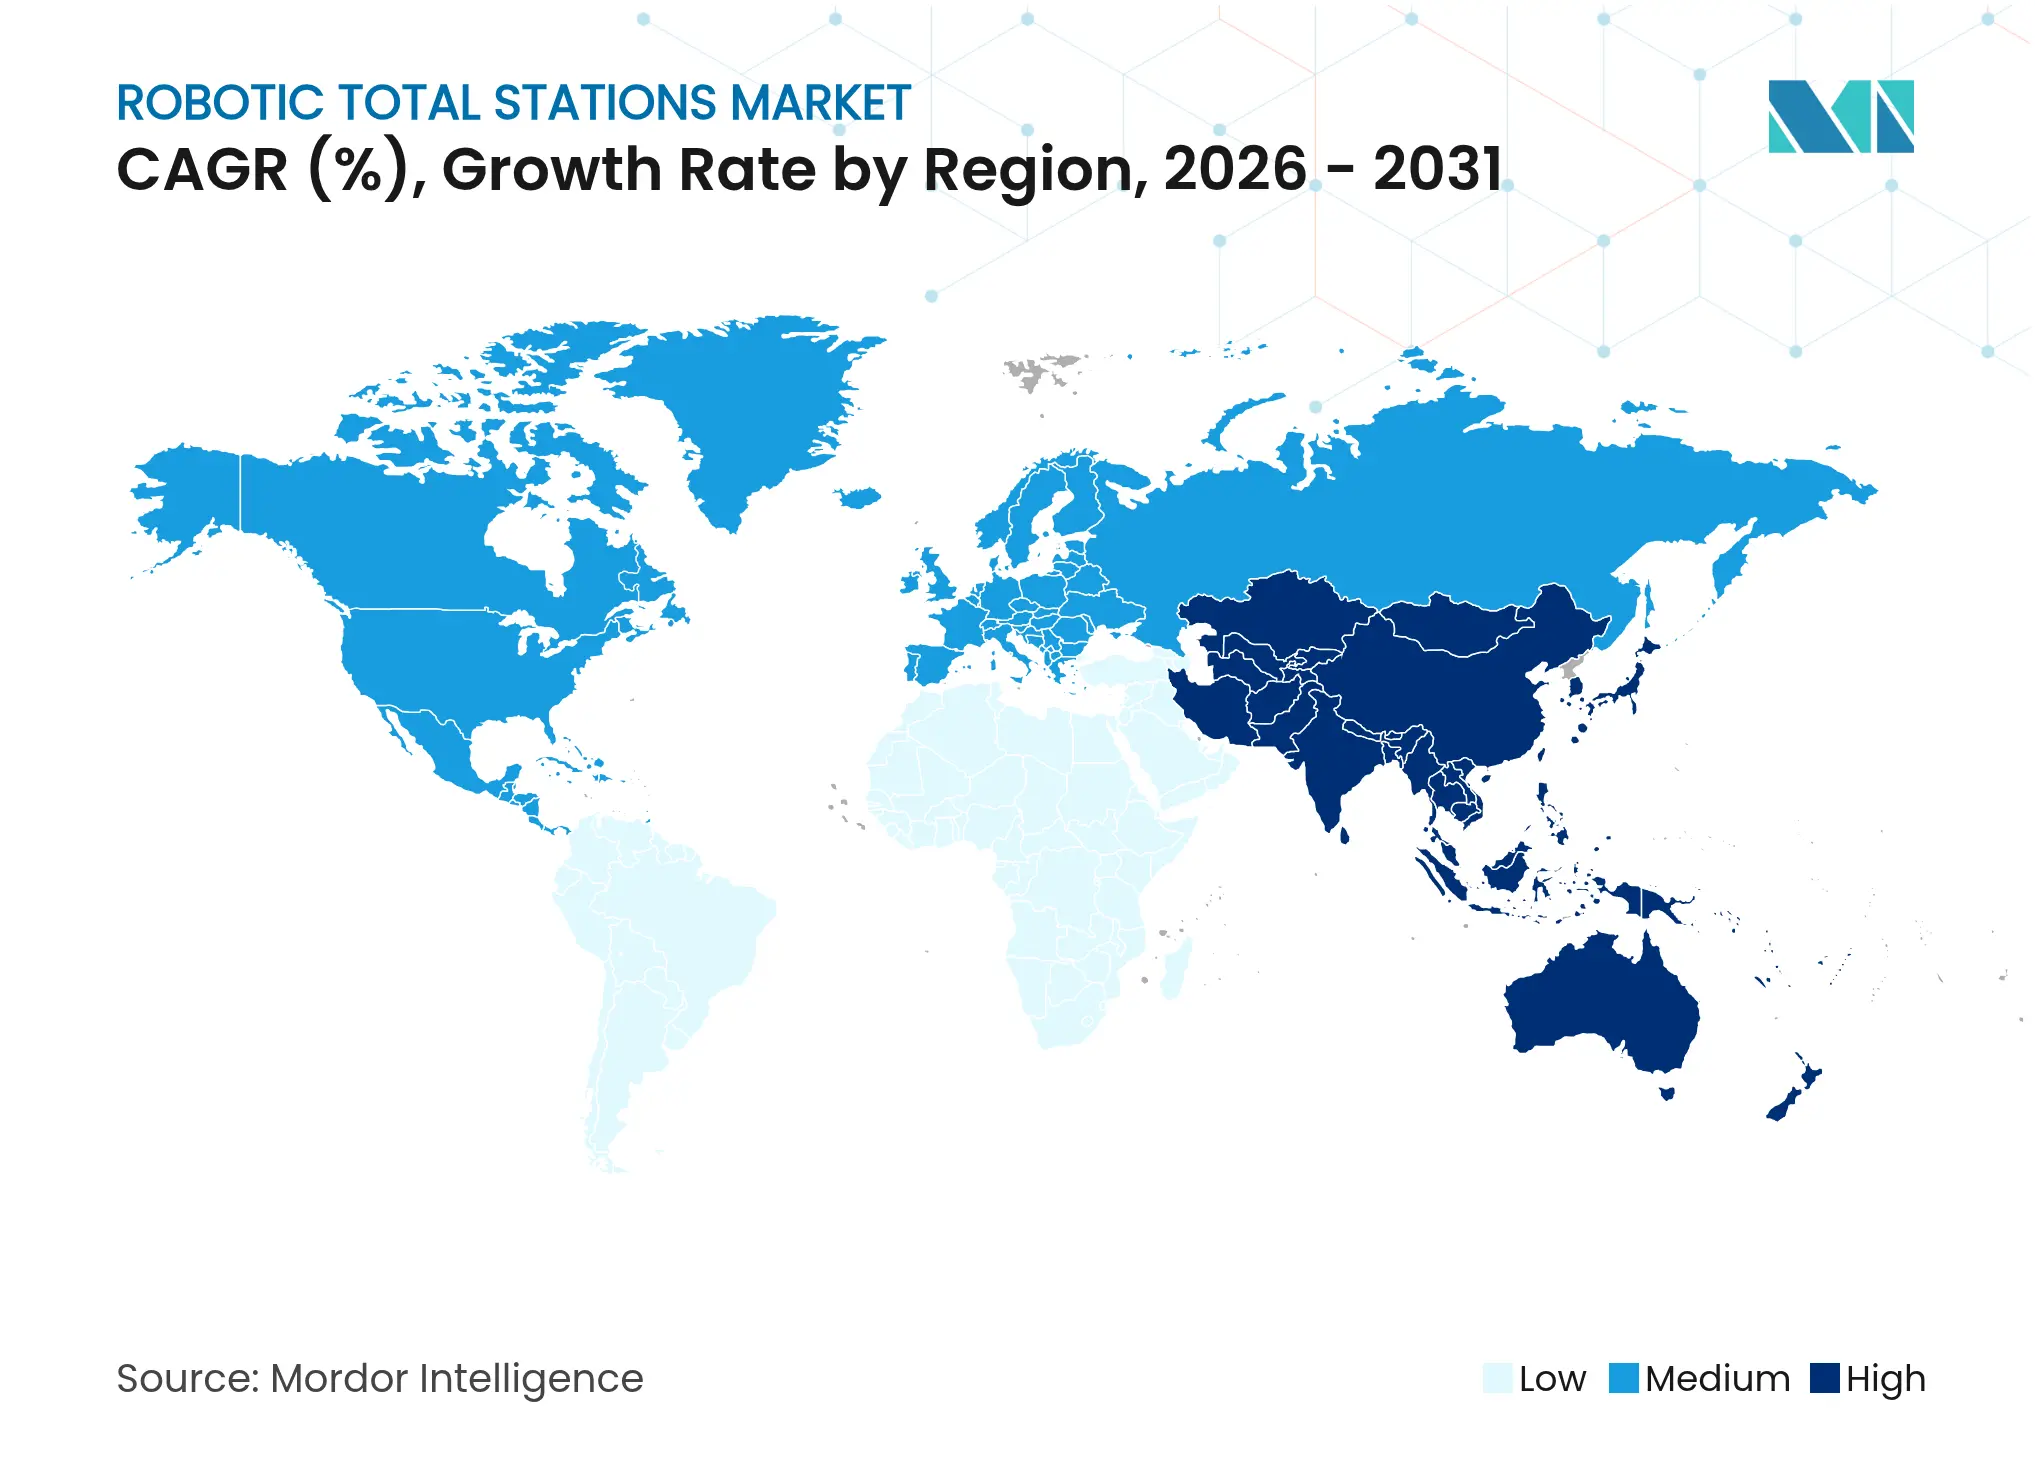
Asia-Pacific retained 38.00% leadership of the robotic total stations market in 2025 as Japan’s i-Construction mandates and China’s Belt and Road corridors embedded digital layout into public procurement. The region’s 8.75% CAGR stems from megacities racing to build metro lines, data centres, and offshore wind clusters while tackling acute labour shortages through single-operator survey workflows. Thailand’s continuous operation reference station (CORS) build-out, supported by Japan International Cooperation Agency funding, further expanded precise-point-positioning coverage for robots in the Eastern Economic Corridor.
North America remained an innovation crucible through early BIM mandates and stringent positional-tolerance codes in high-seismic zones. The U.S. Department of Transportation’s Digital As-Builts initiative requires centimetre-graded deliverables across federally-funded highways, ensuring steady demand as every state DOT phases out 2D paper plans. Canada’s Hydro-Québec employed robotic total stations to monitor hydro-dam deformation where GNSS signals were shadowed by steep valley walls, underscoring optical relevance in northern latitudes.
Europe continued to invest via Horizon Europe’s USD 183.5 million robotics work program, funnelling R&D into AI-enhanced optics and automated tunnel guidance. Scandinavian countries standardised IFC deliverables, compelling contractors to certify positional accuracy at handover. Meanwhile, the Middle East funneled petro-revenues into giga-projects such as NEOM and smart-port redevelopments, each requiring dense control networks and around-the-clock monitoring in desert heat where drones faltered.
Market Concentration
Established vendors such as Trimble, Hexagon’s Leica Geosystems, and Topcon continued to hold sway through deep patent portfolios, global repair depots, and aggressive software-centric pivots. Trimble posted USD 840.6 million in Q1 2025 revenue and reiterated its USD 3.37–3.47 billion full-year outlook while highlighting 6% organic growth in Field Systems, signalling resilient core demand despite supply-chain headwinds. Hexagon’s 450 product launches in 2024, coupled with plans to spin off Asset Lifecycle Intelligence, freed capital to double down on optical innovation and cloud services.[4]Hexagon, “2024 Sustainability Report,” bynder.hexagon.com
Strategic partnerships flourished as incumbents bridged connectivity gaps; Trimble’s USD 10 million stake in Xona Space Systems integrated LEO-satellite corrections with optical workflows for remote corridors where cellular coverage remains patchy. Topcon’s acquisition of Satel Oy provided proprietary long-range radios, ensuring uninterrupted robot-controller links on wind-farm ridgelines.
Challenger brands from China and South Korea pressed price-sensitive targets with entry-level robots bundled with GNSS, threatening mid-tier margins. Yet premium clients stuck with established suppliers to secure service uptime and certified compliance with cyber-hardening guidelines on defence jobsites. Over the medium term, competition is expected to pivot on integrated software ecosystems rather than pure optics, pushing legacy hardware-centric firms to hurry M&A for AI, cybersecurity, and drone-mapping capabilities.

*Disclaimer: Major Players sorted in no particular order
1. INTRODUCTION
2. RESEARCH METHODOLOGY
3. EXECUTIVE SUMMARY
4. MARKET LANDSCAPE
5. MARKET SIZE AND GROWTH FORECASTS (VALUE)
6. COMPETITIVE LANDSCAPE
7. MARKET OPPORTUNITIES AND FUTURE OUTLOOK
Market Definitions and Key Coverage
Segmentation Overview
Detailed Research Methodology and Data Validation
Primary Research
Desk Research
Market-Sizing & Forecasting
Data Validation & Update Cycle
Why Our Robotic Total Stations Baseline Commands Reliability
Benchmark comparison
| Market Size | Anonymized source | Primary gap driver | ||
|---|---|---|---|---|
USD 0.95 B (2025) | Mordor Intelligence | - | Anonymized source:Mordor Intelligence | Primary gap driver:- |
USD 1.16 B (2025) | Global Consultancy A | Blends manual and robotic units, applies list prices without distributor discounts | ||
USD 0.88 B (2025) | Regional Consultancy B | Excludes aftermarket software revenues that our model counts within hardware value | ||
USD 2.97 B (2024) | Trade Journal C | Uses total station market totals and attributes 100% to robotic class |
Pricing Strategy for Semiconductor Components
3 Min Read
Accelerating Additive Manufacturing Adoption in India
3 Min Read
When decisions matter, industry leaders turn to our analysts. Let’s talk.