Domestic Service Robots Market Size and Share
Market Overview
| Study Period | 2020 - 2031 |
|---|---|
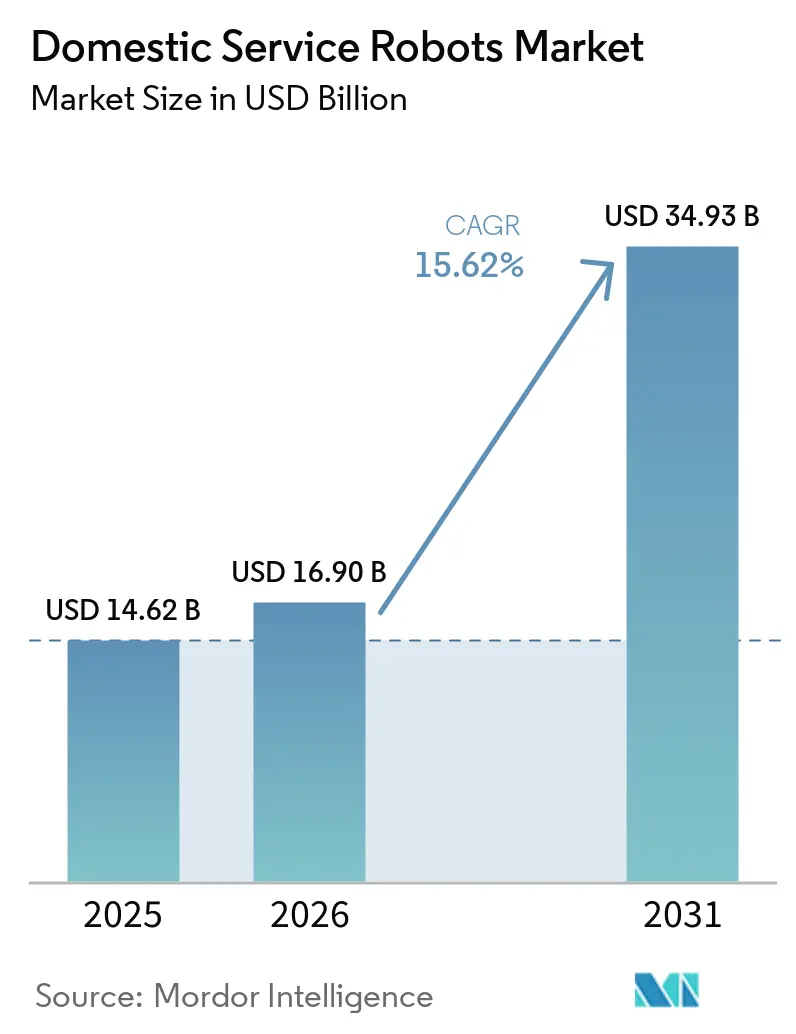
| Market Size (2026) | USD 16.90 Billion |
| Market Size (2031) | USD 34.93 Billion |
| Growth Rate (2026 - 2031) | 15.62% CAGR |
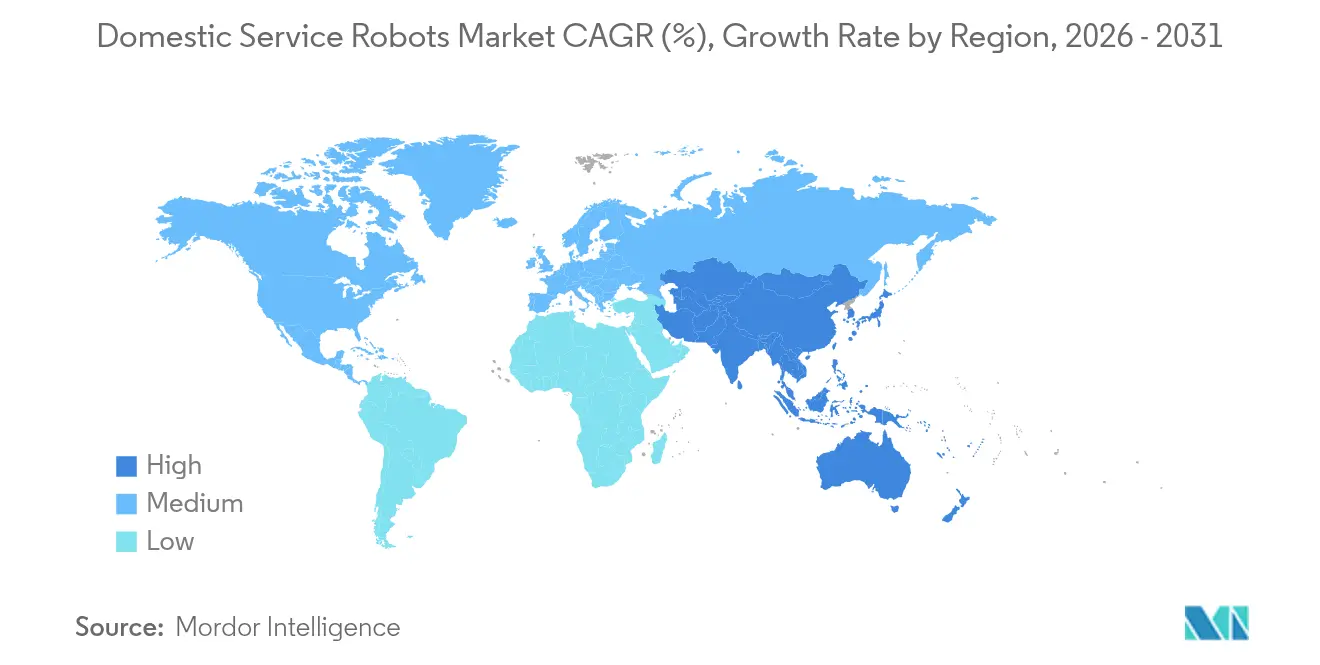
| Fastest Growing Market | Asia Pacific |
| Largest Market | North America |
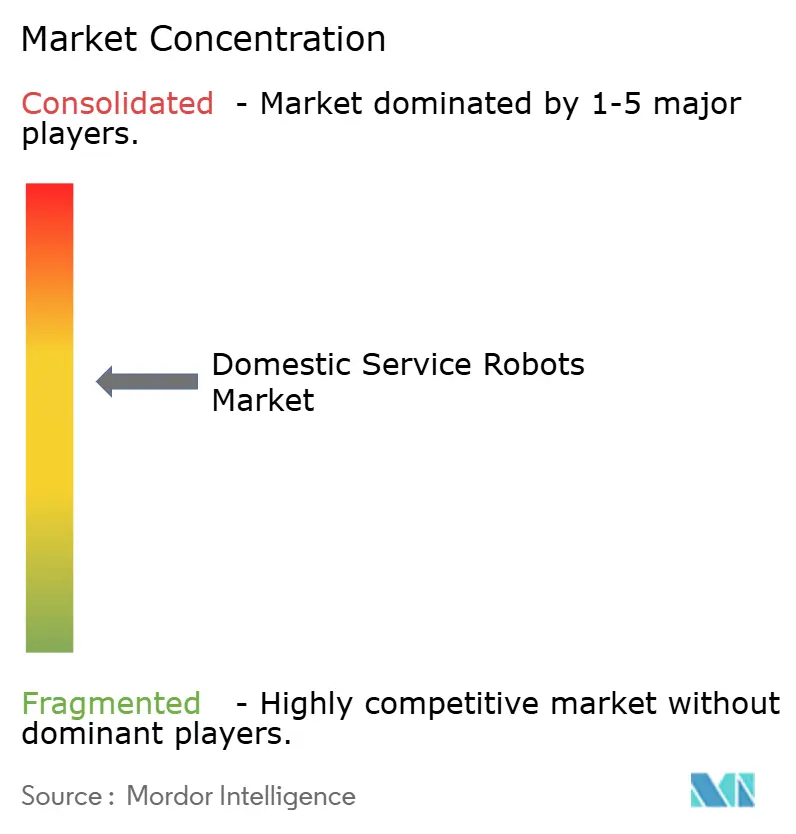
| Market Concentration | Medium |
Major Players *Disclaimer: Major Players sorted in no particular order Image © Mordor Intelligence. Reuse requires attribution under CC BY 4.0. | |
Domestic Service Robots Market Analysis by Mordor Intelligence
The domestic service robots market size is expected to grow from USD 14.62 billion in 2025 to USD 16.9 billion in 2026 and is forecast to reach USD 34.93 billion by 2031 at 15.62% CAGR over 2026-2031. Heightened automation appetite, semiconductor supply-chain redesigns that lifted CMOS chip prices by nearly 40% in 2024, and accelerating subscription models have collectively expanded the domestic service robots market footprint. Robots were expected to perform 39% of household chores within a decade, a projection that reshaped consumer perceptions of home labour delegation.[1]World Economic Forum, “Robots Could Perform 39% of Domestic Tasks Within a Decade,” weforum.org Segment momentum shifted from utility-oriented floor cleaners to emotionally intelligent companions, while AI-enabled connectivity stacks raised cross-device orchestration expectations. Regional dynamics crystallized around North America’s early adopter advantage and Asia-Pacific’s rapid scale-up, fuelled by demographic pressures and cost-efficient manufacturing. The competitive axis pivoted when Roborock surpassed iRobot with 16% global share, underscoring the power of navigation innovation and resilient local supply chains. Cyber-security gaps, epitomized by high-profile robot vacuum breaches, and the European Union’s 2025 Data Act raised the bar for privacy-by-design compliance, positioning security credentials as a differentiator.
Key Report Takeaways
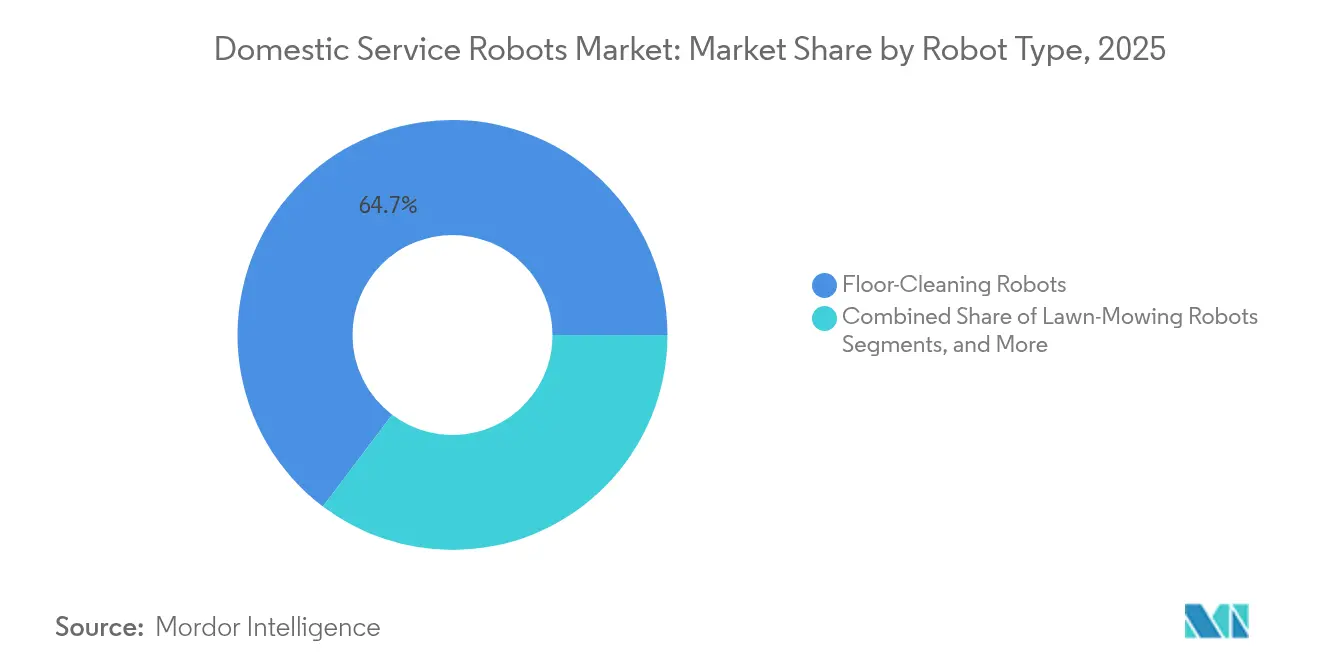
- By robot type, floor-cleaning units led with 64.70% revenue share in 2025; companion and social-interaction models are projected to expand at an 17.60% CAGR to 2031.
- By application, vacuuming and mopping captured 65.60% of the domestic service robots market size in 2025, while elderly-care functions are advancing at an 17.70% CAGR through 2031.
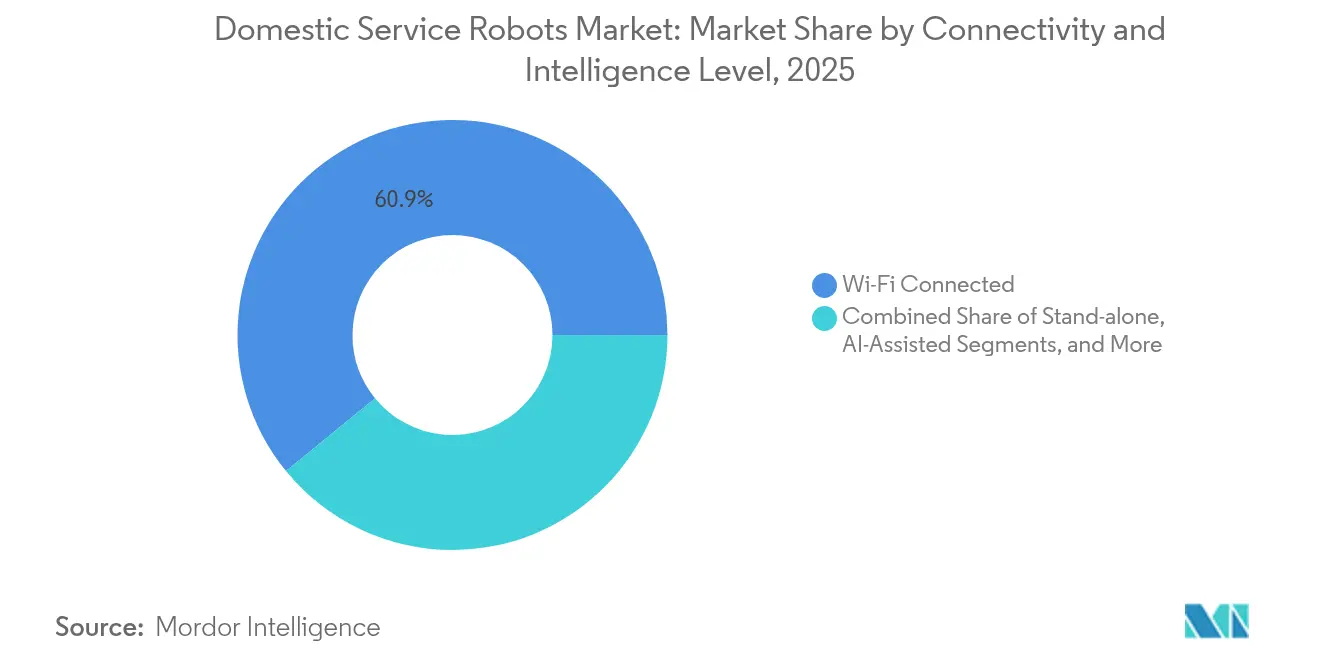
- By connectivity, Wi-Fi robots accounted for 60.90% share of the domestic service robots market size in 2025; AI-assisted systems post the fastest 20.10% CAGR.
- By distribution channel, online retail held 61.80% share of the domestic service robots market in 2025, whereas subscription-based RaaS models record a 19.00% CAGR to 2031.
- By geography, North America commanded 38.30% domestic service robots market share in 2025; Asia-Pacific is forecast to grow at a 19.70% CAGR to 2031.
Note: Market size and forecast figures in this report are generated using Mordor Intelligence’s proprietary estimation framework, updated with the latest available data and insights as of 2026.
Global Domestic Service Robots Market Trends and Insights
Drivers Impact Analysis*
| Driver | (~) % Impact on CAGR Forecast | Geographic Relevance | Impact Timeline |
|---|---|---|---|
| Growing adoption in smart-home ecosystems | +3.2% | Global, with early gains in North America and the EU | Medium term (2-4 years) |
| An aging population and assisted-living demand | +4.1% | Global, concentrated in Japan, the EU, and North America | Long term (≥ 4 years) |
| Labour shortages for domestic chores | +2.8% | Global, particularly acute in developed markets | Short term (≤ 2 years) |
| Home-insurance risk-mitigation programs | +1.5% | North America and the EU core markets | Medium term (2-4 years) |
| Subscription-based RaaS lowers CAPEX | +2.9% | Global, with faster adoption in APAC | Short term (≤ 2 years) |
| Indoor-air-quality driven hygiene labels | +1.4% | Global, with premium market focus | Medium term (2-4 years) |
| Source: Mordor Intelligence | |||
Growing adoption in smart-home ecosystems
Manufacturers repositioned domestic robots as roaming control hubs rather than isolated gadgets. Voice-assistant tie-ins, such as Alexa integration with mobile platforms, enabled room-to-room orchestration of lighting, climate, and entertainment, elevating robots to the centre of home automation. Hardware vendors prioritised open APIs to ensure frictionless onboarding with existing sensors and cameras. The shift attracted ecosystem investors who view recurring software updates as value retention levers.
Aging population and assisted-living demand
Japan’s super-aged society catalysed social-assistive robot pilots that supplemented overstretched caregiving staff. Clinical studies recorded moderate to high acceptance of robot-mediated therapy for autism and dementia, accelerating grant funding for companion platforms. Government incentives for in-home monitoring solutions encouraged vendors to embed fall-detection and medication-reminder modules, fortifying the domestic service robots market growth narrative.
Labour shortages for domestic chores
Tight household-services labour pools in North America and Western Europe drove consumers toward automated floor care, lawn maintenance and pool cleaning solutions. Time savings—over 130 hours a year for cleaning alone—resonated with dual-income families and remote workers, enhancing willingness to subscribe to multi-function packages. Manufacturers responded with task-specific add-ons that reduced the total cost of ownership relative to hiring periodic services.
Subscription-based RaaS lowers CAPEX
Robotics-as-a-Service transformed a high-ticket purchase into a monthly utility expense. Analysts expected 1.3 million household RaaS deployments to yield USD 34 billion in recurring revenue by 2026. Vendors bundled hardware, software updates, and maintenance, shrinking payback periods to under twelve months. Usage-based pricing unlocked younger, urban demographics that value flexibility, reinforcing steady cash flows for continuous R&D.
Restraints Impact Analysis*
| Restraint | (~) % Impact on CAGR Forecast | Geographic Relevance | Impact Timeline |
|---|---|---|---|
| Data privacy and cybersecurity risks | -2.7% | Global, particularly acute in the EU under GDPR | Short term (≤ 2 years) |
| High upfront cost of multi-function robots | -1.9% | Global, with higher impact in price-sensitive markets | Medium term (2-4 years) |
| Fragmented domestic IoT standards | -1.3% | Global, with regional variation in standards adoption | Long term (≥ 4 years) |
| Ethical worries over child-robot bonding | -0.8% | Developed markets with higher ethical awareness | Long term (≥ 4 years) |
| Source: Mordor Intelligence | |||
Data privacy and cybersecurity risks
High-profile exploits in 2024 allowed attackers to commandeer robot vacuums, stream video feeds, and broadcast hate speech, shaking consumer confidence.[2]ABC News, “Hackers Take Control of Robot Vacuums in Multiple Cities,” abc.net.au The EU Data Act, effective September 2025, placed explicit obligations on device makers to share data only with user consent and to enable data porting. Compliance investments rose as firms adopted zero-trust architectures, secure boot, and end-to-end encryption. Vendors able to validate privacy-by-design gained a marketing edge.
Ethical worries over child-robot bonding
Researchers remained divided on whether long-term child-robot attachment hampers emotional development. Studies documented improved communication skills yet warned about over-dependency risks in special-needs education settings. Parents in high-income regions sought clear usage guidelines, nudging companies to position robots as supplemental tools that reinforce, rather than replace, human interaction. Certification labels for child-safe content emerged as trust-building mechanisms.
*Our forecasts treat driver/restraint impacts as directional, not additive. The impact forecasts reflect baseline growth, mix effects, and variable interactions.
Segment Analysis
By Robot Type: Utility Leaders Meet Social Challengers
Floor-cleaning models controlled a 64.70% domestic service robots market share in 2025, benefiting from early commercialisation and falling navigation sensor costs. Companion robots, however, are projected to mark an 17.60% CAGR through 2031, powered by demographic shifts and improved conversational AI. The domestic service robots market size for companion units is expected to rise sharply as healthcare insurers test reimbursement schemes for in-home monitoring. Roborock’s leap to 16% global share illustrated the advantage of agile firmware updates and regionally sourced components. Kitchen-automation prototypes, including robotic arms that stir, flip, and plate meals, moved from restaurant pilots to premium residential showrooms, widening the innovation funnel.
The lawn-mowing subcategory recorded double-digit growth in large-lot suburbs, boosted by improvements in boundary-free visual SLAM. Pool-cleaning robots preserved a niche among luxury homeowners who prioritise continuous water-quality monitoring. Pet-care robots, though small in absolute numbers, saw a venture funding influx due to rising pet humanisation. Cross-segment feature migration, such as self-emptying dustbins appearing in lawn mowers, signalled engineering synergies that compress product-development cycles.


By Application: From Floors to Feelings
Vacuuming and mopping retained 65.60% share of the domestic service robots market size in 2025, cementing their role as gateway purchases that familiarised households with robotic autonomy. Elder-care and companionship applications are forecast to deliver an 17.70% CAGR to 2031 as ageing societies demand fall alerts, cognitive stimulation, and remote vitals logging. The domestic service robots market share of care applications is set to expand when insurers factor reduced hospital readmissions into premium calculations. Surveillance functions gained traction where local regulations allowed mobile cameras, although privacy sensitivities limited blanket adoption. Multi-modal units that blend cleaning, security, and entertainment within one chassis proliferated, enabling upsell paths without new hardware investment.
Demand for robotic lawn services accelerated in regions with labour shortages and high hourly wage rates. Developers addressed early adoption hurdles—such as boundary wire placement—through camera-based geofencing. Pool-cleaning robots achieved steady replacement demand as filter technology improvements reduced maintenance intervals. Functional diversification underscored a trend where single robots tackle multiple chores during idle cycles, maximising return on battery capacity.
By Connectivity and Intelligence Level: Smart Gains Go Premium
Wi-Fi-enabled robots held a 60.90% share in 2025, reflecting mainstream connectivity needs. AI-assisted platforms with visual SLAM and object-recognition engines will expand at 20.10% CAGR, transforming robots into roaming data nodes that map indoor environments in real time. Visual SLAM breakthroughs by industrial peers such as ABB shortened the path to domestic deployment, improving navigation around pets and furniture. The domestic service robots market size for premium AI tiers is forecast to rise as component prices fall and cloud inference costs decline.
Standalone, non-connected robots persisted in privacy-conscious households but faced feature gaps against cloud-linked rivals. Multi-robot coordination entered pilot homes where vacuum, mop, and air-quality bots shared spatial maps, reducing duplicated coverage. Edge AI chips improved local processing, cutting latency, and ensuring operation continuity during network outages.
By Distribution Channel: E-commerce Meets Subscriptions
Online retailers captured 61.80% share of the domestic service robots market in 2025, supported by consumer familiarity with electronics e-commerce and extensive product reviews. Subscription services outpaced all other channels with a 19.00% CAGR outlook, converting a one-time hardware sale into an annuity model. Vendors bundled firmware updates, accessory replenishment, and on-site servicing, raising switching costs. Brick-and-mortar outlets retained relevance for high-value multi-function robots where demonstrations influence buying decisions. Hybrid show-and-subscribe kiosks appeared in malls, allowing walk-in trials followed by digital sign-ups.
Geography Analysis
North America commanded 38.30% of the domestic service robots market share in 2025, buoyed by high disposable income, established smart-home penetration, and clear liability frameworks. Retailers integrated extended warranties that eased adoption anxiety. The region’s subscription uptake amplified recurring revenue visibility.
Asia-Pacific is projected to post a 19.70% CAGR to 2031, driven by South Korea’s world-leading robot density and Japan’s demographic urgency. Chinese brands leveraged scale manufacturing and local component ecosystems to offer competitive price-performance ratios, facilitating export surges once domestic demand plateaued.
Europe’s domestic service robots market size expanded as regulators finalised the Data Act and AI liability rules, creating a harmonised yet strict compliance landscape that favoured firms with strong privacy credentials. Scandinavian countries piloted energy-efficient charging stations tied to renewable power grids, tying domestic robots to sustainability targets. Western European consumers displayed heightened ethical scrutiny, prompting transparent data-handling disclosures.
South America and the Middle East and Africa recorded early-stage growth. Currency volatility and import duties weighed on upfront sales, but subscription offerings reduced sticker shock. Local distributors partnered with global brands to navigate customs and after-sales logistics, while city authorities tested robot-assisted waste sorting in gated communities.

Competitive Landscape
Competitive intensity increased as new entrants wielded navigation software differentiation while incumbents battled cost inflation. Roborock, Ecovacs, and Dreame jointly held 34% domestic service robots market share in 2024, displacing pioneers that struggled to refresh product lines at competitive price points. iRobot issued a going-concern notice in March 2025, signalling financial strain amid heightened discounting.
Strategic investment surged. Samsung increased its stake in Rainbow Robotics to 35%, marrying sensor stacks with humanoid prototypes. Schneider Electric earmarked USD 700 million for U.S. automation plants that will incorporate motion components suited to next-generation domestic robots.[4]Schneider Electric, “Schneider Electric Plans to Invest Over USD 700 Million in the U.S.,” se.com DJI diversified beyond drones, debuting a robotic cleaner in June 2025 to exploit its vision-system heritage.
Technology roadmaps converged on AI inference acceleration, self-emptying docks, and multi-room mapping. Vendors filed patents for modular tool carriers that enable quick re-purposing between vacuuming, UV sterilisation, and fragrance diffusion. Price wars intensified around entry-level models, but premium tiers preserved margins through bundled services and proprietary consumables.
Domestic Service Robots Industry Leaders
iRobot Corporation
Ecovacs Robotics Co. Ltd.
Roborock Technology Co. Ltd.
Samsung Electronics Co. Ltd.
SharkNinja Operating LLC
- *Disclaimer: Major Players sorted in no particular order

Recent Industry Developments
- June 2025: DJI launched its first robotic cleaner, signalling expansion beyond aerial drones.
- May 2025: Kudan, NexAIoT, and NVIDIA deployed visual-SLAM robots in live factories, accelerating navigation tech transfer to home units.
- March 2025: Schneider Electric announced a USD 700 million U.S. investment for AI-enabled motion products.
- March 2025: iRobot warned of substantial doubt regarding continued operations.


Research Methodology Framework and Report Scope
Market Definitions and Key Coverage
Our study defines the domestic service robots market as all purpose-built autonomous or semi-autonomous machines sold for household tasks such as floor cleaning, lawn mowing, pool maintenance, companionship, and in-home monitoring; revenue is captured at factory gate and converted to constant 2025 USD. The scope follows the International Federation of Robotics' personal service taxonomy and spans five regions and every major distribution channel.
Scope Exclusions: robots strictly for professional cleaning, warehousing, or surgical assistance fall outside this review.
Segmentation Overview
- By Robot Type
- Floor-Cleaning Robots
- Lawn-Mowing Robots
- Pool-Cleaning Robots
- Companion and Social-Interaction Robots
- Kitchen and Food-Preparation Robots
- Pet-Care Robots
- Other Robot Types
- By Application
- Vacuuming and Mopping
- Lawn Mowing
- Pool Cleaning
- Surveillance and Home Security
- Companionship and Elderly Care
- Pet Entertainment and Feeding
- Other Applications
- By Connectivity and Intelligence Level
- Stand-alone (No Connectivity)
- Wi-Fi Connected
- AI-Assisted (Visual-SLAM etc.)
- Multi-Robot Coordinated Systems
- By Distribution Channel
- Online Retail
- Offline Retail
- Direct Subscription / RaaS
- By Geography
- North America
- United States
- Canada
- Mexico
- South America
- Brazil
- Argentina
- Rest of South America
- Europe
- Germany
- United Kingdom
- France
- Italy
- Spain
- Russia
- Rest of Europe
- Asia-Pacific
- China
- Japan
- South Korea
- India
- ASEAN
- Rest of Asia-Pacific
- Middle East and Africa
- Middle East
- Saudi Arabia
- UAE
- Turkey
- Rest of Middle East
- Africa
- South Africa
- Nigeria
- Rest of Africa
- Middle East
- North America
Detailed Research Methodology and Data Validation
Primary Research
Mordor analysts conducted structured interviews with robot OEM engineers, motor suppliers, regional distributors, and smart-home retailers across North America, Europe, and Asia-Pacific. Insights on bundle pricing, return rates, and subscription uptake were gathered through these conversations, allowing us to validate secondary data and refine assumptions.
Desk Research
We began by mapping publicly available indicators from authoritative bodies such as the International Federation of Robotics, UN Comtrade, Eurostat, and the U.S. Census Bureau, which outline unit shipments, trade flows, and household adoption of smart appliances. Annual technology outlooks from IEEE Xplore, patent families in Questel, and regulatory updates from the European Commission helped our analysts decode innovation pace and safety directives shaping demand.
Company 10-Ks, investor decks, and press releases supplied average selling prices, while news archives in Dow Jones Factiva provided timely insight on product launches and recalls. These sources, together with regional trade associations for consumer electronics and gardening equipment, give the foundational layer; yet many additional public materials were examined to cross-check facts and fill minor gaps.
Market-Sizing & Forecasting
We adopt a top-down demand pool reconstruction, starting from IFR residential unit shipments and household penetration rates, which are then multiplied by region-specific ASPs derived from filings and interview feedback. Supplier roll-ups and sampled online channel checks offer a selective bottom-up lens that we use to fine-tune totals. Key model drivers include disposable income per household, broadband connectivity, aging population ratios, lithium-ion battery cost curves, and AI processor price trends. A multivariate regression incorporating these variables projects volume through 2030; scenario analysis adjusts for regulatory delays or rapid price erosion. Any country lacking granular shipment data is benchmarked against nearest-neighbor adoption curves and adjusted through expert opinion.
Data Validation & Update Cycle
Outputs pass a three-step review: numerical anomaly screening, peer analyst challenge, and senior sign-off. We compare yearly results with independent signals like retail scanner data and IFR trend reports, re-running models when deviations exceed predefined thresholds. The entire dataset is refreshed annually, with interim updates triggered by material events such as a disruptive product recall.
Why Mordor's Domestic Service Robots Baseline Commands Reliability
Published estimates often diverge because firms choose dissimilar robot types, currency bases, and forecast cadences. Our disciplined scope alignment and yearly model refresh narrow these gaps.
Key gap drivers include whether entertainment robots are merged with cleaning units, how aspirational ASP reductions are modeled, and the extent of primary validation undertaken.
Benchmark comparison
| Market Size | Anonymized source | Primary gap driver |
|---|---|---|
| USD 14.62 billion (2025) | Mordor Intelligence | - |
| USD 12.18 billion (2024) | Global Consultancy A | Bundles leisure and educational robots, minimal interview feedback |
| USD 8.20 billion (2024) | Trade Journal B | Excludes lawn-mowing and pool-cleaning categories; list-price × shipments only |
| USD 10.30 billion (2023) | Industry Association C | Stops forecast at 2028 and retains 2023 USD without inflation normalization |
The comparison shows that, by selecting the right robot family mix, validating ASPs in real time, and updating models every year, Mordor Intelligence delivers a balanced, transparent baseline that decision-makers can trace back to clear variables and repeatable steps.


Key Questions Answered in the Report
What is the current size and expected growth of the domestic service robots market?
The market reached USD 16.9 billion in 2026 and is projected to expand to USD 34.93 billion by 2031, reflecting a 15.62% CAGR.
Which robot category holds the largest market share today?
Floor-cleaning units led with 64.70% revenue share in 2025, making them the most widely adopted domestic robots.
Which geographic region is projected to grow the fastest?
Asia-Pacific is forecast to register the highest 19.70% CAGR through 2031, fuelled by South Korea’s advanced robot density and Japan’s aging-care demand.
How are subscription (RaaS) models affecting adoption rates?
Robotics-as-a-Service converts upfront hardware costs into monthly fees, helping the channel grow at a 19.00% CAGR and widening access to younger, budget-sensitive households.
What are the primary security and regulatory hurdles?
High-profile hacking incidents and the European Union’s 2025 Data Act require manufacturers to adopt privacy-by-design architectures and robust encryption to sustain consumer trust.
Who currently leads the competitive landscape?
Roborock overtook legacy brands with 16% global share in 2024, while Ecovacs and Dreame joined it to command a combined 34% of worldwide revenue.
Page last updated on:


