Mobile Robots Market Size and Share
Market Overview
| Study Period | 2020 - 2031 |
|---|---|
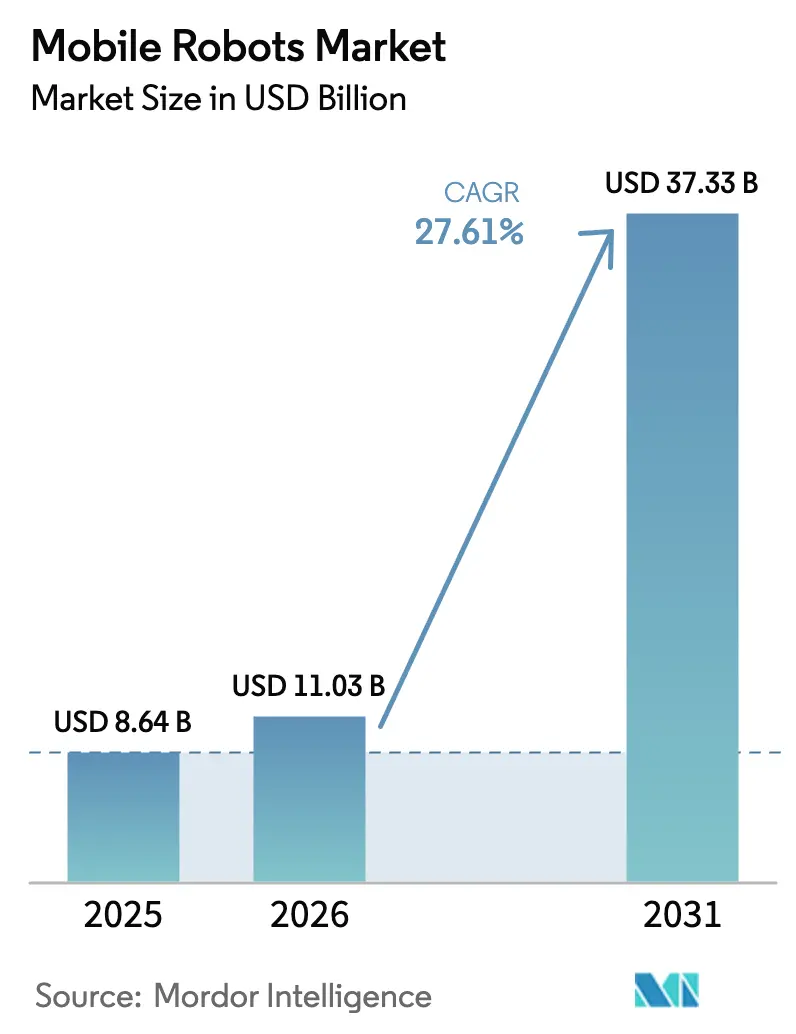
| Market Size (2026) | USD 11.03 Billion |
| Market Size (2031) | USD 37.33 Billion |
| Growth Rate (2026 - 2031) | 27.61% CAGR |
| Fastest Growing Market | Middle East |
| Largest Market | Asia Pacific |
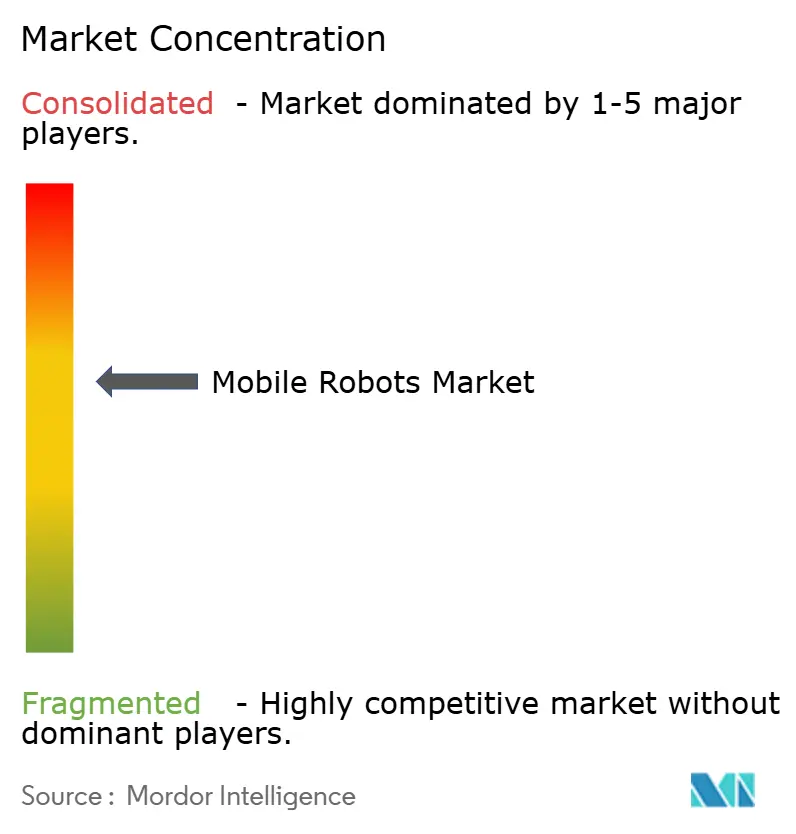
| Market Concentration | Medium |
Major Players *Disclaimer: Major Players sorted in no particular order Image © Mordor Intelligence. Reuse requires attribution under CC BY 4.0. | |
Mobile Robots Market Analysis by Mordor Intelligence
The mobile robots market size is projected to be USD 8.64 billion in 2025, USD 11.03 billion in 2026, and reach USD 37.33 billion by 2031, growing at a CAGR of 27.61% from 2026 to 2031. The surge reflects a shift in how operators view material handling, moving from tactical cost control to a strategic lever that boosts fulfillment speed, labor productivity, and capital efficiency. Fulfillment centers that once relied on conveyor belts and manual pickers now deploy fleets of 50 to 200 autonomous units, cutting order-to-ship cycles from hours to minutes and achieving scalable capacity without months-long civil works. Unit economics favor mobile solutions because projects are completed in weeks, avoiding multi-million-dollar downtime. Vendor competition is intense, and margins have compressed as Chinese entrants have undercut incumbents, but rapid top-line growth still encourages innovation in AI navigation, battery-as-a-service, and 5G fleet orchestration.
Key Report Takeaways
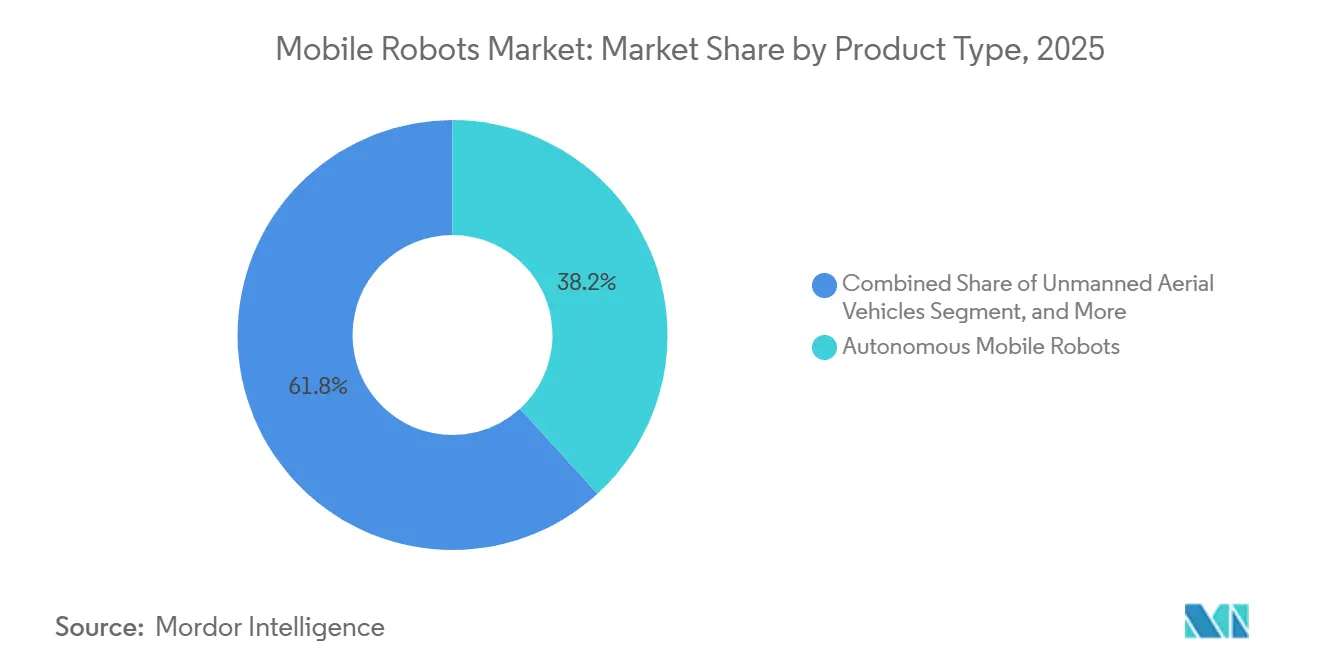
- By product type, autonomous mobile robots held 38.21% of the mobile robots market share in 2025, whereas autonomous mobile manipulation robots are forecast to expand at a 28.73% CAGR to 2031.
- By form factor, unit-load and cart robots accounted for 42.33% share of the mobile robots market size in 2025, and assembly-line mobile platforms are advancing at a 28.43% CAGR through 2031.
- By navigation technology, LiDAR-based SLAM captured 43.67% revenue share in 2025, while camera-only vision systems are poised to grow at a 28.69% CAGR to 2031.
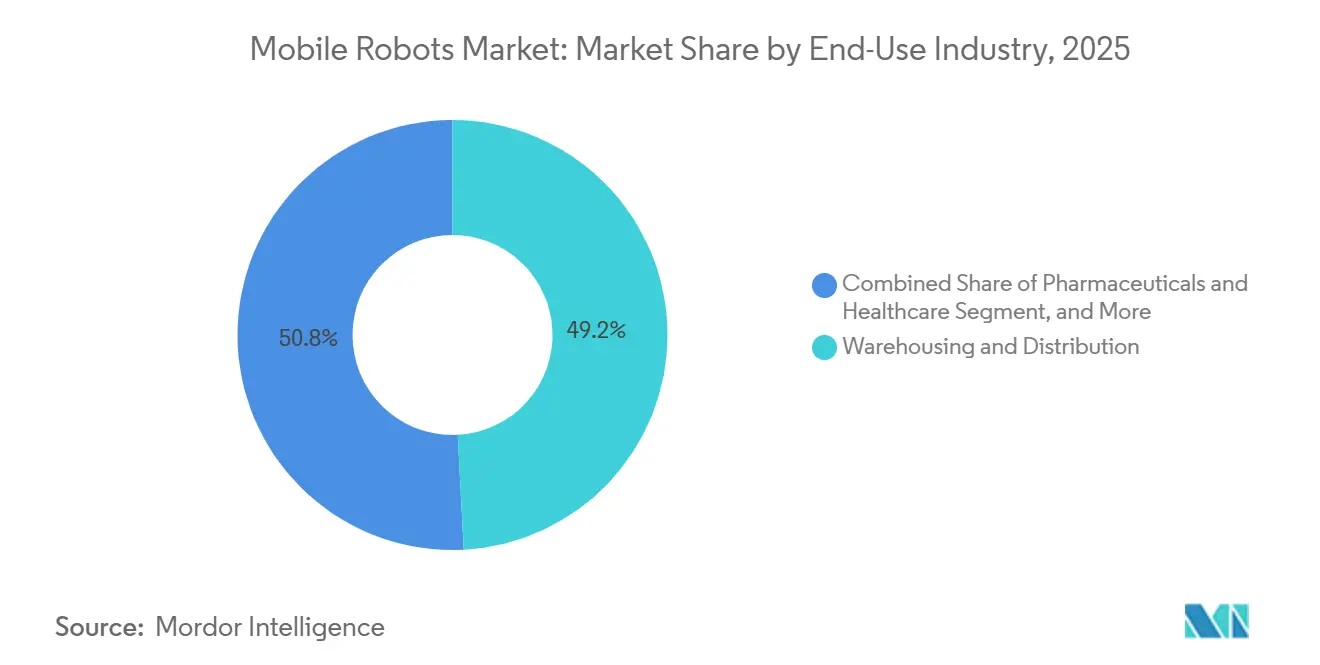
- By end-use industry, warehousing and distribution accounted for 49.17% of spending in 2025, yet pharmaceuticals and healthcare are projected to grow at a 28.62% CAGR during 2026-2031.
- By payload capacity, robots handling 100-500 kilograms held a 37.22% share in 2025, whereas platforms above 1,000 kilograms are set to post a 28.47% CAGR through 2031.
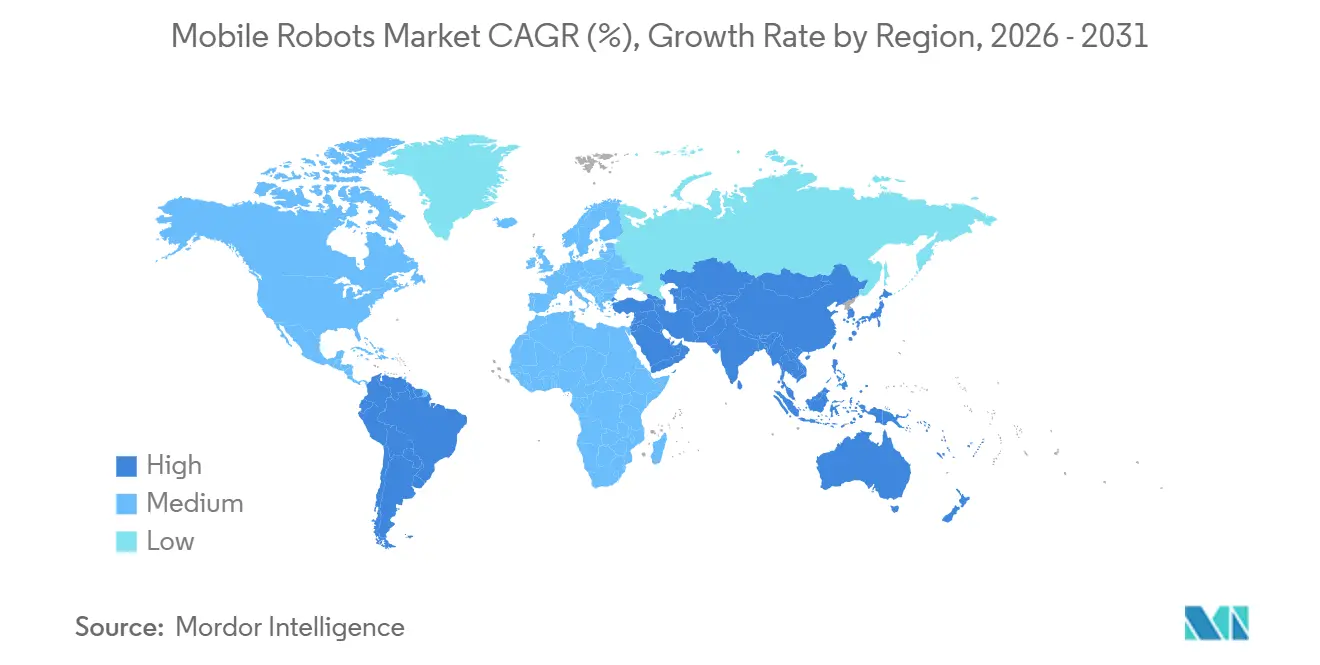
- By geography, Asia-Pacific led with 44.69% revenue share in 2025, while the Middle East is projected to post the fastest 28.66% CAGR through 2031.
Note: Market size and forecast figures in this report are generated using Mordor Intelligence’s proprietary estimation framework, updated with the latest available data and insights as of 2026.
Global Mobile Robots Market Trends and Insights
Drivers Impact Analysis*
| Driver | (~) % Impact on CAGR Forecast | Geographic Relevance | Impact Timeline |
|---|---|---|---|
| Surge in E-commerce Warehouse Automation | +6.8% | Global, with peak intensity in North America, Europe, and Asia-Pacific urban clusters | Short term (≤ 2 years) |
| Rising Labour-Cost and Skilled-Worker Shortages | +5.9% | Global, most acute in Japan, Germany, United States, and South Korea | Medium term (2-4 years) |
| Advances in AI and Sensor-Fusion Cutting Autonomy Costs | +5.2% | Global, with early adoption in North America and Europe, rapid diffusion to Asia-Pacific | Medium term (2-4 years) |
| 5G Private Networks Enabling Large-Fleet Orchestration | +4.1% | Global, with concentrated deployments in North America, Europe, and China | Long term (≥ 4 years) |
| Battery-as-a-Service Lowering Upfront CAPEX | +3.3% | Global, with strongest uptake in North America and Europe among mid-sized operators | Medium term (2-4 years) |
| Carbon-Neutral Logistics Retrofits Accelerating Deployments | +2.3% | Europe and North America, with emerging traction in Middle East and Asia-Pacific | Long term (≥ 4 years) |
| Source: Mordor Intelligence | |||
Surge in E-commerce Warehouse Automation
Order volumes that doubled between 2024 and 2025 forced operators to choose between a 40%-60% headcount expansion or fleets of mobile robots that pick, sort, and stage inventory with one-tenth the labor hours. Amazon fielded more than 750,000 mobile units by the close of 2025 and cut pick times from 90 seconds to under 10, setting speed benchmarks competitors must meet or risk losing customers. Third-party logistics providers adopted robots at a 35% annual clip, and 70% of new U.S. warehouses broke ground in 2025 with ceiling heights, aisle widths, and power drops optimized for autonomous fleets.[1]Manufacturing and Trade Division, “Monthly Warehousing Construction Starts,” census.gov Automation has become a permanent fixture because consumers now expect same-day delivery irrespective of retailer size.
Rising Labor-Cost and Skilled-Worker Shortages
Japan’s working-age population shrank by 1.2 million from 2024 to 2025, lifting factory wages 8% and prompting automotive suppliers to deploy mobile manipulators for torque wrenching and quality checks.[2]Statistics Bureau, “Population Estimates 2025,” stat.go.jp Germany recorded 180,000 unfilled logistics jobs in 2025, up 15% year-on-year, while U.S. warehouse pay reached USD 19.50 per hour, squeezing manual labor economics. South Korea projects a 25% factory-labor shortfall by 2027, reinforcing structural demand for robotic replacements. The demographic drag assures double-digit adoption even during cyclical downturns.
Advances in AI and Sensor Fusion Cutting Autonomy Costs
Transformer-based depth estimation enables camera-only navigation that cuts hardware costs by 70%-85% compared to LiDAR, enabling entry-level robots priced below USD 15,000. Tesla’s vision-only Optimus validated monocular depth in commercial settings, and edge inference chips now decrease power draw by 60%, extending runtime to 14 hours. With reliability equal to LiDAR in indoor logistics, the total cost of ownership falls below 12 months for high-throughput sites, triggering mass adoption.
5G Private Networks Enabling Large-Fleet Orchestration
Private 5G delivers sub-10-millisecond latency and 99.99% uptime, a quantum leap over enterprise Wi-Fi. DHL’s Leipzig mega-hub synchronized 150 autonomous units in real time and cut processing time by 30% after activating a 5G network in early 2025.[3]Innovation Report, “Private 5G at Leipzig Hub,” group.dhl.com Affordable USD 200 modules from Qualcomm make 5G viable for facilities shipping 10,000-plus orders daily, and deterministic connectivity raises fleet availability, directly adding millions in throughput.
Restraints Impact Analysis*
| Restraint | (~) % Impact on CAGR Forecast | Geographic Relevance | Impact Timeline |
|---|---|---|---|
| High CAPEX and ROI Uncertainty | -4.7% | Global, with acute sensitivity among small and mid-sized operators in South America, Africa, and Southeast Asia | Short term (≤ 2 years) |
| Legacy-Site Connectivity Limitations | -3.8% | Global, concentrated in North America and Europe brownfield facilities built before 2015 | Medium term (2-4 years) |
| Shortage of Safety-Certified AMR Software Frameworks | -2.6% | Global, with regulatory bottlenecks most severe in Europe and North America | Medium term (2-4 years) |
| Semiconductor and LiDAR Supply-Chain Volatility | -2.1% | Global, with peak disruption in Asia-Pacific manufacturing hubs | Short term (≤ 2 years) |
| Source: Mordor Intelligence | |||
High CAPEX and ROI Uncertainty
A 10-robot pilot requires USD 500,000 upfront, while 100-unit systems exceed USD 5 million in capital, which many mid-market distributors cannot spare. Integration, training, and process redesign inflate initial quotes by 30%-50%, stretching payback from vendor-promised 24 months to as long as 48 months. Battery-as-a-service subscriptions convert CAPEX to OPEX but still have low adoption because operators worry about vendor lock-in and residual-value risk.
Legacy-Site Connectivity Limitations
Warehouses built before 2015 have narrow aisles, steel-reinforced concrete that blocks signals, and Wi-Fi networks sized for barcode scanners, not 200 autonomous devices. Retrofitting a private 5G network can set businesses back between USD 300,000 and 800,000. While floor reinforcement and ceiling rework may require multi-week shutdowns, leading to significant productivity losses, greenfield sites are opting for robots at a pace three times faster than their brownfield counterparts.
*Our forecasts treat driver/restraint impacts as directional, not additive. The impact forecasts reflect baseline growth, mix effects, and variable interactions.
Segment Analysis
By Product Type: Manipulation-Capable Platforms Accelerate Adoption
Autonomous mobile robots retained a 38.21% share in 2025, yet growth slows as warehouses exhaust easy transport tasks. The mobile robots market for autonomous mobile manipulation robots is projected to expand at a 28.73% CAGR, driven by demand for single platforms that both convey goods and execute work steps. Automated guided vehicles operate in automotive lines with fixed routes, and unmanned ground vehicles operate in outdoor yards where GPS suffices.
Integrating collaborative arms priced below USD 25,000 onto USD 40,000 mobile bases slashes capital intensity and shortens changeovers when product variants proliferate. Pharmaceutical cleanrooms favor stainless, particle-free manipulators, while electronics plants value rapid redeployability across 18-month product cycles. Vendors that master manipulation stacks gain pricing power because transport alone accounts for only 30%-40% of warehouse labor costs.


By Form Factor: Assembly Platforms Outpace Unit-Loads
Unit-load and cart robots captured 42.33% of form-factor revenue in 2025, leveraging simple mechanics and sub-USD 30,000 price points. Manufacturers are increasingly replacing fixed conveyors with reconfigurable bases that support multi-model production. This shift allows for greater flexibility and efficiency in manufacturing processes, driving assembly-line platforms to forecast the fastest CAGR of 28.43% during the forecast period.
Automotive groups such as Volkswagen validated assembly platforms by producing battery-electric, hybrid, and internal-combustion cars on the same line without months of downtime. Electronics assemblers pivot every two years, so hardware that moves with the product roadmap wins capital approval. Self-driving forklifts and tow tractors remain essential for heavy lifts above 1,000 kilograms, but their addressable tasks narrow as lighter products dominate e-commerce.
By Navigation Technology: Vision Systems Narrow Performance Gap
LiDAR-based SLAM led with 43.67% revenue in 2025, but camera-only vision grew at a 28.69% CAGR, as hardware costs fell to USD 500-2,000 and transformer models matched LiDAR within 5% accuracy. Vendors are increasingly launching lower-priced lines of vision systems, making them more accessible to cost-sensitive operators. This trend is expected to drive a significant rise in the market share of vision systems within the mobile robots market.
Hybrid suites that fuse LiDAR, cameras, inertial units, and wheel odometry keep a niche in semiconductor and pharmaceutical fabs where micron-level positioning is non-negotiable. QR-code guidance persists in static layouts thanks to sub-USD 100 infrastructure, yet lacks the flexibility modern warehouses need. The tipping point arrived when Locus Robotics and GreyOrange released camera-only models priced 30% below LiDAR peers.
By End-Use Industry: Regulated Verticals Create High-Margin Niches
In 2025, warehousing and distribution accounted for 49.17% of spending. However, by 2031, pharmaceuticals and healthcare are set to emerge as the fastest-growing sectors, with a projected share of 28.62%. Robots, priced between USD 60,000-100,000 and certified for FDA 21 CFR Part 11 traceability, offer compliance, sterility, and an unmatched 24-hour uptime, a feat hospitals struggle to achieve with human staff.
Manufacturers in the automotive, electronics, and aerospace sectors are turning to robots to eliminate stranded conveyors. This shift has led to a 40% reduction in work-in-process buffers, subsequently freeing up floor space for new product lines. Meanwhile, the food and beverage sector's adoption of this technology is slower. The reason? Compliance with stainless, IP69K, and NSF specifications drives up costs by 40%-60%, making it economically viable only for high-volume operators.
By Payload Capacity: Heavy-Duty Robots Remove Last Manual Hurdles
In 2025, robots with a payload capacity of 100-500 kilograms commanded a 37.22% market share. Meanwhile, platforms boasting capacities exceeding 1,000 kilograms are projected to achieve a robust 28.47% CAGR through 2031. This growth is driven by increasing demand for high-capacity automation solutions across industries. In cold storage environments, where hourly labor costs surpass USD 30 and employee turnover rates exceed 50%, autonomous forklifts with a lifting capacity of 2,500 kilograms are proving to be highly cost-effective, achieving a return on investment in under 24 months. These forklifts are becoming indispensable in optimizing operations and reducing dependency on manual labor.
With advancements in lithium-ion battery technology, energy densities now exceed 200 Wh/kg, enabling operations to run continuously for 8-10 hour shifts without requiring charging breaks. This development has significantly enhanced productivity and operational efficiency. Industries such as automotive and appliances, which handle heavy and low-mix loads, are increasingly adopting heavy robots to meet their specific requirements. On the other hand, sectors like pharmaceuticals and electronics prefer lighter, more compact robotic units. These units are particularly suited for navigating narrow corridors and adhering to stringent cleanroom standards, ensuring precision and compliance in sensitive environments.
Geography Analysis
Asia-Pacific accounted for 44.69% of revenue in 2025, reflecting China’s mega-sortation hubs that field thousands of mobile robots during Singles’ Day peaks and Japan’s labor shortage, which hastens factory automation. India’s e-commerce boom and South Korea’s fast product cycles deepen regional momentum. Government incentives under Made in China 2025, Society 5.0, and India’s Production-Linked Incentives subsidize capex and lock in multi-year growth trajectories.
The Middle East advances at a 28.66% CAGR through 2031, driven by Saudi Arabia’s USD 500 billion Vision 2030 logistics push and the United Arab Emirates’ ambition to anchor regional e-commerce. DP World and Aramex are integrating robots into Gulf hubs that handle 35% year-on-year growth in cross-border parcels. Sovereign wealth funds guarantee capital irrespective of oil prices, ensuring projects progress even amid macro volatility.
While North America and Europe boast substantial installed bases, the pace of new bookings is hampered by brownfield retrofits. Mexico reaps the rewards of nearshoring, South America experiments with robots in its automotive plants, and Africa grapples with nascent challenges, primarily due to infrastructure and tariff obstacles. As a result, the global mobile robots market presents a clear divide: established regions focus on optimization, whereas emerging areas make a bold leap to 5G-ready, robot-centric facilities.

Competitive Landscape
Competition remains fragmented, with the top five suppliers commanding a mere 30% of the revenue, resulting in a mobile robots market concentration score of 6. Vendors are divided between horizontal platforms utilizing open APIs and vertical stacks that bundle robots, warehouse management systems (WMS), and multi-year services. Chinese manufacturers, including Geek+, Hikrobot, and Seer, have driven hardware prices down by 25%-35%, consequently squeezing gross margins to the mid-30s.
Boston Dynamics’ Stretch demonstrated that vision-based case handling can eliminate the need for complex gripper swaps, reducing box-sortation capital expenditures by 40%. In 2025, patent filings related to navigation surged by 45%, highlighting the industry's race for intellectual property that secures a software edge. Collaborations with tech giants like Qualcomm, Ericsson, and Nokia to integrate 5G modules have emerged as key differentiators, providing latency and uptime advantages over traditional Wi-Fi.
Opportunities abound in sectors like pharmaceuticals, semiconductors, and food processing. Here, stringent requirements for cleanrooms, ATEX, and stainless steel deter generalist vendors. As a result, specialists can command prices 50%-70% higher than standard warehouse robots, all while ensuring a solid return on investment for customers. Mergers are increasingly targeting field-service capabilities, exemplified by KION’s acquisition of Retrotech, which bolstered its team with 200 technicians across North America.
Mobile Robots Industry Leaders
Teradyne, Inc.
KION Group AG
Toyota Industries Corporation
Daifuku Co., Ltd.
Boston Dynamics, Inc.
- *Disclaimer: Major Players sorted in no particular order

Recent Industry Developments
- December 2025: Hikrobot Technology launched its Vision AMR with NVIDIA Jetson processors and camera-only navigation priced at USD 22,000, winning 800-unit orders in Indonesia, Thailand, and Brazil.
- November 2025: Vecna Robotics and DHL Supply Chain deployed 100 robots across U.S. pharmaceutical cold stores with full FDA Part 11 compliance.
- October 2025: Seegrid installed 50 autonomous tow tractors at a Procter and Gamble plant in Ohio, achieving 12-month payback.
- September 2025: Balyo secured ISO 3691-4 certification for its autonomous-forklift software, cutting customer validation cycles to six months.


Global Mobile Robots Market Report Scope
The Mobile Robots Market Report is Segmented by Product Type (Automated Guided Vehicles, Autonomous Mobile Robots, Autonomous Mobile Manipulation Robots, Unmanned Ground Vehicles, Unmanned Aerial Vehicles), Form Factor (Self-Driving Forklifts, Tow, Tractor, Tug Robots, Unit-Load and Cart Robots, Assembly-Line Mobile Platforms), Navigation Technology (LiDAR-Based SLAM, QR and Fiducial Codes, Camera-Only Vision, Hybrid, Magnetic and Reflector Guidance), End-Use Industry (Warehousing and Distribution, Manufacturing, Food and Beverage, Pharmaceuticals and Healthcare, Other End-Use Industries), Payload Capacity (Below 100 kg, 100-500 kg, 500-1,000 kg, Above 1,000 kg), and Geography (North America, South America, Europe, Asia-Pacific, Middle East and Africa). The Market Forecasts are Provided in Terms of Value (USD).
| Automated Guided Vehicles |
| Autonomous Mobile Robots |
| Autonomous Mobile Manipulation Robots |
| Unmanned Ground Vehicles |
| Unmanned Aerial Vehicles |
| Self-Driving Forklifts |
| Tow, Tractor, Tug Robots |
| Unit-Load and Cart Robots |
| Assembly-Line Mobile Platforms |
| LiDAR-Based SLAM |
| QR and Fiducial Codes |
| Camera-Only Vision |
| Hybrid |
| Magnetic and Reflector Guidance |
| Warehousing and Distribution |
| Manufacturing |
| Food and Beverage |
| Pharmaceuticals and Healthcare |
| Other End-Use Industries |
| Below 100 kg |
| 100 - 500 kg |
| 500 - 1,000 kg |
| Above 1,000 kg |
| North America | United States | |
| Canada | ||
| Mexico | ||
| South America | Brazil | |
| Argentina | ||
| Rest of South America | ||
| Europe | United Kingdom | |
| Germany | ||
| France | ||
| Italy | ||
| Rest of Europe | ||
| Asia-Pacific | China | |
| Japan | ||
| India | ||
| South Korea | ||
| Rest of Asia-Pacific | ||
| Middle East and Africa | Middle East | United Arab Emirates |
| Saudi Arabia | ||
| Rest of Middle East | ||
| Africa | South Africa | |
| Egypt | ||
| Rest of Africa | ||
| By Product Type | Automated Guided Vehicles | ||
| Autonomous Mobile Robots | |||
| Autonomous Mobile Manipulation Robots | |||
| Unmanned Ground Vehicles | |||
| Unmanned Aerial Vehicles | |||
| By Form Factor | Self-Driving Forklifts | ||
| Tow, Tractor, Tug Robots | |||
| Unit-Load and Cart Robots | |||
| Assembly-Line Mobile Platforms | |||
| By Navigation Technology | LiDAR-Based SLAM | ||
| QR and Fiducial Codes | |||
| Camera-Only Vision | |||
| Hybrid | |||
| Magnetic and Reflector Guidance | |||
| By End-Use Industry | Warehousing and Distribution | ||
| Manufacturing | |||
| Food and Beverage | |||
| Pharmaceuticals and Healthcare | |||
| Other End-Use Industries | |||
| By Payload Capacity | Below 100 kg | ||
| 100 - 500 kg | |||
| 500 - 1,000 kg | |||
| Above 1,000 kg | |||
| By Geography | North America | United States | |
| Canada | |||
| Mexico | |||
| South America | Brazil | ||
| Argentina | |||
| Rest of South America | |||
| Europe | United Kingdom | ||
| Germany | |||
| France | |||
| Italy | |||
| Rest of Europe | |||
| Asia-Pacific | China | ||
| Japan | |||
| India | |||
| South Korea | |||
| Rest of Asia-Pacific | |||
| Middle East and Africa | Middle East | United Arab Emirates | |
| Saudi Arabia | |||
| Rest of Middle East | |||
| Africa | South Africa | ||
| Egypt | |||
| Rest of Africa | |||


Key Questions Answered in the Report
How fast will autonomous mobile manipulation platforms grow in the mobile robots market?
They are projected to post a 28.73% CAGR from 2026 to 2031, the fastest among product types.
Which navigation technology is winning on cost?
Camera-only vision systems now match LiDAR accuracy within 5% at hardware costs of USD 500-2,000, driving a 28.69% CAGR to 2031.
Why is Asia-Pacific the largest region for mobile robots?
China’s massive e-commerce peaks and Japan’s labor shortages drove a 44.69% revenue share in 2025 with continued policy incentives.
What payload segment is gaining momentum?
Robots above 1,000 kilograms are growing at 28.47% CAGR as autonomous forklifts remove the last manual pallet moves.
How fragmented is supplier competition?
The top five vendors hold about 30% revenue, leaving room for specialized entrants and giving the market a concentration score of 6.
What is the impact of 5G on large fleets?
Private 5G networks cut latency below 10 milliseconds, enabling real-time coordination of 100-plus robots and trimming order processing 30%.
Page last updated on:


