
Retro-Reflective Materials Market Size and Share
Market Overview
| Study Period | 2021 - 2031 |
|---|---|
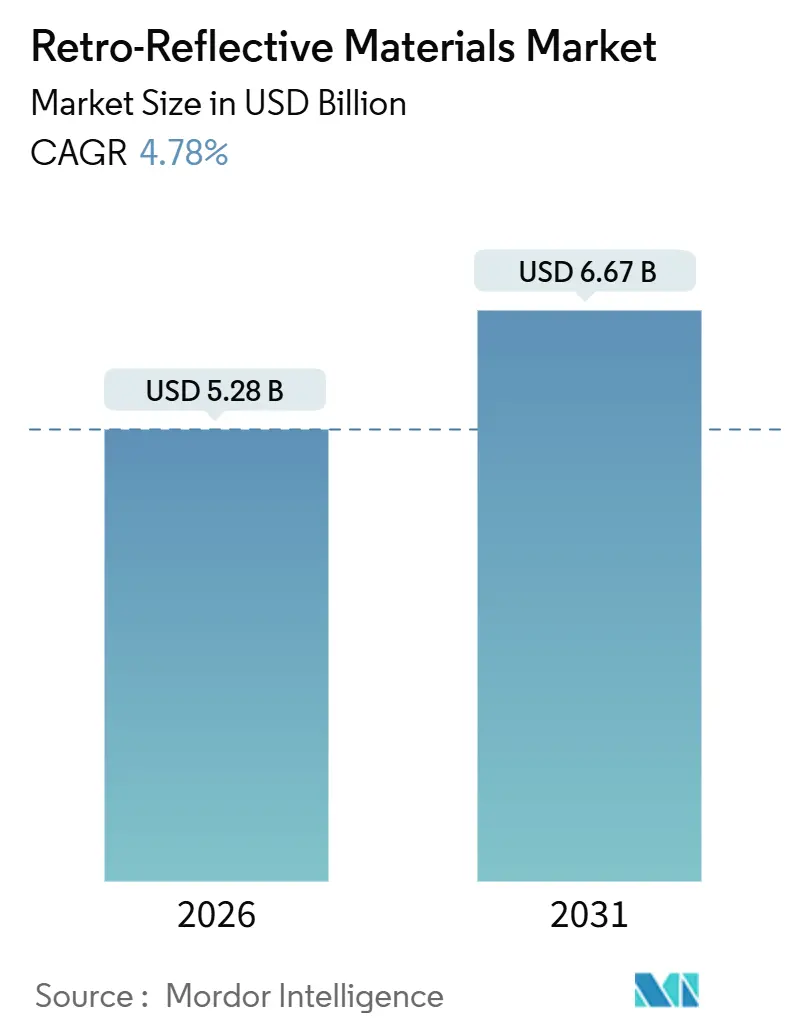
| Market Size (2026) | USD 5.28 Billion |
| Market Size (2031) | USD 6.67 Billion |
| Growth Rate (2026 - 2031) | 4.78 % |
| Fastest Growing Market | Asia Pacific |
| Largest Market | Asia Pacific |
| Market Concentration | Medium |
Major Players *Disclaimer: Major Players sorted in no particular order Image © Mordor Intelligence. Reuse requires attribution under CC BY 4.0. | |
Retro-Reflective Materials Market Analysis by Mordor Intelligence
The Retro-Reflective Materials Market size is estimated at USD 5.28 billion in 2026, and is expected to reach USD 6.67 billion by 2031, at a CAGR of 4.78% during the forecast period (2026-2031). Expansion reflects an industry pivot from passive visibility compliance to machine-readable road networks that autonomous vehicles and advanced driver-assistance systems consistently interpret. Growing specification of micro-prismatic optics, integration of high-visibility apparel across logistics hubs, and performance-based procurement in infrastructure projects are reinforcing demand momentum. Asia-Pacific mega-projects, North American safety mandates, and European carbon-intensity ceilings combine to widen application breadth while nudging suppliers toward sustainability research and development. Competitive intensity remains moderate: patent expirations and regional price competition are increasing options for municipal buyers, yet vertically integrated incumbents still command the most profitable niches.
Key Report Takeaways
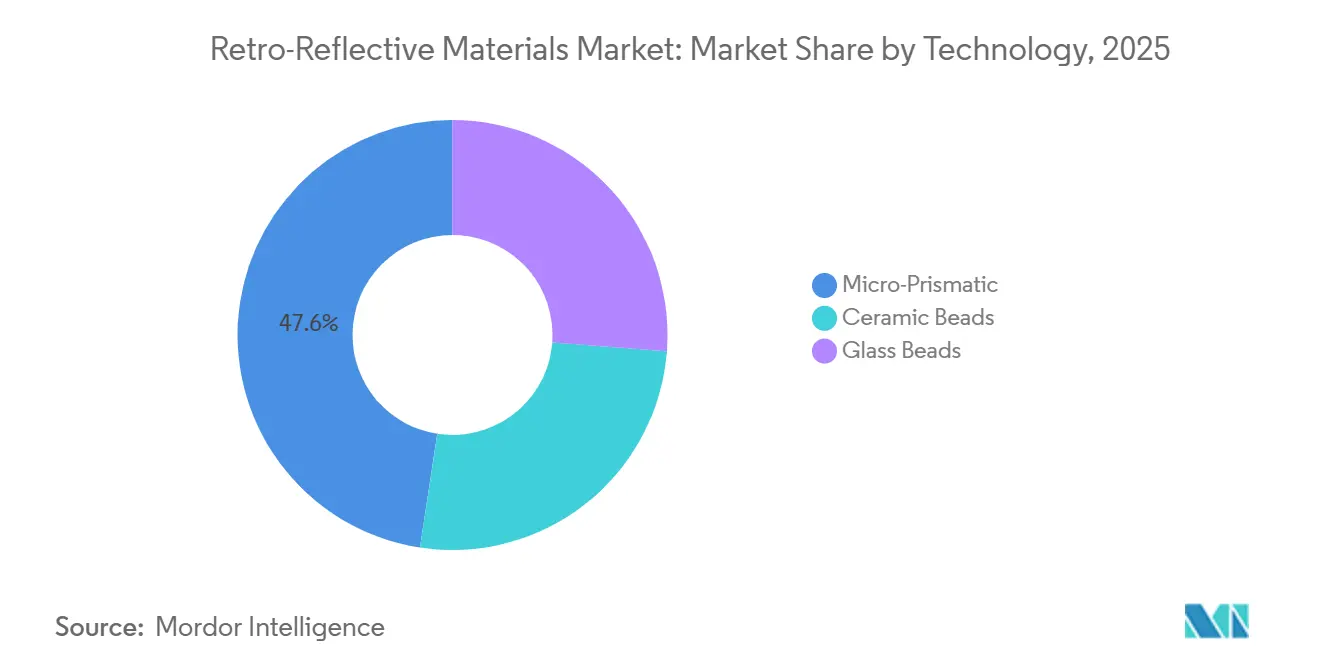
- By technology, micro-prismatic films captured 47.58% revenue share in 2025 and are advancing at a 5.09% CAGR to 2031, outperforming bead-based alternatives.
- By product form, films, sheets, and tapes led with 59.19% share in 2025, while paints, coatings, and inks are forecast to post the fastest 4.88% CAGR through 2031.
- By end-user industry, construction and infrastructure held 40.67% of the retro-reflective materials market share in 2025 and are projected to record a 4.97% CAGR up to 2031.
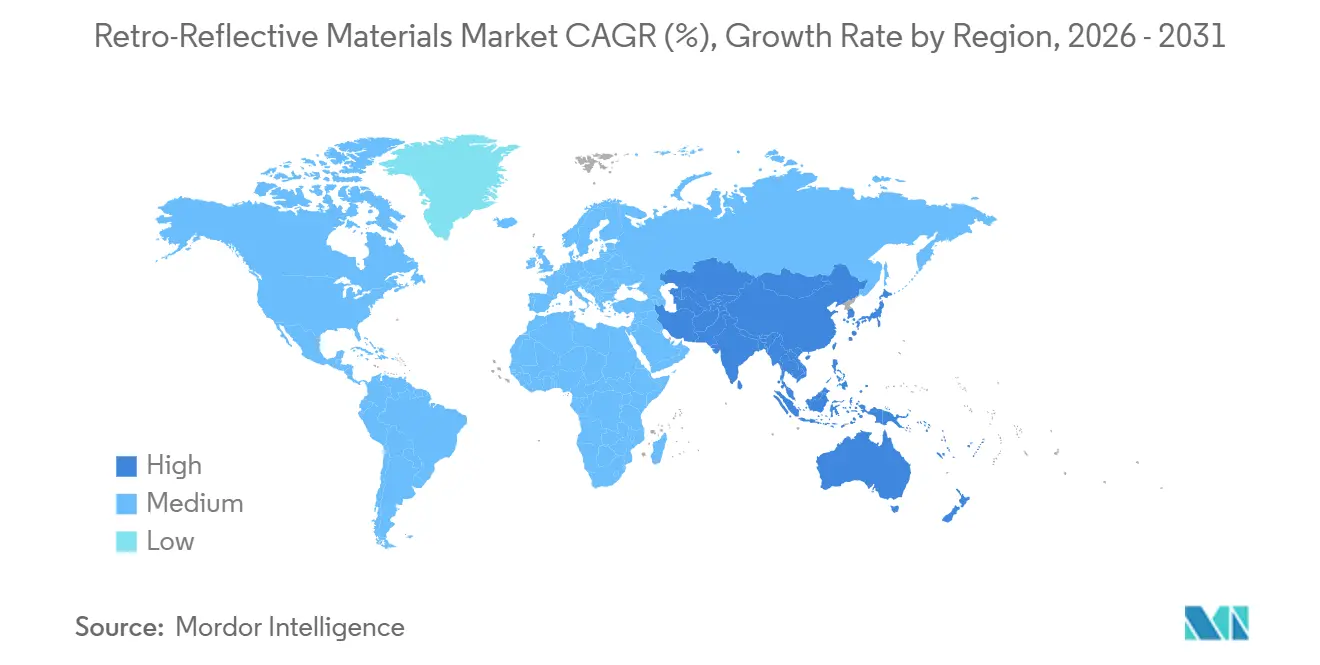
- By geography, Asia-Pacific commanded 44.34% revenue in 2025 and is set to expand at a 5.07% CAGR to 2031, the highest regional growth rate.
Note: Market size and forecast figures in this report are generated using Mordor Intelligence’s proprietary estimation framework, updated with the latest available data and insights as of January 2026.
Global Retro-Reflective Materials Market Trends and Insights
Drivers Impact Analysis*
| Drivers | (~) % Impact on CAGR Forecast | Geographic Relevance | Impact Timeline |
|---|---|---|---|
| Stricter global visibility regulations | +0.9% | Global, with early adoption in EU, North America, and APAC urban corridors | Medium term (2-4 years) |
| Rapid infrastructure expansion in Asia-Pacific | +1.1% | APAC core (China, India, ASEAN), spill-over to Middle East | Long term (≥ 4 years) |
| Rising adoption of high-visibility safety apparel | +0.7% | Global, concentrated in North America, EU, and industrial hubs in APAC | Short term (≤ 2 years) |
| Machine-readable infrastructure for autonomous vehicles | +0.6% | North America, EU, Japan, South Korea, with pilot corridors in China | Medium term (2-4 years) |
| LiDAR calibration targets integration | +0.5% | North America, EU, Japan, emerging in APAC test zones | Long term (≥ 4 years) |
| Source: Mordor Intelligence | |||
Stricter Global Visibility Regulations
Amended standards are raising the minimum retroreflectance thresholds for garments, signage, and pavement markings, pushing buyers towards premium micro-prismatic optics. ISO 20471-2024 has increased requirements for Class 3 garments, steering textile mills towards prismatic appliqués that can endure industrial washes[1]International Organization for Standardization, “ISO 20471:2024 – High-Visibility Clothing,” iso.org. The 2025 U.S. MUTCD update set a wet-retroreflectance benchmark for new interstate markings, a standard that level bead paints find challenging to achieve without costly polymer additives. India's IS 16321:2024 has officially endorsed prismatic sheeting on national highways, driving demand for film[2]Bureau of Indian Standards, “IS 16321:2024 – Retro-Reflective Sheeting,” bis.gov.in. In unison, regulators acknowledge that enhanced visibility infrastructure can potentially reduce nighttime fatalities.
Rapid Infrastructure Expansion in Asia-Pacific
Under its 14th Five-Year Plan, China allocated significant funding to expressways, emphasizing a focus on rural areas. This rural emphasis is driving heightened demand for lane delineation, especially in areas with poor ambient lighting. Meanwhile, India's Bharatmala Phase II is set to revamp corridors, utilizing thermoplastic markings. Furthermore, countries like Indonesia, the Philippines, and Vietnam are adopting similar strategies, leading to converter backlogs in Taiwan and South Korea that now surpass 12 weeks.
Rising Adoption of High-Visibility Safety Apparel
Corporate safety programs are outpacing statutory regulations. Amazon outfitted associates with ISO-compliant vests, leading to a reported drop in forklift incidents. OSHA expanded its high-visibility mandate, now applying to any worker within 15 feet of mobile equipment. This change is projected to boost annual demand for garment units. In Europe, builders have ramped up Class 3 vest usage, spurred by insurance discounts for improved visibility.
Machine-Readable Infrastructure for Autonomous Vehicles
Level 4 autonomy specifications now demand retro-reflective coefficients and entrance angles that surpass the capabilities of traditional glass beads. SAE J3016-2025 sets new requirements, steering road authorities to adopt prismatic thermoplastic stripes. In a move towards validation, Arizona is testing 120 miles of these markings with Waymo. By 2028, the EU ITS Directive mandates all new highways to incorporate machine-readable elements, thereby hastening procurement cycles.
Restraints Impact Analysis*
| Restraints | (~) % Impact on CAGR Forecast | Geographic Relevance | Impact Timeline |
|---|---|---|---|
| Raw-material price volatility | -0.4% | Global, acute in EU and North America due to energy-intensive glass production | Short term (≤ 2 years) |
| Substitute marking technologies (LED, thermoplastic) | -0.5% | EU, North America, Japan, emerging in Middle East | Medium term (2-4 years) |
| Waste-management compliance costs | -0.4% | EU, North America, with spillover to APAC export-oriented manufacturers | Long term (≥ 4 years) |
| Source: Mordor Intelligence | |||
Raw-Material Price Volatility
Between mid-2024 and early 2025, European glass-microsphere prices increased, driven by spikes in natural gas prices. This led bead makers to implement quarterly surcharge clauses. In early 2026, titanium dioxide prices rose significantly, following supply disruptions in China's Sichuan province. In 2025, costs for acrylic polymers increased, largely due to shortages of propylene in the U.S. Meanwhile, mid-tier converters, without hedging tools, conceded some margin to retain their municipal contracts.
Substitute Marking Technologies
In snowy corridors, where passive reflectors often fall short, solar LED studs have emerged as a favored solution. Norway rolled out these studs across its road network, leading to enhanced visibility during the polar night. Meanwhile, the Netherlands reported a significant reduction in accidents on fog-prone sections of the A2, thanks to the implementation of LED markers. Japan's expressway network is gradually transitioning from solvent paints to thermoplastic systems, which, despite being bead-based, offer a reduced lifecycle cost.
*Our forecasts treat driver/restraint impacts as directional, not additive. The impact forecasts reflect baseline growth, mix effects, and variable interactions.
Segment Analysis
By Technology: Micro-Prismatic Optics Sustain Growth Edge
Micro-prismatic optics represents 47.58% of global revenue and a robust 5.09% CAGR outlook to 2031. Demand strength arises from coefficients surpassing 1,000 candelas per lux per square meter at narrow observation angles. This is crucial for expressway signage, which needs to be visible from long distances at highway speeds. While glass-bead systems are more affordable, they quickly lose performance over distance. These systems are expected to decline in market share as performance-based tenders take precedence. On the other hand, while ceramic-bead technology is vital for high-temperature areas like runways, it holds a smaller share of the market volume.
Hybrid architectures are on the rise. For instance, 3M’s 2025 patent integrates glass microspheres beneath a prismatic top layer. This innovation combines wide-angle brightness with the durability of beads and is currently being tested on rural highways in Texas. Meanwhile, ORAFOL’s acquisition of Czech tooling has reduced die-manufacturing costs. This advancement accelerates custom-profile development and positions the company for swift bids on smart-infrastructure projects. Additionally, deliveries of reflective films from Avery Dennison to electric-vehicle OEMs have increased as designers opt for lighter conspicuity solutions that maintain aerodynamic integrity.



By Product Form: Films Lead, Coatings Gain Speed
In 2025, films, sheets, and tapes dominated the market with 59.19% of global value. This surge is largely attributed to their swift adoption in applications like curved body panels and roadside assets. While paints, coatings, and inks represent a smaller segment, they are set to experience the fastest, 4.88% CAGR growth. This uptick is driven by the adoption of water-based chemistries, which significantly reduce lane-closure times during resurfacing activities. In North America and Europe, regulatory caps on VOCs set below 250 g/L are steering municipalities towards compliant acrylic emulsions. This shift benefits suppliers capable of offering high solids without compromising on brightness. Films continue to lead in ensuring vehicle visibility. This is largely due to the ECE R104 regulation, which limits strip width to 50 mm – a specification that only prismatic tapes can meet while maintaining the required brightness.
Innovation is fueling this momentum: In 2025, Asian Paints PPG introduced a groundbreaking thermochromic coating that changes to yellow at temperatures exceeding 35 °C. This innovation serves as a warning for heat-stressed asphalt, alerting maintenance crews. The coating has swiftly captured a significant share of India's road-marking market. Meanwhile, Coats Group rolled out a reflective thread made from recycled content. This advancement allows garment manufacturers to achieve a higher post-consumer composition, all while adhering to the ISO 20471 reflectance standards. In a competitive move, Zhejiang Crystal-Optech unveiled a 120 m/minute embossing line, reducing costs per square meter. This strategic pricing undercuts European suppliers, positioning them favorably for bids on Middle Eastern infrastructure projects.
By End-User Industry: Infrastructure Remains Volume Anchor
Holding a dominant 40.67% share of the retro-reflective materials market, the construction and infrastructure sector is projected to grow at a CAGR of 4.97% through 2031. In India, highway agencies are increasingly embedding performance clauses, with the country now offering bonuses for markings that maintain high visibility during defect-liability periods. This shift is steering investments towards durable prismatic thermoplastics. Meanwhile, automotive OEMs are integrating tapes on production lines to streamline compliance with ECE R104. Notably, factory-fit rates in the EU are expected to rise significantly by 2025. Industrial users, spurred by data indicating a reduction in struck-by incidents with mandatory reflective vests, have rapidly adopted Class 3 apparel.
Textile innovations are broadening the market's horizons. In a landmark move, Nike incorporated prismatic trim into its 2025 running-shoe line, marking the first large-scale entry of reflective materials into performance footwear. This innovation comes courtesy of supplier Paiho Group. China's expressway zone-safety regulations, mandating reflective cones at regular intervals, have spurred significant annual demand. Reflecting this growing trend, REFLOMAX has seen its industrial-safety channel revenue increase, underscoring a shift in corporate procurement strategies.

Geography Analysis
Asia-Pacific anchored 44.34% of global revenue in 2025 and will maintain the fastest 5.07% CAGR through 2031. This growth is largely driven by China's expressway initiative and India's Bharatmala upgrades. By 2026, Japan plans to retrofit most of its tight-radius curves with prismatic delineators. Meanwhile, South Korea's Smart Highway project is integrating RFID tags and reflective stripes to enhance vehicle-to-infrastructure data communication. Additionally, ASEAN's standard harmonization is streamlining cross-border material movements, reducing bid cycles, and cutting compliance costs.
North America accounted for a substantial portion of the 2025 revenue. A significant update to the 2025 MUTCD led to a major transition from bead paints to prismatic thermoplastics. This shift is projected to generate additional demand in the U.S. market. Under the Vision Zero initiative, Canadian municipalities are incorporating retro-reflective crosswalks. Concurrently, Mexico has allocated significant funding for rural road signage, ensuring compliance with ASTM D4956 Type IX specifications.
Europe secured a notable share in 2025, though stringent environmental regulations moderated growth. In Germany, all new autobahn signs are now mandated to use micro-prismatic sheeting with a decade-long lifespan, benefiting premium suppliers. The U.K. has made it mandatory for smart-motorway gantries to have reflective back-plates, ensuring visibility even during electronic failures. France has set a limit on road-marking materials, giving an edge to water-based systems. Following a drop in accidents in 2024, Italy has broadened its mountain-pass delineator initiatives.
South America and the Middle East-Africa regions together represented a smaller portion of the 2025 revenue, but are poised to surpass the global growth average. Upgrading Brazil's BR-163, the project mandates Type IX sheeting, with significant consumption anticipated through 2028. Saudi Arabia has set an ambitious goal to retrofit bright pavement markings on most of its expansive network by 2029. This initiative comes with stringent performance-based penalties for contractors, ensuring they uphold a required brightness level for three years. In South Africa, a new mandate for high-visibility vests for roadside teams has spurred additional demand in 2025.

Regulatory Landscape
Retro-reflective materials demand is anchored to mandatory visibility frameworks across road assets, vehicles, and worker safety. In the United States, FHWA requirements on maintaining minimum sign retroreflectivity under the MUTCD drive replacement cycles for traffic control devices, while NHTSA safety rules under FMVSS No. 108 specify conspicuity marking performance and labeling for heavy trailers using DOT-C2, DOT-C3, and DOT-C4 identifiers, reinforcing qualification needs for sheeting and tape suppliers.
Internationally, UNECE Regulation No. 104 governs type approval for retro-reflective vehicle markings (E-mark approvals) across M, N, and O categories, shaping OEM and aftermarket specification of reflective tapes. For high-visibility safety apparel, ANSI/ISEA 107-2020 in the US and EN ISO 20471 (including the 2024 update referenced in the report context) set photometric and durability thresholds that cascade to textile mills, converters, and garment brands, with compliance documentation becoming a routine gate for public procurement and large corporate safety programs.
Value Chain Analysis
The value chain starts with upstream feedstocks and specialty inputs, including recycled or high-purity glass cullet for microspheres, metal oxides or carbonates and organosilanes for surface treatment, and petrochemical-derived resins, adhesives, and topcoats for films, tapes, and coatings. These inputs move into manufacturing, where glass beads are formed in high-temperature furnaces and then classified and coated, while micro-prismatic products rely on precision embossing or casting, metallization, and converting or lamination onto polymer substrates, followed by slitting and fabrication into sheets, tapes, or appliques.
Downstream, products flow through converters and channel partners to road-marking contractors, traffic sign fabricators, fleet marking and emergency-vehicle upfitters, apparel and PPE manufacturers, and automotive OEMs. Performance-based tenders and test requirements push suppliers to maintain consistent photometric performance and weathering durability, while the report context highlights cost pressure from resin and pigment volatility (including titanium dioxide disruptions) and operational bottlenecks such as extended lead times at Asia-based converters. In this setting, vertical integration, regional footprint balancing, and qualifying multiple input sources support continuity of supply.
Competitive Landscape
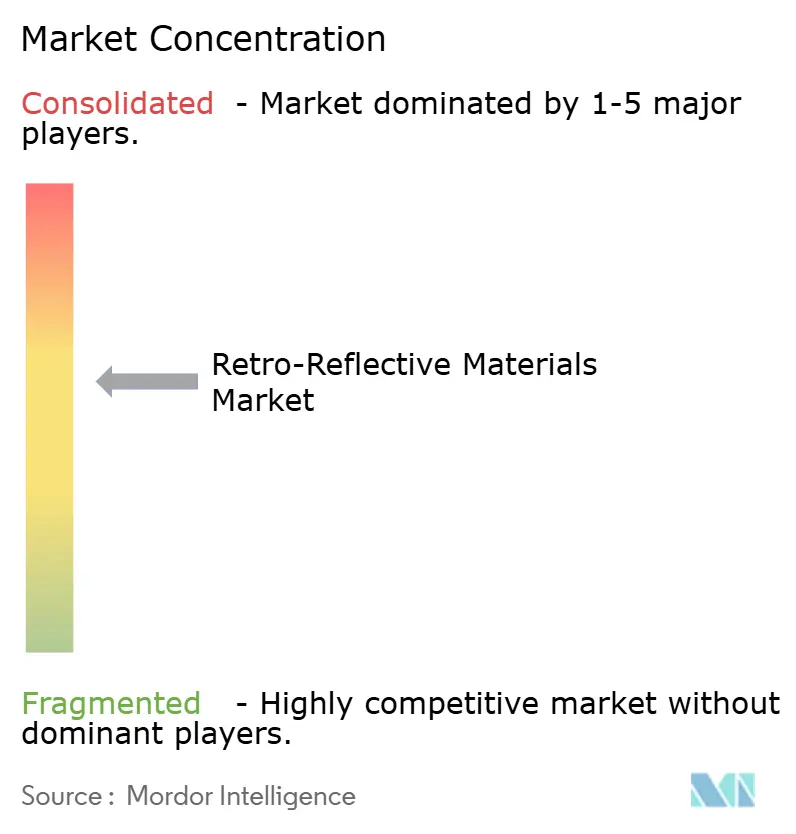
The retro-reflective materials market is moderately consolidated. Sustainability credentials differentiate challengers. A USDA-backed joint venture with Aura Optical is commercializing soy-based acrylic binders that reduce life-cycle emissions, positioning for early adoption in California’s carbon-capped procurement environment. Overall, competition is fiercest in Asia-Pacific municipal tenders.
Retro-Reflective Materials Industry Leaders
3M
Avery Dennison Corporation
ORAFOL Europe GmbH
Nippon Carbide Industries Co., Inc
Changzhou Hua R Sheng Reflective Material Co., Ltd
- *Disclaimer: Major Players sorted in no particular order

Market Opportunities and Future Outlook
A whitespace is opening around machine-readable infrastructure and higher-spec retroreflectance performance that conventional bead systems struggle to meet, which increases the value of micro-prismatic films and advanced thermoplastic marking systems. The report context also points to a tightening standards environment, including the 2025 US MUTCD wet-retroreflectance benchmark for interstate markings and EN ISO 20471:2024 garment requirements. That shift enlarges the premium segment for suppliers that can demonstrate durability and brightness under wet and wash-cycle conditions.
Sustainability-linked procurement and materials redesign create room for differentiation where buyers factor lifecycle and compliance costs alongside photometric performance. Evidence from the competitive landscape describes a USDA-backed joint venture with Aura Optical commercializing soy-based acrylic binders to reduce life-cycle emissions, which aligns with carbon-capped procurement environments such as California. On the supply side, capacity and specialization among regional producers and fabric-focused players support expansion into non-traditional uses (athleisure, footwear, and specialty fabrics) referenced in the report context, while large producers and niche fabric operations illustrate how suppliers tailor products by end-use, compliance regime, and conversion format.
Recent Industry Developments
- June 2026: Avery Dennison issued an updated product data bulletin for the VisiFlex V-8000 Series high-visibility reflective film used in emergency and utility fleet markings. The update reinforces product positioning around durability and application guidance, supporting converter and installer adoption for regulated vehicle conspicuity uses.
- September 2025: ORAFOL Europe GmbH acquired REFLOMAX Co., Ltd., expanding ORALITE technologies and strengthening production reach in Asia-Pacific. The deal broadened ORAFOLs manufacturing and customer access in a region that anchors a large share of global infrastructure demand.
- August 2024: ISO published EN ISO 20471:2024 for high-visibility clothing, raising performance and durability expectations for retroreflective components used in Class-rated garments. The revision increases compliance-driven demand for higher-performance trims and tapes among apparel manufacturers supplying logistics, construction, and industrial safety programs.


Research Methodology Framework and Report Scope
Market Definition and Coverage
This market counts revenues earned from retro-reflective materials that return light back toward its source and are sold into visibility and safety uses across industries and geographies.
Scope exclusions: We exclude ordinary reflective paints and decorative finishes that do not use retro-reflective optics, and we also exclude installation labor and unrelated road construction services.
Segmentation Overview
- By Technology
- Ceramic Beads
- Glass Beads
- Micro-Prismatic
- By Product Form
- Films, Sheets and Tapes
- Paints, Coatings and Inks
- By End-User Industry
- Automotive
- Industrial
- Construction and Infrastructure
- Textile
- Other End-user Industries
- By Geography
- Asia-Pacific
- China
- India
- Japan
- South Korea
- ASEAN Countries
- Rest of Asia-Pacific
- North America
- United States
- Canada
- Mexico
- Europe
- Germany
- United Kingdom
- France
- Italy
- Spain
- Rest of Europe
- South America
- Brazil
- Argentina
- Rest of South America
- Middle-East and Africa
- Saudi Arabia
- South Africa
- Rest of Middle-East and Africa
- Asia-Pacific
Data Sources, Market Sizing, and Validation
Desk Research
Desk research starts by mapping where retro-reflective demand shows up in real procurement and use, then linking that to supply and pricing signals. We refer to public road safety standards and guidance, such as U.S. DOT FHWA MUTCD documents, and related transportation agency publications that describe performance requirements and adoption patterns for signage and markings. We also use high-visibility apparel and PPE references such as OSHA resources, and we cross-check materials and optics fundamentals using peer-reviewed journals to keep the technology boundary consistent.
To avoid building the model only from narratives, trade and industry statistics are brought in where relevant, such as UN Comtrade for reflective material inputs and finished article trade flows, plus customs and tariff schedules that help validate product classification logic. Company annual reports, investor presentations, and credible press releases are used to understand revenue exposure, plant expansions, and pricing actions. Where needed, we reference paid subscriptions for company financials and intelligence, patent databases, and shipment-level import and export records to fill gaps that are not visible in public sources. The desk research sources listed are illustrative only, and many other public and paid sources were also used for data collection, validation, and clarification.
Primary Interviews and Surveys
Primary work is used to translate public signals into realistic assumptions on product mix, average selling prices, and demand timing before totals are finalized. We spoke with stakeholders across film and tape suppliers, bead and optics specialists, converters, distributors, and buyers from road infrastructure, industrial safety, automotive visibility, and textile and apparel channels. Inputs were checked across major regions so differences in regulation, infrastructure spending cycles, and procurement practices were captured in a consistent way.
Distribution of primary research fieldwork respondents
| Company type | Respondent position | Region |
|---|---|---|
| Top tier: 29% | CXOs: 12% | APAC: 42% |
| Mid tier: 55% | Functional/Unit leaders: 41% | EMEA: 33% |
| Smaller Players: 16% | Managers: 47% | Americas: 25% |
Market-Sizing & Forecasting
Sizing begins with a top-down build that reconstructs demand pools from road and workplace safety adoption, then allocates value across retro-reflective technologies and product forms using mix and pricing inputs. For road uses, the logic relies on installed base and replacement intensity for traffic control devices and markings, which is aligned to retro-reflective content per unit and typical procurement cycles. In parallel, a selective bottom-up approximation is run using supplier revenue exposure, channel checks, and sampled price per square meter or price per roll multiplied by estimated volumes, which helps adjust totals where publicly visible demand signals are uneven.
Key inputs include technology mix shifts between glass bead and micro-prismatic optics, average selling price movements by product form (films and sheets versus paints, coatings, and inks), infrastructure spend direction tied to roadway maintenance programs, penetration of high-visibility apparel usage in logistics and industrial settings, and regulatory performance thresholds that can change specification-led demand. When a data gap is found for a smaller country or a niche application, we use proxy indicators from similar markets and normalize them using interview feedback on pricing and distribution structure.
For forecasting, scenario analysis is applied so base, conservative, and aggressive paths can be tested against the same set of drivers, followed by a final track that matches expert consensus on likely adoption and replacement patterns. Variable trajectories are anchored to expected road safety spend, the pace of machine-readable road network upgrades, and realistic pricing progression rather than a fixed inflation uplift. The final forecast is then smoothed to avoid artificial spikes unless a policy shift or a large program is supported by multiple sources.
Data Validation & Update Cycle
Outputs are validated through several checks so totals remain traceable to real market signals. We compare modeled values against independent indicators such as trade movement, visible capacity additions, and reported demand strength from end-use channels, and then we review country and application variances to see whether they are explainable. If a number looks off, assumptions are revisited and, where needed, respondents are re-contacted to confirm whether the issue is mix, pricing, or a scope interpretation.
Before sign-off, the model and narrative go through multi-step analyst review, including consistency checks across technology shares, product form shares, and regional growth patterns. The report is refreshed annually, and interim updates are made when material events occur, such as regulation changes, major capacity moves, or sharp pricing swings. Right before delivery, a final pass is completed so clients receive the latest updated view.
Mordor Intelligence's Retro Reflective Materials Market Size Measured Against Other Published Estimates
Published market sizes for retro-reflective materials can look far apart because each publisher draws the product boundary differently and uses its own mix and pricing assumptions. The year used as the starting point can also vary, which changes the number even before any forecast logic is applied.
Key gaps usually come from whether paints, coatings, and inks are counted alongside films, sheets, and tapes, and whether adjacent reflective products that are not truly retro-reflective are mixed into the same bucket. By tracking mix by technology and product form and refreshing currency conversions and average selling price assumptions annually, Mordor Intelligence lands on a value that stays tied to repeatable demand signals like roadway replacement cycles and safety compliance purchases.
Benchmark comparison
| Source | Market Size | Gaps in Research Methodology |
|---|---|---|
| Mordor Intelligence | USD 5.28 B (2026) | |
| Trade Journal A | USD 3.60 B (2021) | Uses an earlier base year and a narrower demand view that is heavily weighted to road safety, which can undercount newer industrial and textile pull-through and newer micro-prismatic adoption. |
| Regional Consultancy B | USD 4.35 B (2022) | Appears to center the scope on films and sheets and may treat coatings and inks as a separate category, and it also applies a flatter pricing path that reduces value growth even when volumes rise. |
The spread across the three values is mostly explained by year alignment and how far the scope extends beyond core traffic and signage uses. When the market is kept consistent across technology types and product forms, and then checked against adoption and replacement behavior, the resulting number becomes easier to follow and to update when conditions change.


Key Questions Answered in the Report
How large is the retro-reflective materials market in 2026?
The retro-reflective materials market size is projected at USD 5.28 billion in 2026, continuing its 4.78% CAGR trajectory toward USD 6.67 billion by 2031.
Which technology leads current demand?
Micro-prismatic optics hold 47.58% of global revenue and remain the fastest-growing technology on the strength of superior brightness and machine-readable performance.
Why is Asia-Pacific the fastest-growing region?
Massive transport projects in China, India, and ASEAN nations, coupled with stricter visibility mandates, are driving a 5.07% CAGR in Asia-Pacific through 2031.
What factor most constrains supplier margins?
Volatile raw-material costs compress margins for converters lacking hedging strategies.
How will autonomous vehicles influence future demand?
Standards that specify machine-readable lane markings and LiDAR calibration targets are creating new premium niches that favor high-performance micro-prismatic materials.
Page last updated on:


 Your data is secure and never sold or shared.


