
Resistor Market Size and Share
Market Overview
| Study Period | 2020 - 2031 |
|---|---|
| Market Size (2026) | USD 11.10 Billion |
| Market Size (2031) | USD 14.19 Billion |
| Growth Rate (2026 - 2031) | 5.03 % |
| Fastest Growing Market | Asia Pacific |
| Largest Market | Asia Pacific |
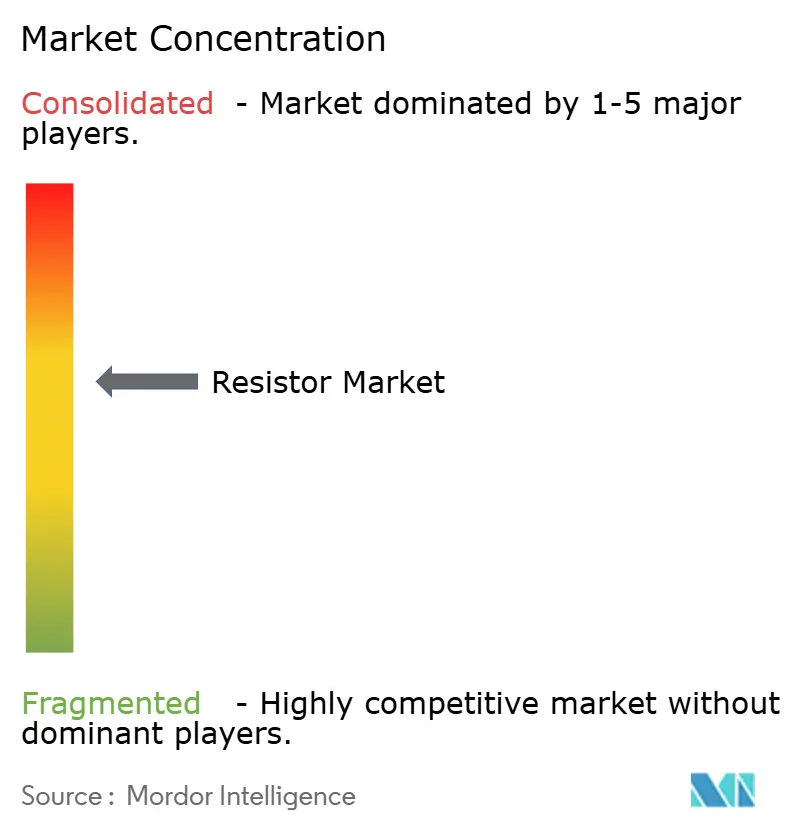
| Market Concentration | Medium |
Major Players
*Disclaimer: Major Players sorted in no particular order Image © Mordor Intelligence. Reuse requires attribution under CC BY 4.0. |
|
Resistor Market Analysis by Mordor Intelligence
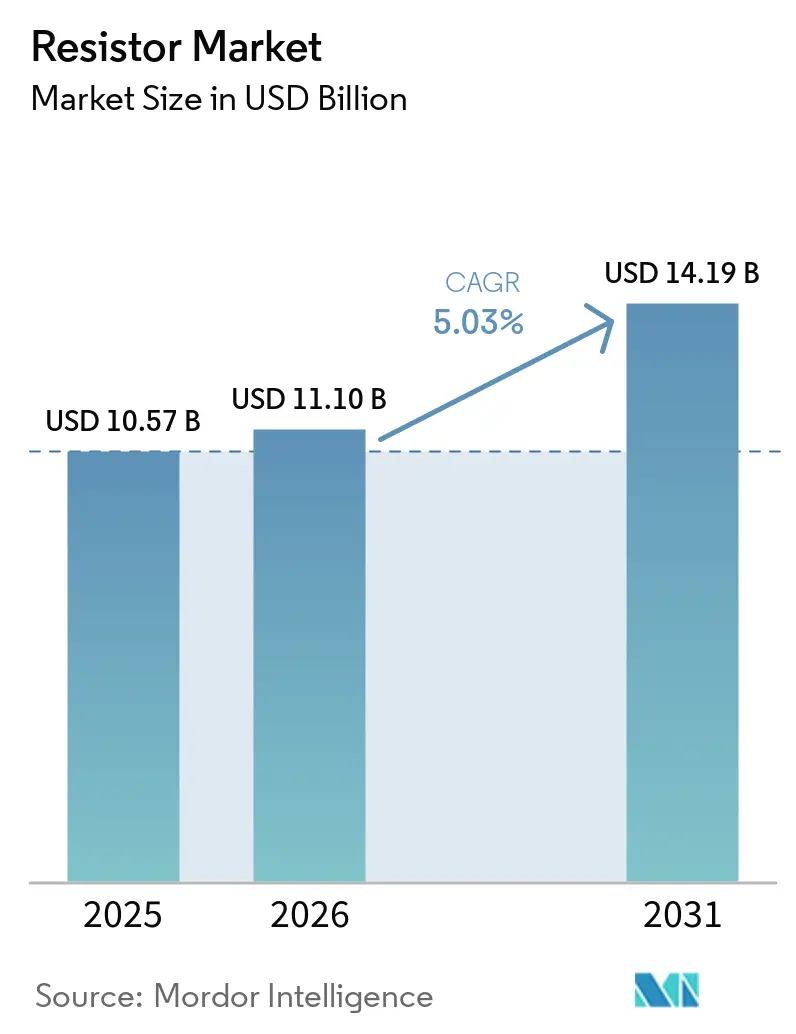
The global resistor market size in 2026 is estimated at USD 11.10 billion, growing from 2025 value of USD 10.57 billion with 2031 projections showing USD 14.19 billion, growing at 5.03% CAGR over 2026-2031. This steady expansion reflects growing electronic content across automobiles, next-generation consumer devices, and 5G infrastructure, all of which require higher volumes of precision passive components. Sub-CAGR tailwinds come from the rapid electrification of powertrains that depend on ultra-low-ohmic shunts for battery management, while miniaturization trends push demand for surface-mount chip formats able to fit ever-smaller printed-circuit footprints. The resistor market benefits from a widening array of high-frequency, high-reliability applications that command premium pricing and offset raw-material volatility. Meanwhile, aggressive capacity additions in East Asia underpin cost leadership yet intensify price competition, compelling incumbents to invest in thin-film processes and automotive-grade qualification. Overall, tight tolerance specifications, superior thermal management, and robust supply-chain resilience emerge as pivotal purchase criteria for buyers worldwide
Key Report Takeaways
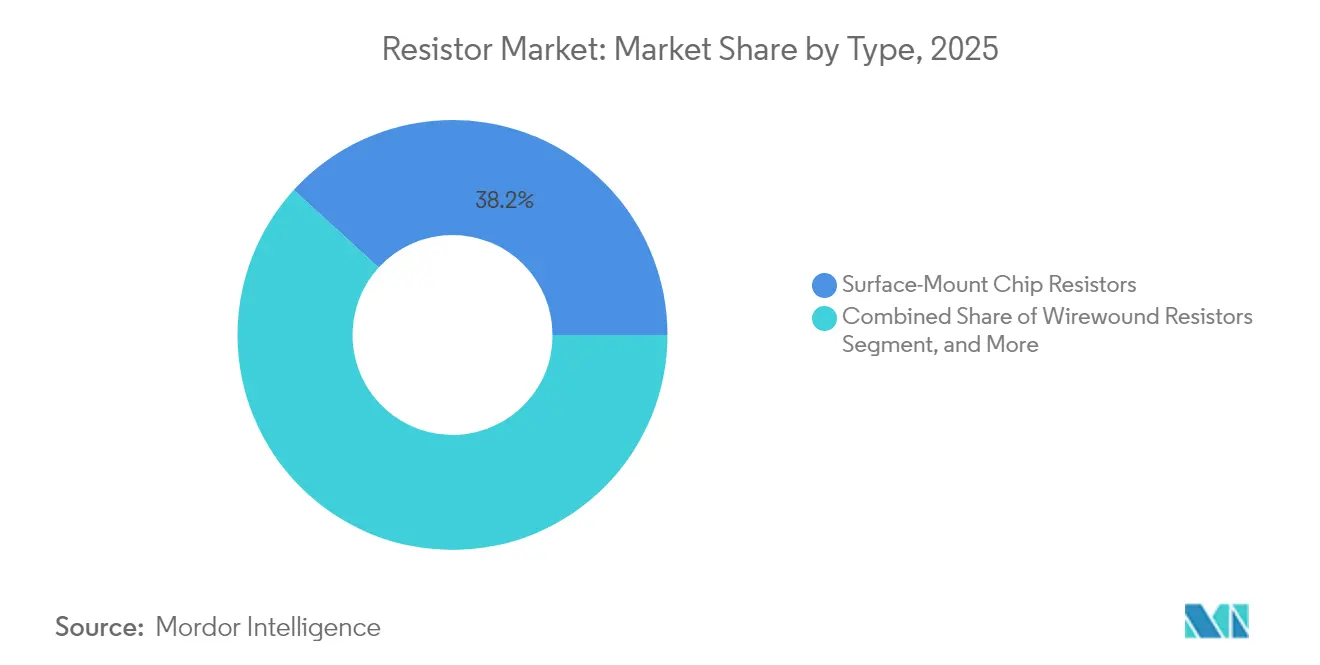
- By type, surface-mount chip resistors led with 38.22% of the resistor market share in 2025, and shunt and current-sense devices are forecast to grow at a 6.49% CAGR to 2031 within the resistor market.
- By power rating, resistors above 5 W are poised to expand at a 6.67% CAGR through 2031 in the resistor market.
- By end-user, automotive applications will post the fastest 6.74% CAGR, outpacing consumer electronics within the resistor market.
- By geography, Asia-Pacific captured 55.42% revenue share in 2025 and will progress at a 5.62% CAGR through 2031 in the resistor market.
Note: Market size and forecast figures in this report are generated using Mordor Intelligence’s proprietary estimation framework, updated with the latest available data and insights as of 2026.
Market Trends and Insights
Drivers Impact Analysis of Resistor Market*
| DRIVER | (~) % IMPACT ON CAGR FORECAST | GEOGRAPHIC RELEVANCE | IMPACT TIMELINE |
|---|---|---|---|
| Expanding automotive electronics content per vehicle | +1.2% | Global, led by Asia-Pacific and North America | Medium term (2-4 years) |
| Growth in consumer electronics and IoT device volumes | +0.9% | Global, Asia-Pacific manufacturing hubs | Short term (≤ 2 years) |
| Rising adoption of 5G infrastructure and high-frequency applications | +0.7% | North America, Europe, Asia-Pacific | Medium term (2-4 years) |
| Miniaturization trend driving demand for surface-mount chip resistors | +0.6% | Global, Asia-pacific manufacturing | Long term (≥ 4 years) |
| Integration of resistive sensing in EV fast-charging BMS | +0.4% | Global EV markets | Medium term (2-4 years) |
| Precision resistors for quantum-computing hardware | +0.1% | North America and Europe research hubs | Long term (≥ 4 years) |
| Source: Mordor Intelligence | |||
Expanding Automotive Electronics Content Per Vehicle
Electric and hybrid vehicles now embed hundreds of discrete shunt components that measure currents up to 2,500 A with micro-ohm precision, pushing demand for AEC-Q200 qualified metal-element devices able to operate up to 170 °C.[1]Source: Isabellenhütte, “EV Shunt Resistors Technical Article,” isabellenhuetteusa.com As OEMs migrate to 48-V architectures and software-defined control systems, the Resistor market gains volume upside from battery-management, ADAS, and traction-inverter boards. Precision drift specifications below ±15 ppm/°C ensure charge-state accuracy throughout the drivetrain’s lifetime, while rugged terminations mitigate vibration stress. Design wins in this space typically last a full model cycle, strengthening visibility for suppliers that meet stringent zero-defect targets. In parallel, charging-station manufacturers specify high-power thick-film units rated up to 150 W to throttle surge energy and prevent thermal runaway.[2]Source: Vishay Intertechnology, “CHA Series Thin-Film Chip Resistors,” vishay.com Collectively, the electrification wave adds resilient, multi-year revenue layers to the resistor market.
Growth in Consumer Electronics and IoT Device Volumes
Smartphones, wearables, and smart-home nodes continue to migrate from 0603 to 0402 and 0201 footprints, compressing real estate by up to 65% without sacrificing performance. Compact packaging raises placement accuracy demands, spurring capex for high-speed pick-and-place machines across contract manufacturers. The Resistor market thus pivots to ultra-miniature formats with ±0.1% tolerance and low TCR to satisfy high-resolution ADC front ends in edge devices. Volume scale for connected sensors drives long production runs, letting vendors amortize tooling and counterbalance wafer-thin margins. Design engineers also prize halogen-free, RoHS-compliant bill-of-materials to align with brand sustainability goals, indirectly boosting differentiated thin-film offerings. Together, these factors lift shipment tonnage even as ASPs fall, sustaining topline momentum for the resistor market.
Rising Adoption of 5G Infrastructure and High-frequency Applications
Millimeter-wave base-station radios require termination networks that maintain impedance stability up to 50 GHz; thin-film chip resistors address this need with alumina substrates and NiCr resistive elements. Chip resistors are used in high-frequency termination networks beyond this thin-film design. Migration from 4G to 5G triggers wholesale board redesigns, creating sizable replacement demand for certified passives. Small-cell deployments multiply node counts, expanding the dollar opportunity per square-kilometer served. Power-amplifier linearization further elevates resistor power-handling thresholds, driving innovation in heat-spreader geometries. Telco OEMs award supply contracts only to vendors maintaining multi-site redundancy and ISO/TS 16949 quality, a barrier that narrows field competition and supports price premiums. Consequently, high-frequency rollouts supply a dedicated growth pocket within the broader resistor market.
Miniaturization Trend Driving Demand for Surface-mount Chip Resistors
Next-generation PCB stack-ups adopt high-density interconnect traces below 75 µm, compelling the use of 0201 and emerging 01005 components to maintain signal fidelity. Chip formats reduce parasitic inductance, bolstering high-speed data paths inside smartphones and notebooks. Manufacturers exploit sputtered thin-film processes to secure ≤±0.05% tolerance, supporting precision voltage-divider networks in analog front ends. Shrinkage intensifies metrology challenges, as optical-inspection resolution must keep pace with part size. Consequently, capital expenditure in 2D/3D AOI and X-ray tomography scales in lockstep, embedding additional cost in the value chain. Even so, miniaturization remains an irreversible driver, ensuring long-run elasticity for the resistor market.
Restraints Impact Analysis of Resistor Market*
| RESTRAINTS | (~) % IMPACT ON CAGR FORECAST | GEOGRAPHIC RELEVANCE | IMPACT TIMELINE |
|---|---|---|---|
| Volatility in metal prices (Ni, Pd) is inflating production costs | -0.8% | Global, Asia-Pacific manufacturing | Short term (≤ 2 years) |
| Passive-component supply-chain disruptions | -0.6% | Global, Asia-Pacific hubs | Short term (≤ 2 years) |
| Stricter halogen-free material regulations are raising compliance costs | -0.3% | Europe and North America | Medium term (2-4 years) |
| Integrated passive devices reducing discrete-resistor content | -0.4% | Global, high-volume electronics | Long term (≥ 4 years) |
| Source: Mordor Intelligence | |||
Volatility in Metal Prices Inflating Production Costs
Nickel and palladium feedstock account for up to 25% of variable cost for thin-film chip resistors; spot-price swings exceeding 40% within a quarter compress gross margins for fabricators unless shielded by long-term contracts.[3]Source: Ram Alloys, “Nickel Surcharge Update,” ramalloys.com Hedging strategies partially offset the impact, yet tie up working capital, straining smaller vendors. Price passthrough to OEMs faces resistance amid competitive bidding, prompting substitution toward manganese-based alloys whenever tolerance windows permit. Such volatility weighs on near-term profitability across the resistor market.
Integrated Passive Devices Reducing Discrete-Resistor Content
High-density system-in-package modules now embed resistive, capacitive, and inductive elements on a single glass or silicon substrate, saving board space and simplifying assembly for flagship smartphones. Although discrete solutions remain cost-effective for lower-volume SKUs, IPD penetration in multibillion-unit programs lowers unit demand projections for commodity thick-film resistors. Suppliers therefore pivot toward high-mix, high-margin sectors such as automotive, industrial, and medical where customization needs shield the Resistor market from full displacement.
*Our forecasts treat driver/restraint impacts as directional, not additive. The impact forecasts reflect baseline growth, mix effects, and variable interactions.
Resistor Market Segment Analysis
By Type:
Surface-Mount Dominance Drives MiniaturizationSurface-mount chip formats generated the largest slice of the resistor market at 38.22% revenue share in 2025, underpinned by automated placement rates surpassing 110,000 components per hour. The segment’s scale economies enable price points below USD 0.0002 per 0603 part, widening use across mass-market devices. At the same time, shunt and current-sense families expand quickest at a 6.49% CAGR, leveraging rising electric-vehicle penetration.
Heightened functional density encourages migration toward 0201 and 01005 footprints, with leading subcontractors upgrading feeders and vision systems to achieve ±15 µm placement accuracy. Yet demand for wirewound and foil technologies persists where power dissipation and ultra-low inductance trump size, notably in industrial inverters and radar systems. Thick-film network arrays secure sockets in routers and base stations, thanks to matched resistor ratios up to 0.05%. Diversified use-cases maintain a balanced growth profile, allowing the Resistor market to hedge against over-reliance on any single form factor.



By Power Rating:
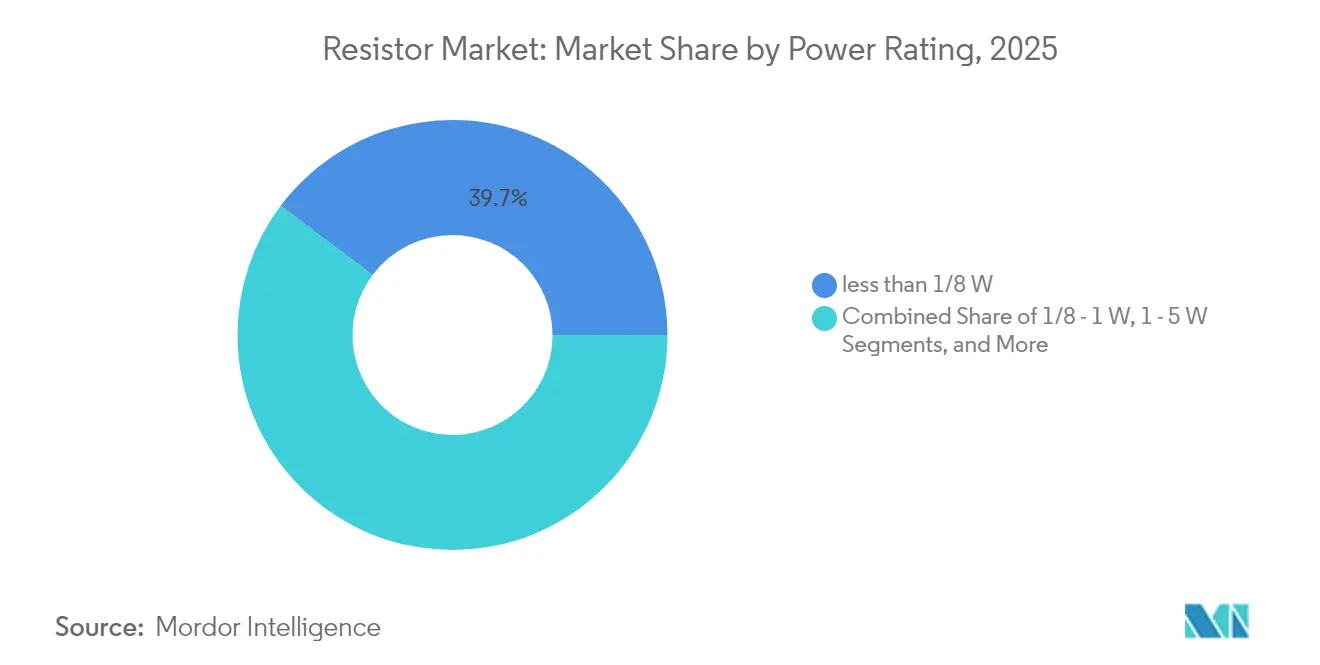
High-Power Applications Accelerate GrowthResistors exceeding 5 W constitute the fastest-rising slice of the Resistor market, slated for a 6.67% CAGR through 2031 as grid-scale storage, fast-charging piles, and renewable-energy converters proliferate. Bulk-metal and thick-film solutions dissipating up to 150 W manage transients during load-dump events, reducing module failure rates. Conversely, sub-1/8-W chips still dominate shipment volume, reflecting continued smartphone and wearable demand; within the resistor market share hierarchy, this low-power bracket held 39.74% in 2025.
Thermal-interface improvements such as direct-bonded-copper substrates and molded epoxy housings enhance derating curves, enabling OEMs to shrink system footprints while elevating performance. Mid-range 1-5 W resistors cater to industrial drives and telecom rectifiers that need moderate power with tight tolerance.
By End-User Industry:
Automotive Transformation Drives GrowthAutomotive use cases are expected to post the highest 6.74% CAGR, lifting their contribution within the resistor market. High-voltage battery modules require Kelvin-sensed shunts capable of 0.2% tolerance across temperature swings, while zonal E/E architectures introduce numerous sense-line resistors to monitor subsystem loads. Consumer electronics remains the largest volume consumer, representing a 36.80% share, buoyed by sustained smartphone replacement cycles and emerging XR headsets.
Industrial automation and instrumentation demand high-stability foil resistors with ±2 ppm/°C TCR for precision process control. Thin-film devices held 33.45% of the precision resistor market share in 2024 thanks to ±10 ppm/°C stability and small-geometry scalability, translating into USD 1.87 billion of the precision resistor market size that year. Aerospace and defense segments rely on hermetically sealed wirewounds that comply with MIL-PRF-55342, although order flow depends on program funding cycles. Medical-device OEMs increasingly specify biocompatible, moisture-resistant thin-films for implantable telemetry modules, a specialized niche supporting healthy margins. Together, this diversified user base underpins resilience across the broader resistor market.
Geography Analysis
APAC Resistor Market
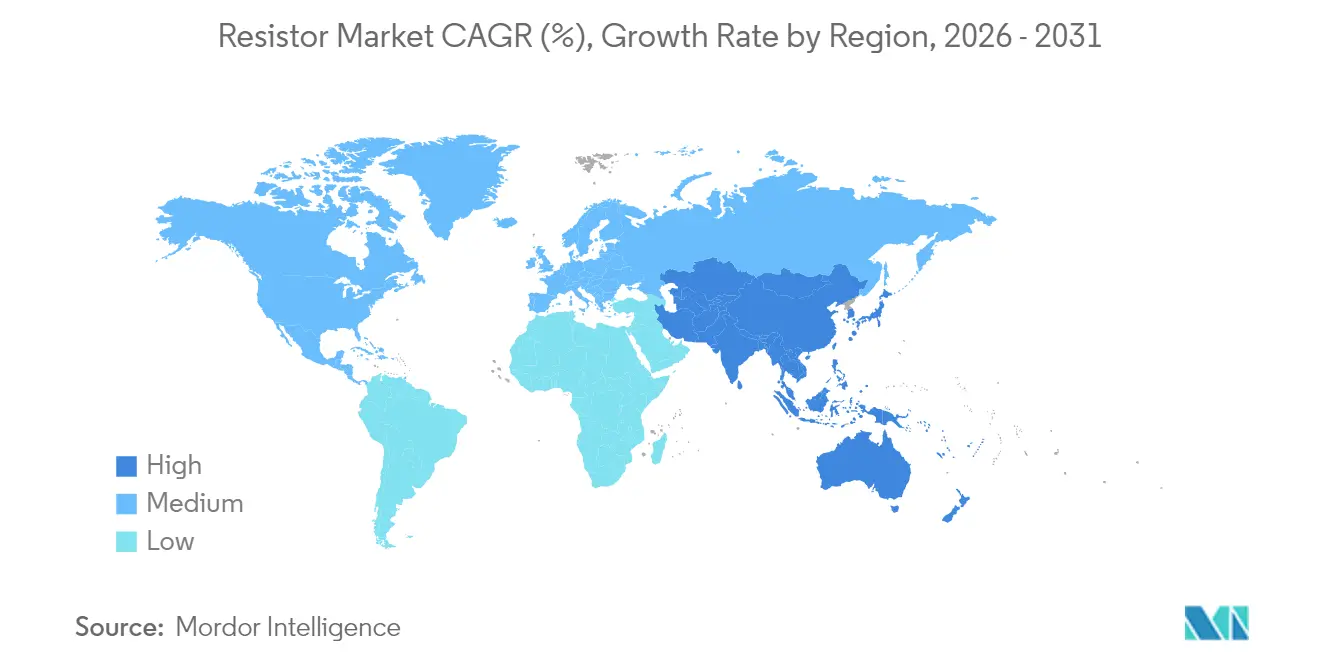
Asia-Pacific dominates the resistor market, commanding 55.42% revenue in 2025 thanks to vertically integrated electronics manufacturing clusters spanning Shenzhen, Hsinchu, and Kansai. Regional leaders Yageo, Walsin, and TA-I continue to add capacity, leveraging preferential utility rates and mature subcontracting ecosystems. As production scales, local foundries supply sputtered NiCr films and alumina substrates, closing material loopbacks and lowering cycle times. Simultaneously, governments in Japan and South Korea channel research and development grants toward automotive-grade passives to bolster export competitiveness.
North America and Europe Resistor Market
North America captured 17.45% of the resistor market size in 2025, anchored by aerospace, defense, and medical device contracts that favor high-reliability foil and wirewound types. The CHIPS and Science Act’s incentives stimulate domestic substrate and thick-film ink production, gradually shortening supply lines. Europe is progressing toward halogen-free mandates; resistor vendors respond with green-polymer encapsulation and lead-free solderable endcaps. Germany and France spearhead investment in EV charging infrastructure, giving a lift to high-power resistor demand.
LATAM and MEA Resistor Market
Emerging economies in Latin America and Africa jointly account for less than 5% of global revenue yet post above-average growth as telecom operators extend 5G footprints and industrial automation gains traction. Middle East participation centers on smart grid rollouts and petrochemical instrumentation, where harsh-environment resistors fetch premium ASPs. These developments illustrate the geographic breadth sustaining long-run expansion of the resistor market.

Regulatory Landscape
The resistor market sits at the intersection of product-performance qualification and materials-compliance requirements. Automotive and high-reliability end markets anchor many specification pathways through schemes such as AEC-Q200 and legacy defense standards, including MIL-PRF-55342 for select high-reliability resistor classes. In Europe, updated harmonized resistor test and quality-assessment frameworks were published in April 2026, including EN IEC 60115-4:2026 and EN IEC 60115-8:2026, which tighten alignment between international and European procedures for fixed and surface-mount resistors and shape how suppliers document conformity during customer qualification.
Sustainability and supply-chain due diligence requirements increasingly affect resistor procurement and supplier audits. For example, Vishay Intertechnology, with European operations, has highlighted readiness efforts for EU Corporate Sustainability Reporting Directive (CSRD) and European Sustainability Reporting Standards (ESRS) reporting timelines in 2026, which in turn drive customer data requests on emissions, materials, and traceability. In parallel, conflict-minerals compliance expectations continue to be embedded in OEM sourcing, with industry practices referencing OECD guidance and validation mechanisms such as the Responsible Minerals Initiative (RMI) for 3TG reporting across multi-tier supply chains.
Value Chain Analysis
The resistor value chain starts with raw materials and engineered inputs, including alumina substrates, NiCr and other resistive alloys or films, thick-film pastes, and termination metals. These are then processed through wafer or thin-film deposition, paste printing, trimming and testing, packaging (including surface-mount chip, MELF, wirewound, and power packages), and final electrical and reliability qualification. Qualification requirements, such as AEC-Q200 for automotive-grade resistors, raise the importance of upstream process control, materials traceability, and test capacity, since approved parts must show stable resistance, TCR performance, and endurance under thermal cycling and harsh-environment exposure.
Manufacturing and supply are shaped by vertical integration combined with selective outsourcing. Suppliers such as Vishay, Yageo, and Murata span multiple passive-component and adjacent technology nodes through internal capabilities and acquisitions, while relying on subcontractors for some commodity or volume-driven steps to flex capacity and keep in-house lines focused on higher-growth and higher-margin segments. Process-development and transfer models also influence outcomes, including Murata's reference to a "mother factory" approach (for example, Fukui-prefecture operations) to develop and standardize production processes before broader deployment, supporting yield learning and consistency as demand shifts toward automotive-grade, high-frequency, and high-power applications.
Competitive Landscape
Moderate concentration characterizes the resistor market, with significant players such as Vishay Intertechnology, Panasonic Industry, and Yageo. Yageo’s USD 740 million acquisition of Pulse Electronics widened its automotive sensor portfolio and shows a sustained appetite for inorganic growth. Vishay committed to multi-site redundancy by commissioning a Ciudad Juárez factory in 2025, boosting North American capacity and diversifying seismic risk. Panasonic continues to commercialize conductive-polymer thick-film pastes that promise 15% better pulse handling, targeting EV brake-chopper circuits.
Smaller Asian contenders such as ROYALOHM and Firstohm differentiate through turnkey ODM services, winning business from consumer-electronics ODMs seeking rapid spin cycles. Western niche specialists, including VPG Foil Resistors, dominate ultrahigh-precision foil segments at TCR values down to 0.05 ppm/°C, catering to metrology and quantum-computing researchers.[5]Source: ES Components, “VPG Foil Resistors,” escomponents.com Cost-centric buyers, however, continue to source commodity chips from large Taiwanese fabs able to deliver billion-unit lots with six-week lead times. Overall, rivalry revolves around technology, quality certification breadth, and continuity of supply, keeping the resistor market dynamic and innovation-oriented.
Resistor Industry Leaders
-
Vishay Intertechnology, Inc.
-
Yageo Corporation
-
Murata Manufacturing Co., Ltd.
-
Panasonic Holdings Corporation (Panasonic Industry)
-
KOA Corporation
- *Disclaimer: Major Players sorted in no particular order
Resistor Market Companies Covered in this Report
- Vishay Intertechnology, Inc.
- Panasonic Holdings Corporation (Panasonic Industry)
- Yageo Corporation
- Murata Manufacturing Co., Ltd.
- KOA Corporation (KOA Speer Electronics, Inc.)
- Bourns, Inc.
- TT Electronics plc
- TE Connectivity Ltd.
- Rohm Co., Ltd.
- Walsin Technology Corporation
- Viking Tech Corporation
- Susumu Co., Ltd. (Susumu International U.S.A.)
- Ohmite Manufacturing Company
- Riedon, Inc.
- Arcol UK Resistors Ltd.
- Stackpole Electronics, Inc.
- Caddock Electronics, Inc.
- Token Electronics Industry Co., Ltd.
- Isabellenhütte Heusler GmbH & Co. KG
- VPG Foil Resistors (Vishay Precision Group)
- Advanced Linear Devices, Inc.
- Cyntec Co., Ltd.
- Firstohm Electronic Co., Ltd.
- Ever Ohms Technology Co., Ltd.
- NIC Components Corp.
- Uniohm Resistor (Chaozhou Three-Circle Group)

Market Opportunities and Future Outlook
Near-term opportunities concentrate in resistor segments where qualification barriers, harsh-environment requirements, and higher power density increase value per component relative to commodity chip resistors. Automotive electrification and growth in 48-V and EV subsystems expand demand for AEC-Q200 qualified shunt or current-sense resistors and power resistors, while telecom and data infrastructure designs create pull for thin-film solutions that hold stable impedance at high frequencies. Supplier product activity points to where engineering attention is moving, such as sulfur-resistant, automotive-grade thick-film chip resistors (for example, Vishay’s RCA-SR e3 positioning for sulfur-containing environments) and high-power packages focused on pulse handling and thermal dissipation.
A second opportunity area is supply assurance, including localized or diversified capacity for critical passive components. This becomes more visible as buyers screen suppliers for multi-site redundancy and traceability. Investment signals from corporate actions also add specificity to capacity confidence: Vishay priced a USD 750 million public offering in late June 2026 to reduce borrowings and fund growth initiatives, supporting its ability to add or reconfigure manufacturing for targeted passive segments. At the standards level, the April 2026 publication of updated EN IEC 60115 series standards for power and surface-mount resistors reduces ambiguity in qualification pathways for both new entrants and existing suppliers expanding portfolios, which can support faster customer approvals for differentiated, compliance-ready resistor lines.
Recent Industry Developments in Resistor Market
- February 2026: Vishay Intertechnology launched RCA-SR e3 series, AEC-Q200 qualified thick film chip resistors for sulfur-containing environments. The launch expands the portfolio of sulfur-resistant resistors for automotive applications. It strengthens supply resilience by offering automotive-grade options that perform reliably in high-sulfur settings.
- January 2026: Yageo Corporation implemented price increase for specific chip resistor products (R-Chip) starting February 1, 2026. The pricing shift affects high-volume chip resistor segments. It could lift average selling prices and pressure margins for electronics manufacturers relying on commodity resistors.
- November 2025: Murata Manufacturing Co., Ltd. introduced NCU03WF104F6SRL and NCU03WF104F60RL NTC thermistors in 0603M size for automotive high-reliability applications. The expansion strengthens Murata's presence in high end passive components for thermal management in vehicles. It supports APAC supply chain resilience by broadening automotive grade thermistor options.


Resistor Market Report Scope and Research Methodology
Market Definition and Coverage
For this methodology, the resistor market covers revenue generated from fixed resistors sold into electronic and electrical equipment, across common form factors and performance grades, and counted at the component level in USD.
Scope exclusions: It does not include broader passive-component baskets, value added from PCB assembly or distribution services, or downstream device revenue.
Segments Covered in This Report
-
By Type
- Surface-Mount Chip Resistors
- Network / Array Resistors
- Wirewound Resistors
- Film / Foil / Oxide Resistors
- Carbon Composition / Thick-Film Resistors
- Variable Resistors (Potentiometers, Rheostats)
- Shunt and Current-Sense Resistors
-
By Power Rating
- < 1/8 W
- 1/8 – 1 W
- 1 – 5 W
- > 5 W (High-Power)
-
By End-User Industry
- Automotive
- Aerospace and Defense
- Telecommunications and Data Infrastructure
- Consumer Electronics and Computing
- Industrial Automation and Instrumentation
- Medical Devices
- Energy and Power
-
By Geography
-
North America
- United States
- Canada
- Mexico
-
South America
- Brazil
- Argentina
- Rest of South America
-
Europe
- Germany
- United Kingdom
- France
- Russia
- Rest of Europe
-
Asia-Pacific
- China
- Japan
- India
- South-East Asia
- Rest of Asia-Pacific
-
Middle East and Africa
-
Middle East
- Saudi Arabia
- United Arab Emirates
- Rest of Middle East
-
Africa
- South Africa
- Egypt
- Rest of Africa
-
Middle East
-
North America
Data Sources, Market Sizing, and Validation
Desk Research
Desk research was used to set the market perimeter and to build practical input ranges that can be checked against real-world electronics activity. Public sources such as UN Comtrade, the World Trade Organization, the International Energy Agency, and government manufacturing statistics (such as the US Census Bureau and Eurostat) helped anchor macro movement in electronics output and cross-border flows.
We also reviewed filings and investor materials from relevant component makers and distributors, plus electronics association publications and reputable press, to understand demand shifts by end-use and by region. To avoid overfitting, paid subscriptions were used only for structured company financials, patent lookups, and shipment-level import and export cuts where it helped confirm directionality. The desk sources listed are illustrative only, and many other public documents were also used for collection, cross-checks, and clarification.
Primary Interviews and Surveys
Primary work focused on validating the demand pool and pricing logic for resistors that get designed into high-volume electronics, before those assumptions were baked into the model. We spoke with a mix of manufacturers, channel participants, and engineering or sourcing stakeholders across key consuming regions. This clarified how real-world ASP ranges, mix shifts, and qualification cycles map to the demand pool implied by desk inputs.
Distribution of primary research fieldwork respondents
| Company type | Respondent position | Region |
|---|---|---|
| Top tier: 26% | CXOs: 13% | APAC: 47% |
| Mid tier: 59% | Functional/Unit leaders: 42% | EMEA: 31% |
| Smaller Players: 15% | Managers: 45% | Americas: 22% |
Market-Sizing & Forecasting
Sizing started with a top-down demand reconstruction, where electronics production signals and cross-border trade flows were translated into a resistor consumption pool by region, and then converted into value using representative ASP bands. To keep the totals grounded, selective bottom-up approximations were also used, such as sampled ASP times estimated unit volumes for key resistor families, followed by channel checks on mix and availability.
Inputs were chosen because they connect to how resistors are actually purchased and used. These include electronics manufacturing output trends, the share of surface-mount designs versus legacy formats, automotive and industrial electrification indicators that raise current-sense needs, typical tolerance and power-rating mix, and observed pricing movement when tight supply or raw-material pressure shows up. Where public series were missing or too broad, we filled gaps through interview-led ranges and then tested sensitivity so the model did not hinge on a single assumption.
For forecasting, we used scenario analysis supported by short-series smoothing to reflect demand cycles, and then adjusted the path based on expert views on end-market ramps and normalization. Assumptions were kept repeatable so a junior analyst can re-run the model when new trade, production, or pricing signals arrive.
Data Validation & Update Cycle
Outputs were validated through cross-checks against independent signals, such as region-level electronics output direction, trade movement consistency, and realistic pricing and mix ranges shared by interviewees. When a region or end-use showed an unexpected jump, the drivers were re-tested and the underlying inputs were revisited before the number was accepted.
A multi-step internal review is followed so calculation logic, units, and currency timing are consistent across the time series. Reports are refreshed annually, and interim updates are made when material events can shift demand, supply, or pricing assumptions. Before delivery, a final pass is completed so clients receive the most current view available at that time.
Mordor Intelligence's Resistor Market Size Measured Against Other Published Estimates
Published resistor market values often differ because the counted product set and pricing basis are not the same, even when the title looks similar. Variance also comes from how firms treat regional mix shifts, which end-markets are emphasized, and whether the base year is a true observed year or a forward-looking starting point.
Some external estimates bundle resistors into a wider electrical passive or interconnect basket, or they start from factory shipment revenue without separating distribution markups and mix. In Mordor Intelligence, the value is limited to resistor component revenue only, and the 2026 starting point is kept consistent with validated ASP bands and end-use consumption checks that were re-tested during the latest refresh.
Benchmark comparison
| Source | Market Size | Gaps in Research Methodology |
|---|---|---|
| Mordor Intelligence | USD 11.10 B (2026) | |
| Trade Journal A | USD 8.59 B (2023) | Uses an earlier base year and often reflects a broader electrical resistors framing with limited visibility into later mix shifts like higher-value current-sense designs, which can understate the more recent value run-rate. |
| Regional Consultancy B | USD 4.20 B (2025) | Appears to focus on a narrower subset closer to fixed linear or selected resistor categories, and it is not fully clear how it handles chip-format penetration and ASP normalization across regions, which can compress the total. |
The spread in the table is mainly explained by what gets counted and when the market is anchored, followed by how pricing and mix are carried forward. By keeping the resistor-only scope, using clear demand signals, and applying repeatable checks on ASP and mix, the final estimate stays traceable to inputs that can be revalidated on the next update cycle.


Key Questions Answered in the Report
What is the current value of the global resistor market?
The market is valued at USD 11.10 billion in 2026 and is projected to reach USD 14.19 billion by 2031.
Which geographic region leads resistor production?
Asia-Pacific holds 55.42% of global revenue thanks to its dense electronics manufacturing ecosystem.
Why are high-power resistors growing faster than low-power categories?
Electrification of vehicles and expansion of renewable-energy converters require devices above 5 W, driving a 6.67% CAGR for this segment.
How will integrated passive devices impact discrete resistor demand?
IPDs may reduce chip counts in flagship consumer devices, but automotive, industrial, and medical sectors still rely on discrete resistors for customization and cost efficiency.
Page last updated on:


 Your data is secure and never sold or shared.


