Renewable Energy Insurance Market Size and Share
Market Overview
| Study Period | 2020 - 2031 |
|---|---|
| Market Size (2026) | USD 20.11 Billion |
| Market Size (2031) | USD 28.35 Billion |
| Growth Rate (2026 - 2031) | 7.12% CAGR |
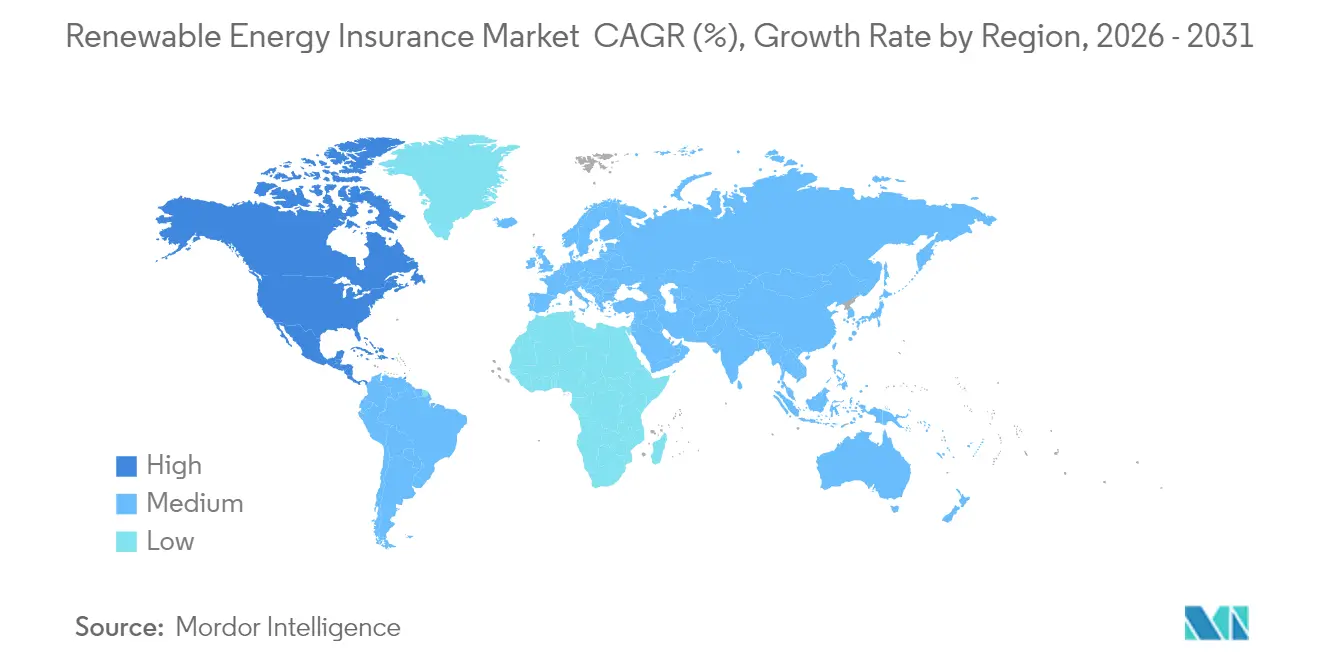
| Fastest Growing Market | North America |
| Largest Market | Europe |
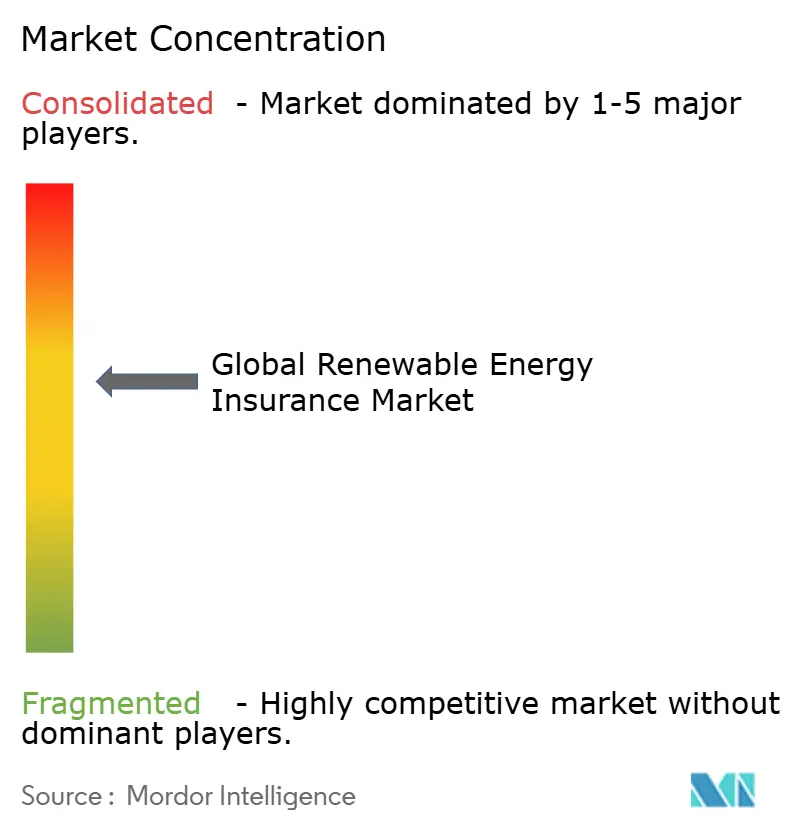
| Market Concentration | Medium |
Major Players *Disclaimer: Major Players sorted in no particular order Image © Mordor Intelligence. Reuse requires attribution under CC BY 4.0. | |
Renewable Energy Insurance Market Analysis by Mordor Intelligence
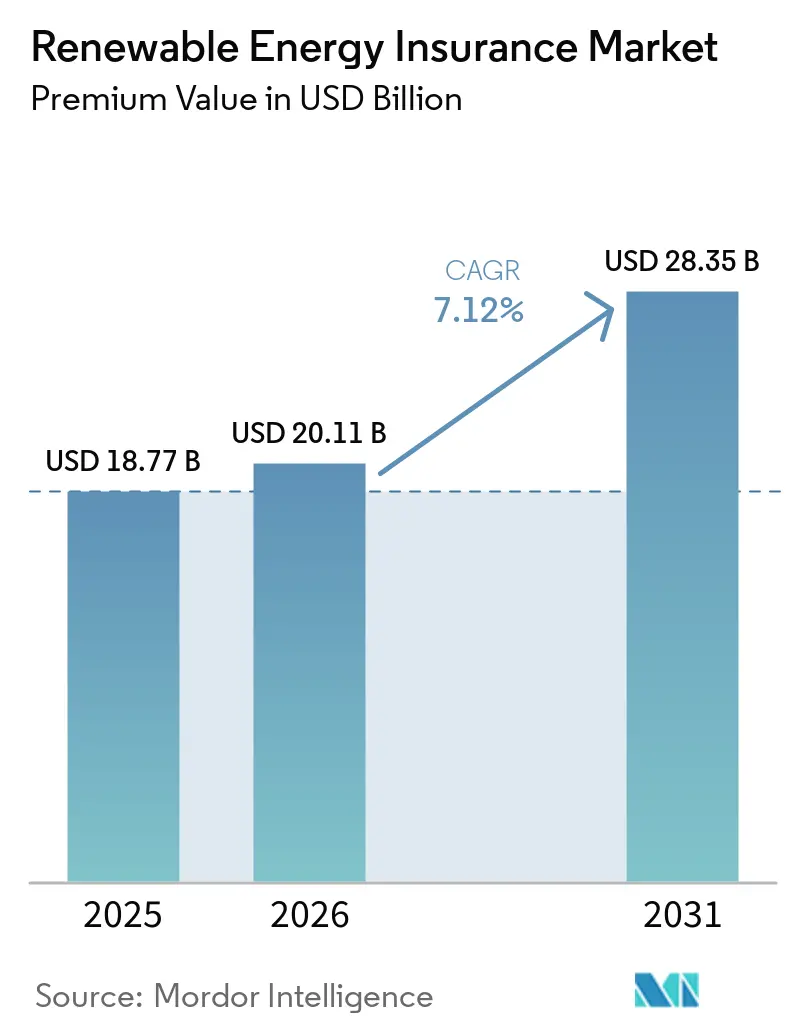
The Renewable Energy Insurance Market size in terms of premium value is projected to be USD 18.77 billion in 2025, USD 20.11 billion in 2026, and reach USD 28.35 billion by 2031, growing at a CAGR of 7.12% from 2026 to 2031.
Robust deployment of utility-scale clean-energy assets, growing weather-related loss experience, and regulatory mandates that require bankable coverage are accelerating the shift from niche specialty lines to mainstream risk-transfer solutions. Property damage & business interruption policies dominate premiums because owners, lenders, and tax-equity investors insist on asset protection throughout 20–25-year lifecycles. Europe commands the largest regional slice owing to harmonized climate rules and sophisticated risk-management standards, while North America is expanding fastest on the back of the Inflation Reduction Act incentives and innovative offerings such as tax-investment-default insurance. Technological change is also reshaping underwriting practices; parametric products tied to objective weather indices plug indemnity gaps, and satellite-enabled monitoring shortens claim settlement cycles. Competitive dynamics increasingly reward insurers and reinsurers that combine deep balance sheet capacity with advanced analytics, real-time data feeds, and cyber-risk mitigation tools.
Key Report Takeaways
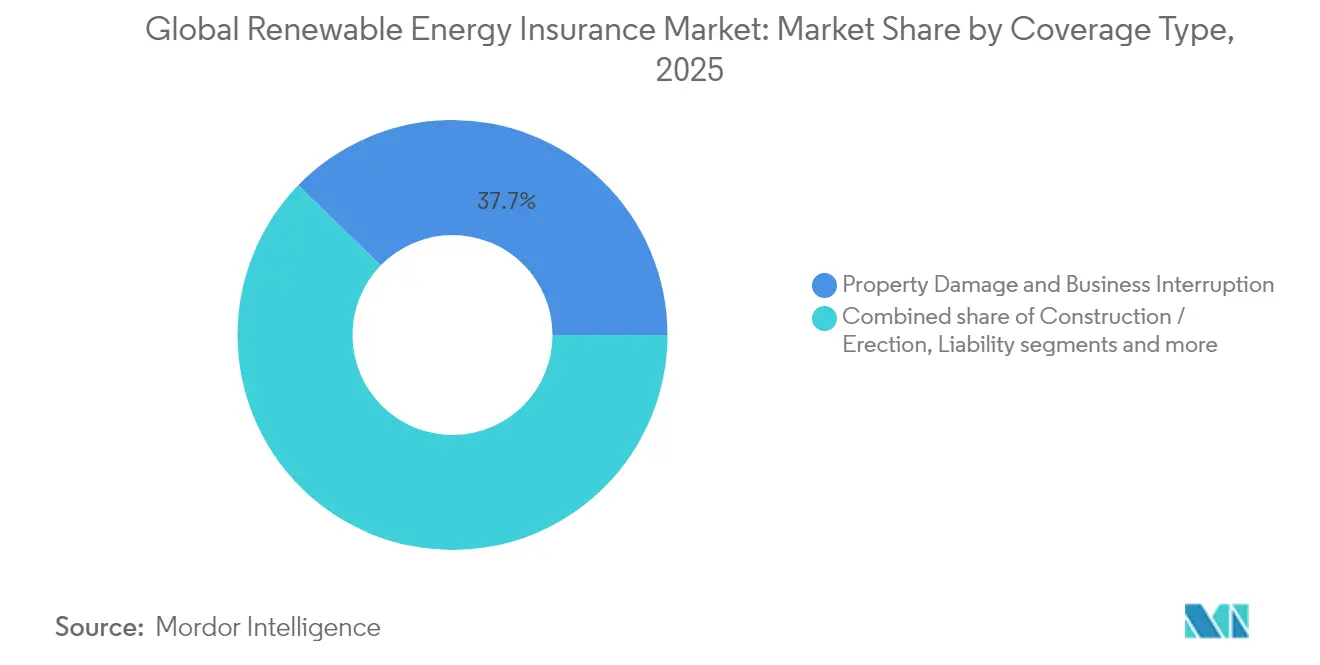
- By coverage type, property damage & business Interruption captured 37.74% of the renewable energy market size in 2025, while parametric solutions are projected to grow at a 9.92% CAGR by 2031.
- By technology, utility-scale solar PV held 31.55% of the renewable energy market share in 2025, whereas offshore wind is advancing at a 9.17% CAGR through 2031.
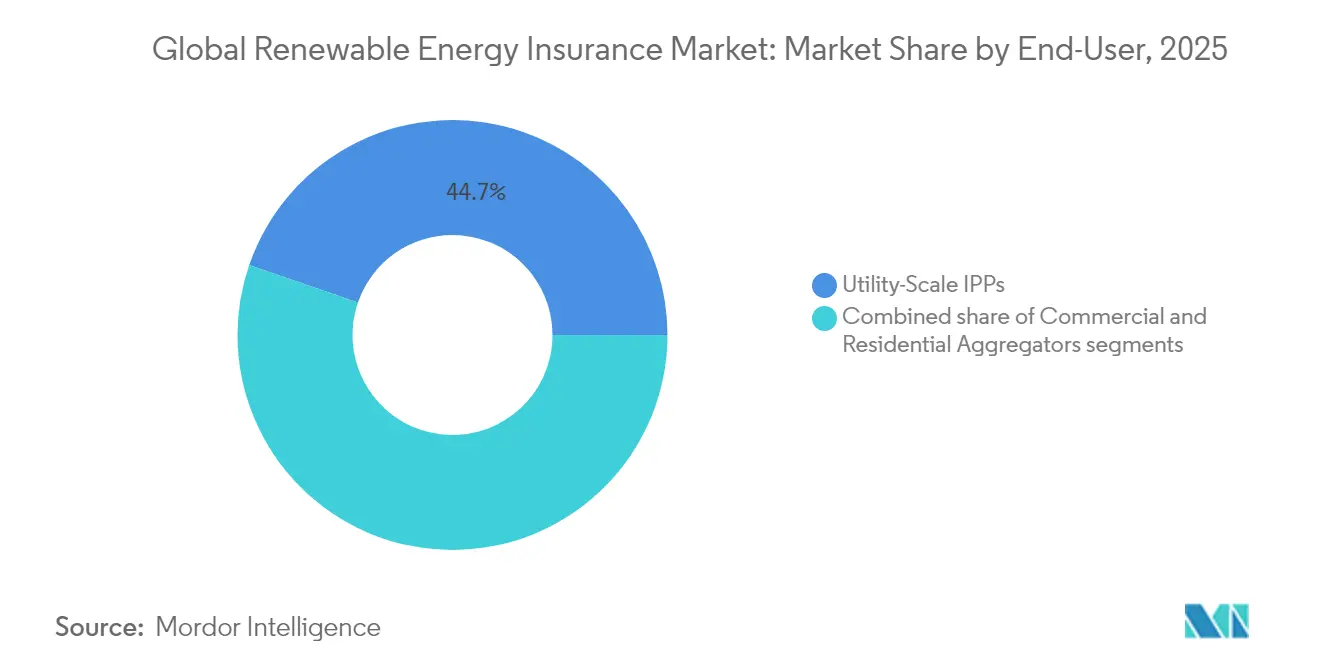
- By end-user, utility-scale independent power producers accounted for 44.72% of the renewable energy market size in 2025 and are progressing at an 8.27% CAGR to 2031.
- By geography, Europe led with 29.74% of the renewable energy market share in 2025; North America is poised to log the highest regional CAGR at 8.93% through 2031.
Note: Market size and forecast figures in this report are generated using Mordor Intelligence’s proprietary estimation framework, updated with the latest available data and insights as of 2026.
Global Renewable Energy Insurance Market Trends and Insights
Drivers Impact Analysis*
| Driver | (~) % Impact on CAGR Forecast | Geographic Relevance | Impact Timeline |
|---|---|---|---|
| Global roll-out of utility-scale solar & wind assets | +2.1% | Global, concentration in APAC and North America | Long term (≥ 4 years) |
| Escalating NatCat losses heightening risk-transfer demand | +1.8% | Global, particularly North America and Europe | Medium term (2–4 years) |
| Government decarbonization mandates & green-finance covenants | +1.4% | Europe and North America, expanding to APAC | Long term (≥ 4 years) |
| Investor/lender ESG compliance requirements for bankable cover | +1.2% | Global, led by Europe and North America | Medium term (2–4 years) |
| Rise of battery-energy-storage systems needing bespoke cover | +0.9% | Global, early adoption in North America and Europe | Medium term (2–4 years) |
| Adoption of parametric weather-index products for faster payouts | +0.3% | Global, pilot programs in emerging markets | Short term (≤ 2 years) |
| Source: Mordor Intelligence | |||
Global Roll-out of Utility-scale Solar & Wind Assets
Surging deployment of gigawatt-class renewables is widening demand for sophisticated insurance packages that go beyond traditional property indemnity. Swiss Re’s participation in reinsuring a 3,500 MW solar-plus-storage complex in the Philippines showcases the scale and complexity now commonplace for clean-energy megaprojects[1]Swiss Re, “Scaling Protection for Renewable Energy,” swissre.com. Coverage frameworks must span construction all-risk, operational performance guarantees, and multi-decade revenue stability while also addressing geographic clustering that amplifies correlated loss potential. Underwriters are responding with larger capacity tranches, granular catastrophe modeling, and multi-trigger structures that blend damage and index-based payouts. As project pipelines in APAC and North America accelerate, this driver exerts the largest positive push on overall premium growth in the renewable energy insurance market.
Escalating NatCat Losses Heighten Risk-Transfer Demand
Natural catastrophe losses tied to renewables have surged, exemplified by USD 300 million in US hail-related solar claims paid during the 2022 season. Although hail events represent just 6% of incidents, they account for more than 70% of photovoltaic system losses. The asymmetric peril profile is pushing carriers toward parametric solutions that trigger hailstone diameter or kinetic energy thresholds while developers adopt proactive measures such as automatic stow protocols. The feedback loop of higher loss ratios and specialty reinsurance pricing is hardening premiums, yet it also widens the addressable pool for differentiated products within the renewable energy insurance market.
Government Decarbonization Mandates & Green-Finance Covenants
Policy frameworks in Europe and North America increasingly tie project financing eligibility to demonstrable insurance protections that cover environmental liability, performance guarantees, and transition risks. The European Union’s sustainable finance taxonomy embeds these requirements, influencing underwriting appetites and sparking demand for standardized contract language[2]Clifford Chance, “EU Sustainable-Finance Insurance Requirements,” cliffordchance.com. Developers seeking access to green bonds must show comprehensive risk-transfer programs, thereby institutionalizing insurance purchases as a non-negotiable cost of capital. Over the long term, this structural linkage between regulation and bankable cover underpins recurring premium inflows into the renewable energy insurance market.
Investor/Lender ESG Compliance Requirements for Bankable Cover
As sustainable-bond issuance is projected to remain close to USD 1 trillion annually until 2025, banks and asset managers are increasingly demanding coverage that considers stranded-asset and policy-change scenarios[3]Environmental Finance, “Green Bond Market Outlook 2025,” environmental-finance.com. These scenarios include risks associated with the devaluation of assets due to regulatory changes or shifts in market dynamics. In response, insurers are crafting combined property and transition policies that activate in the event of shifts in subsidy regimes or carbon-pricing shocks that affect cash flows. These policies not only mitigate financial risks but also provide a framework for adapting to evolving environmental regulations. Its expanded focus transforms insurance from merely a construction necessity to a vital tool for ongoing ESG compliance, bolstering the growth trajectory of the renewable energy insurance market and supporting its role in facilitating sustainable investments.
Restraints Impact Analysis*
| Restraint | (~) % Impact on CAGR Forecast | Geographic Relevance | Impact Timeline |
|---|---|---|---|
| Capacity withdrawal & premium hardening across renewable lines | -1.5% | Global, acute in North America | Short term (≤ 2 years) |
| Limited actuarial loss data for emerging technologies | -0.8% | Global, concentration in BESS and offshore wind | Medium term (2–4 years) |
| Hail-related exclusions curbing solar cover in US Midwest | -0.6% | North America, US Midwest & Texas | Short term (≤ 2 years) |
| Cyber-risk aggregation across distributed assets deterring reinsurers | -0.4% | Global, early impact in developed markets | Medium term (2–4 years) |
| Source: Mordor Intelligence | |||
Capacity Withdrawal & Premium Hardening Across Renewable Lines
In response to a series of heightened natural catastrophe claims, numerous insurance carriers have either reduced their line sizes or withdrawn from specific perils, leading to significant rate hikes. According to GCube, US solar risks have seen premiums surge from 10 cents to as much as 30 cents for every USD 100 of insured value. This sharp increase reflects the growing challenges in underwriting renewable energy projects, particularly in regions prone to natural disasters. Additionally, reinsurers are tightening retrocession terms, compelling primary underwriters to transfer these increased costs to policyholders. Smaller developers find it challenging to manage rising deductibles and might postpone projects until there is a more favorable capacity. These delays could potentially impact the pace of renewable energy adoption in the short term. While new players with a focus on parametric solutions are stepping in to bridge the gap, traditional property covers, which require substantial balance sheets, remain limited and are expected to retain their high prices until 2026. This constrained capacity and premium hardening underscore the need for innovative risk transfer mechanisms to support the renewable energy sector's growth.
Limited Actuarial Loss Data for Emerging Technologies
BESS incidents have multiplied tenfold since 2016, yet loss datasets remain thin and often proprietary, driving conservative underwriting and higher deductibles. Offshore wind faces similar constraints around subsea-cable failures, which comprise 80% of claims but lack granular exposure coding. Insurers are partnering with turbine OEMs and marine surveyors to collect performance telemetry that can refine exposure curves. Blockchain-based registries are being piloted to record cable-fault events in real-time, though widespread adoption is several years away. Until actuarial credibility improves, capital providers view these risks as opaque, reducing available capacity and tempering renewable energy insurance market growth.
*Our forecasts treat driver/restraint impacts as directional, not additive. The impact forecasts reflect baseline growth, mix effects, and variable interactions.
Segment Analysis
By Coverage Type: Parametric Products Reshape Traditional Risk Transfer
Property damage & business interruption policies delivered 37.74% of the 2025 premium, securing the largest slice of the renewable energy insurance market share. They remain indispensable for lenders that require asset-level indemnification through construction and 20-year operational phases. However, parametric structures are projected to post a 9.92% CAGR through 2031, the fastest among all offerings, as buyers seek rapid liquidity following non-damage business interruption events such as wind-resource shortfalls. Construction All-Risk and Erection All-Risk plans to maintain relevance, especially for offshore projects that involve jack-up vessels and deep-water foundations. Liability forms covering third-party and environmental risks are evolving to include gradual pollution and wildlife-habitat clauses. Cyber & Technology Errors/Omissions coverage is expanding steadily as the renewable energy industry digitalizes control systems, raising aggregation exposures that traditional property wordings exclude. Together, these dynamics underscore the sophistication that carriers must embed to keep pace with evolving renewable energy insurance market requirements.
Innovation is visible in solar-radiation hedges, hail-parametric triggers, and wildfire smoke outage indices that compensate distributed energy resources for curtailed production. Carriers increasingly bundle conventional property contracts with parametric layers that drop down when deductibles erode profits. Brokers report that combined structures improve bankability by satisfying lender-mandated indemnity parameters while providing near-instant liquidity options for sponsors. The shift alters premium allocation and expands the renewable energy insurance market size for hybrid products that capture both physical damage and revenue stability needs.


By Renewable Energy Technology: Offshore Wind Drives Premium Growth
Utility-scale solar PV accounted for 31.55% of premiums in 2025, benefiting from standardized panel formats and long operating histories that ease underwriting workloads. Despite this scale, hail losses in the US Midwest highlight acute peril concentration risks, compelling players to introduce sub-limits or exclusions. Offshore wind retains a smaller slice currently, yet edges ahead with a 9.17% CAGR due to multi-gigawatt pipeline announcements in the North Sea, US Eastern Seaboard, and Taiwan Strait. The renewable energy market size for offshore wind cover is poised to climb rapidly as floating-turbine prototypes achieve commercial status, though subsea cable failures, now 80% of claim counts, still dominate loss severity and push insurers toward higher deductibles and extended warranty involvement.
Battery energy storage systems are becoming pivotal grid assets, and Aspen’s USD 75 million per location line underscores escalating limit needs. Micro-cracking endorsements and performance-degradation covers from kWh Analytics illustrate how analytics firms are partnering with underwriters to refine parametric triggers that offset data scarcity. Hydropower and marine-current schemes retain pockets of demand, particularly in Latin America and Southeast Asia, yet environmental regulatory hurdles limit their premium share. Collectively, technological segmentation ensures diversification and also obliges underwriters to retain specialist engineering talent, reinforcing barriers to entry and supporting the sustained expansion of the renewable energy insurance market.
By End-User: Utility-Scale IPPs Consolidate Market Leadership
Utility-scale independent power producers generated 44.72% of the 2025 premium and are forecast to expand at an 8.27% CAGR to 2031, cementing leadership in the renewable energy insurance market size. Their scale advantages allow aggregation of multi-state portfolios that attract multiline, multi-year programs featuring captive layers and catastrophe bonds. Commercial & industrial buyers show mounting interest in bundled covers that include construction, operation, and corporate ESG liabilities, yet still face market-access hurdles without brokered consortia. Residential aggregators & community solar operators grapple with micro-siting variations and distributed collections of rooftop systems; insurers respond with parametric triggers tied to county-level weather indices that simplify adjustment across thousands of sites.
Institutional capital flows are reinforcing the dominance of large IPPs; Ascend Analytics’ revenue-floor guarantee for a 200 MW storage project backed by UBS validates the demand for sophisticated structures combining merchant-price guarantees with operational risk coverage. Meanwhile, municipal utilities and cooperatives in the United States increasingly tap shared captive facilities to mitigate premium volatility. The depth and heterogeneity of the end-user landscape guarantee a resilient demand base for the renewable energy insurance market through 2030.
Geography Analysis
Europe maintained a 29.74% premium share in 2025, supported by stringent climate-risk disclosure regimes and well-established public-private NatCat pools that backstop insurer balance sheets. Regional offshore wind maturity delivers actuarial credibility, allowing competitive pricing and reducing the cost of capital for sponsors. Innovation hubs in Denmark, Germany, and the Netherlands accelerate the adoption of parametric hail and low-wind index covers, further widening Europe’s impact on the renewable energy insurance market.
North America is the fastest-growing region, charting a 8.93% CAGR on the strength of Inflation Reduction Act incentives and tailored solutions such as Marsh’s tax-investment-default coverage that insulates investors when tax-credit allocations fall short. However, catastrophic hail in the Midwest and wildfire-driven exclusions in California strain capacity, leading some carriers to reduce aggregate limits or enforce peril sub-limits. Developers are responding through elevated deductibles and layered captive programs to preserve bankability. Despite these headwinds, the renewable energy insurance market continues expanding as US and Canadian provincial programs fund grid modernization and BESS roll-outs.
Asia-Pacific is emerging as a pivotal demand center. China alone is commissioning multi-gigawatt solar parks and offshore arrays that require reinsurance treaties surpassing USD 1 billion in aggregate limits. Swiss Re’s involvement in the Philippines’ integrated solar-plus-storage megaproject demonstrates the scale of opportunity. Southeast Asian nations adopting blended-finance models rely on bank-guaranteed insurance structures to attract international capital. Diverse regulatory landscapes and climatic extremes, from typhoon-prone coastlines to monsoon-impacted interiors, challenge underwriters to create location-specific perils maps, thereby fueling product localization within the renewable energy insurance market.
South America and Africa remain smaller but high-potential territories. Brazil’s distributed-generation rules and Mexico’s merchant solar market open doorways for parametric drought covers, while South Africa’s REIPPPP program is experimenting with credit-enhanced insurance pools to mitigate PPA termination risks. As policy frameworks stabilize, insurers anticipate double-digit premium growth that will further diversify the global renewable energy insurance market.

Competitive Landscape
The renewable energy insurance market features moderate fragmentation. Global reinsurers such as Munich Re and Swiss Re leverage legacy energy expertise and sizable capital bases to offer multiline, multi-year capacity, often exceeding USD 250 million per placement. Munich Re recorded USD 6.15 net earnings in 2024 and ramped up product development covering green hydrogen, along with expanded cyber endorsements for distributed resources. Specialty carriers like GCube, Liberty Specialty Markets, and Axis Capital hold strong mid-market positions, focusing on tailored wording for offshore wind cables, BESS thermal-runaway, and US hail.
Analytics-driven entrants such as kWh Analytics and Descartes Underwriting differentiate by integrating vast performance datasets and satellite feeds. kWh Analytics’ Solar Revenue Put has insured more than 300,000 assets, enabling lenders to secure tighter debt service coverage ratios. Descartes deploys lidar and radar images to calibrate parametric tornado triggers, cutting claim settlement times to under 15 days for US solar farms. Brokers Marsh McLennan, WTW, Aon, and Gallagher command a collective two-thirds of placement intermediation, with Marsh’s 2025 acquisition of McGriff Insurance Services for USD 7.75 billion expanding mid-cap outreach.
Digital transformation is a decisive battleground. Carriers adopting blockchain-enabled policy admin and AI-driven damage assessment achieve lower expense ratios and faster payouts, crucial for bankability. Meanwhile, reinsurers are piloting probabilistic cyber-attack aggregation models to quantify systemic exposures across thousands of interconnected inverters and SCADA systems. Medium-term convergence between property, cyber, and transition-risk covers is anticipated, ensuring the renewable energy insurance market remains competitive yet innovation-intensive.
Renewable Energy Insurance Industry Leaders
Marsh McLennan
Willis Towers Watson (WTW)
Aon
Munich Re
Swiss Re
- *Disclaimer: Major Players sorted in no particular order

Recent Industry Developments
- March 2025: Terra Solar Philippines secured a reinsurance deal from Swiss Re for its ambitious project, which boasts a capacity of 3,500 MW of solar power paired with 4,500 MWh of storage, ensuring comprehensive protection from inception to completion.
- March 2025: In a move to bolster carbon credit transactions, Swiss Re introduced an insurance solution in collaboration with Good Carbon. This coverage safeguards against non-delivery risks, addressing concerns from natural catastrophes, weather fluctuations, and political upheavals.
- February 2025: In a strategic move to enhance its commercial property and casualty (P&C) offerings, including a focus on renewable energy, Marsh McLennan finalized its acquisition of McGriff Insurance Services for a substantial USD 7.75 billion.
- February 2025: Marsh, in partnership with We2Sure, rolled out an insurance product targeting counterfeit carbon credits. The initiative boasts backing from prominent players like Sompo, Brit, and Talbot.


Research Methodology Framework and Report Scope
Market Definitions and Key Coverage
Our study defines the renewable energy insurance market as all gross written premiums and re-insurance placements that specifically cover construction, operational, business interruption, and weather-indexed risks for utility-scale and commercial onshore wind, offshore wind, solar PV, hydropower, bioenergy, and battery storage assets across the project life cycle.
Scope exclusion: coverage written for fossil fuel, nuclear, or generic property portfolios is outside the study.
Segmentation Overview
- By Coverage Type
- Property Damage & Business Interruption
- Construction All-Risk / Erection All-Risk
- Liability (General, Environmental, Professional)
- Cyber & Technology Errors/Omissions
- Parametric / Index-based Covers
- By Renewable Energy Technology
- Onshore Wind
- Offshore Wind
- Utility-scale Solar PV
- Commercial & Industrial (C&I) Solar
- Hydropower & Marine Energy
- Bioenergy & Waste-to-Energy
- Battery Energy Storage Systems (BESS)
- By End-User
- Utility-Scale IPPs & Owners
- Commercial & Industrial Operators
- Residential Aggregators & Community Solar
- By Geography
- North America
- United States
- Canada
- Mexico
- Europe
- Germany
- United Kingdom
- France
- Italy
- Spain
- Russia
- Rest of Europe
- Asia-Pacific
- China
- India
- Japan
- South Korea
- Southeast Asia
- Rest of Asia-Pacific
- South America
- Brazil
- Argentina
- Rest of South America
- Middle East & Africa
- Saudi Arabia
- United Arab Emirates
- South Africa
- Rest of Middle East & Africa
- North America
Detailed Research Methodology and Data Validation
Primary Research
Interviews with underwriters, brokers, project developers, and lenders in North America, Europe, and Asia provided live premium rate corridors, deductible trends, and emerging coverage gaps. Follow-up surveys with claims engineers and risk consultants helped us validate loss frequency assumptions and stress test modeled growth drivers.
Desk Research
Analysts at Mordor Intelligence gathered baseline data from freely available tier-one sources such as IRENA capacity statistics, IEA Renewables 2024, UNFCCC project registries, EU Climate Law disclosures, and national insurance supervision filings. They then blended that with company 10-Ks, broker market reports, and loss ratio snapshots published by industry associations. Paid databases, including D&B Hoovers for carrier financials and Dow Jones Factiva for policy volume news, supplied supplemental numbers. These references illustrate the breadth of material reviewed; many additional publications were consulted to cross-check figures and narrative insights.
Market-Sizing & Forecasting
A top-down reconstruction starts with installed renewable capacity (MW) and project capex pools by technology and region, converts those into insured asset values using median EPC cost curves, and applies current premium rate bands to derive theoretical premium potential. Select bottom-up checks, carrier filings, sampled broker placements, and average premium per MW are layered in to adjust totals where market concentration or self-insurance skews results. Key variables tracked include annual capacity additions, average premium rate shifts, claim severity ratios, lender insurance covenants, and currency movements. Forecasts to 2030 rely on multivariate regression linking premiums to capacity additions and rate cycles, bounded by three scenarios vetted with interviewed experts. Data gaps in country-level filings are bridged through regional rate proxies and capacity roll-ups.
Data Validation & Update Cycle
Outputs run through anomaly filters, year-over-year variance checks, and peer review before sign-off. Models refresh every twelve months, with interim adjustments triggered by significant regulatory or catastrophic loss events; a fresh validation pass precedes each client delivery.
Why Mordor's Renewable Energy Insurance Baseline Stands Firm
Published estimates often diverge because firms choose dissimilar coverages, years, and rate assumptions.
Key gap drivers include: some studies merge oil and gas lines with renewables, others freeze exchange rates, and several rely on headline premium pools without bottoms-up rate checks. Mordor's disciplined scope selection, dual-track modeling, and annual refresh cadence narrow these gaps and provide decision makers a dependable anchor.
Benchmark comparison
| Market Size | Anonymized source | Primary gap driver |
|---|---|---|
| USD 18.77 B (2025) | Mordor Intelligence | - |
| USD 17.97 B (2024) | Regional Consultancy A | Combines select transitional fuels; older base year |
| USD 18.62 B (2024) | Global Consultancy B | Uses single premium per MW factor, no rate drift modeling |
| USD 19.40 B (2024) | Industry Journal C | Applies broad financial services growth rate; limited scope clarity |
The comparison shows that while headline values cluster, variations stem from scope breadth and modeling shortcuts. Mordor's variable level, rate aware framework delivers a balanced, transparent baseline that clients can trace, question, and replicate with confidence.


Key Questions Answered in the Report
What is the current size of the global Renewable Energy Insurance Market?
The global Renewable Energy Insurance Market is valued at USD 20.11 billion in 2026 and is set to increase to USD 28.35 billion by 2031.
Which region holds the largest share of renewable-energy insurance premiums?
Europe leads with a 29.74% share, benefiting from stringent climate regulations and mature offshore wind portfolios.
Why are parametric insurance products growing so quickly?
Parametric covers offer rapid, index-based payouts that address non-damage revenue losses, helping close protection gaps that traditional indemnity policies leave open.
How are natural catastrophes influencing renewable-energy insurance pricing?
Elevated hail, wildfire, and hurricane losses have driven premium hardening and capacity withdrawals, especially in the United States Midwest and California.
Which technology segment is expanding fastest for insurance demand?
Offshore wind shows the highest premium CAGR at 9.17% due to large multi-gigawatt projects and complex subsea cable exposures requiring specialized risk transfer.
What coverage innovations support battery energy storage systems?
Insurers now offer higher single-site limits, thermal-runaway endorsements, and revenue-floor guarantees that reflect the unique risk profile of large lithium-ion installations.
Page last updated on:


