Remittance Market Size and Share
Market Overview
| Study Period | 2020 - 2031 |
|---|---|
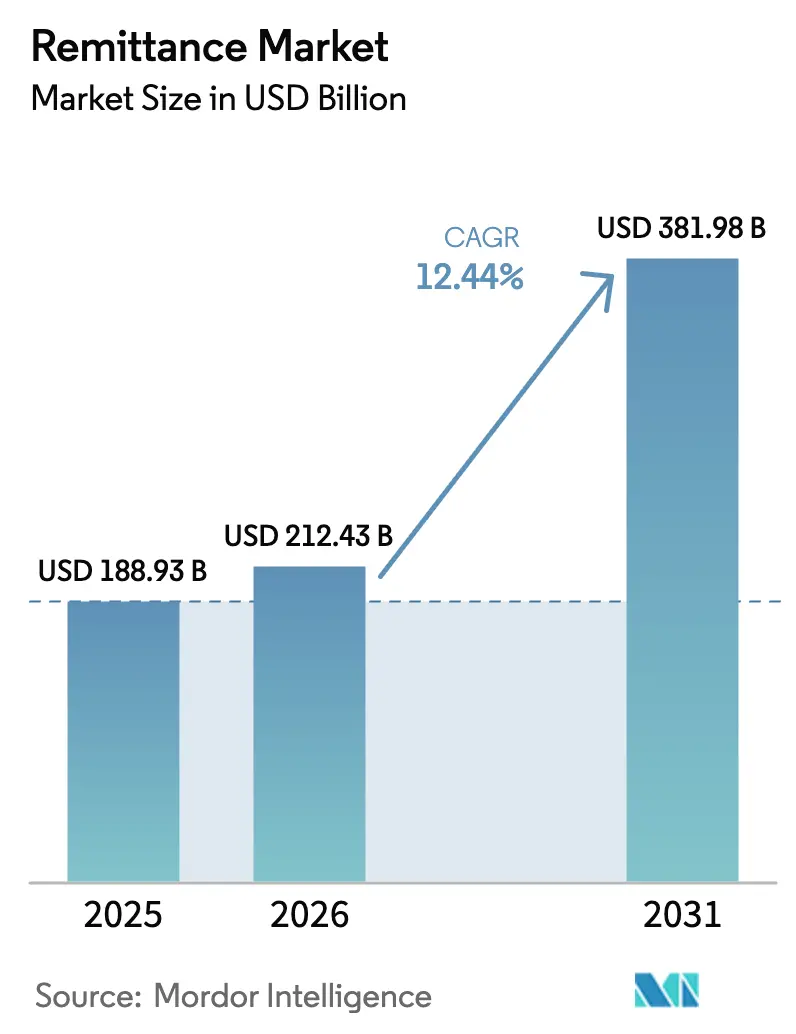
| Market Size (2026) | USD 212.43 Billion |
| Market Size (2031) | USD 381.98 Billion |
| Growth Rate (2026 - 2031) | 12.44% CAGR |
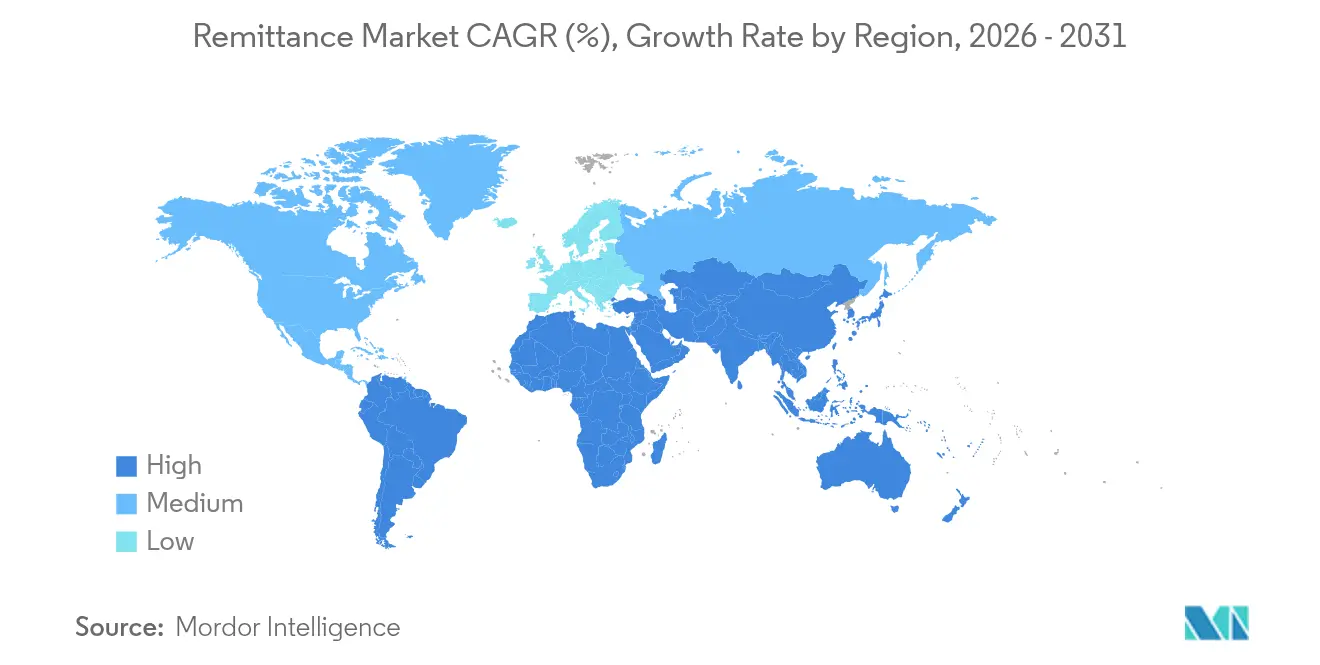
| Fastest Growing Market | Middle East and Africa |
| Largest Market | North America |
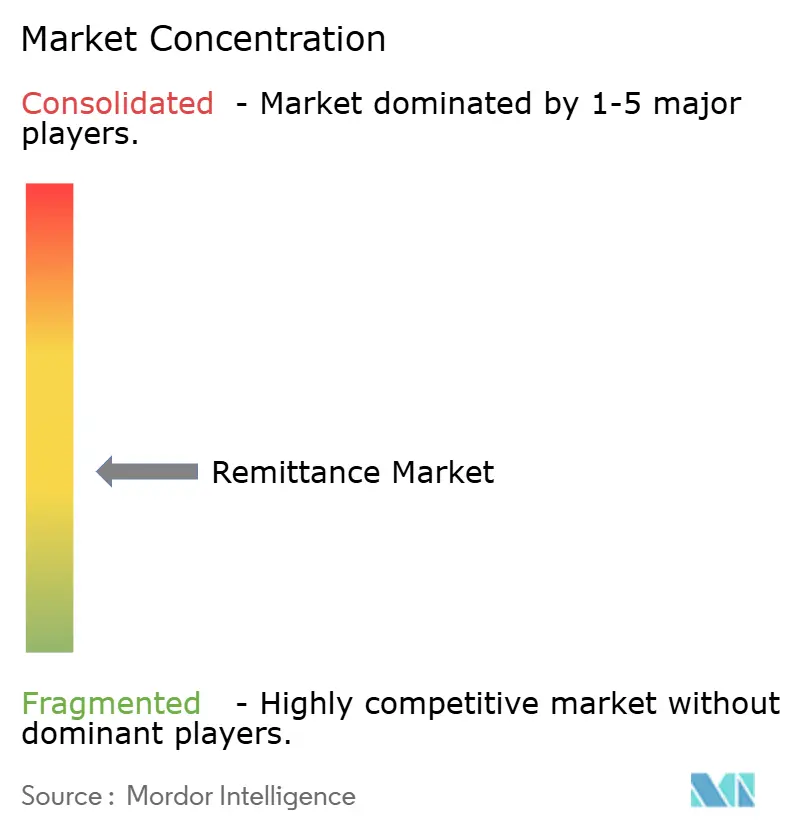
| Market Concentration | Medium |
Major Players
*Disclaimer: Major Players sorted in no particular order Image © Mordor Intelligence. Reuse requires attribution under CC BY 4.0. |
|
Remittance Market Analysis by Mordor Intelligence
The Remittance Market size was valued at USD 188.93 billion in 2025 and estimated to grow from USD 212.43 billion in 2026 to reach USD 381.98 billion by 2031, at a CAGR of 12.44% during the forecast period (2026-2031).
The expansion stems from steady migrant inflows, continuous digital-payments innovation, and active financial-inclusion policies across sending and receiving corridors. Asia-Pacific is accelerating fastest on the back of mobile-money ecosystems, whereas North America retains a leadership position in overall transaction volumes. Real-time rails, blockchain-enabled micro-payments, and lower compliance barriers for fintech entrants are redefining competitive boundaries. At the same time, government-backed incentive schemes and diaspora-targeted investment products are converting remittance flows into broader development capital.
Key Report Takeaways
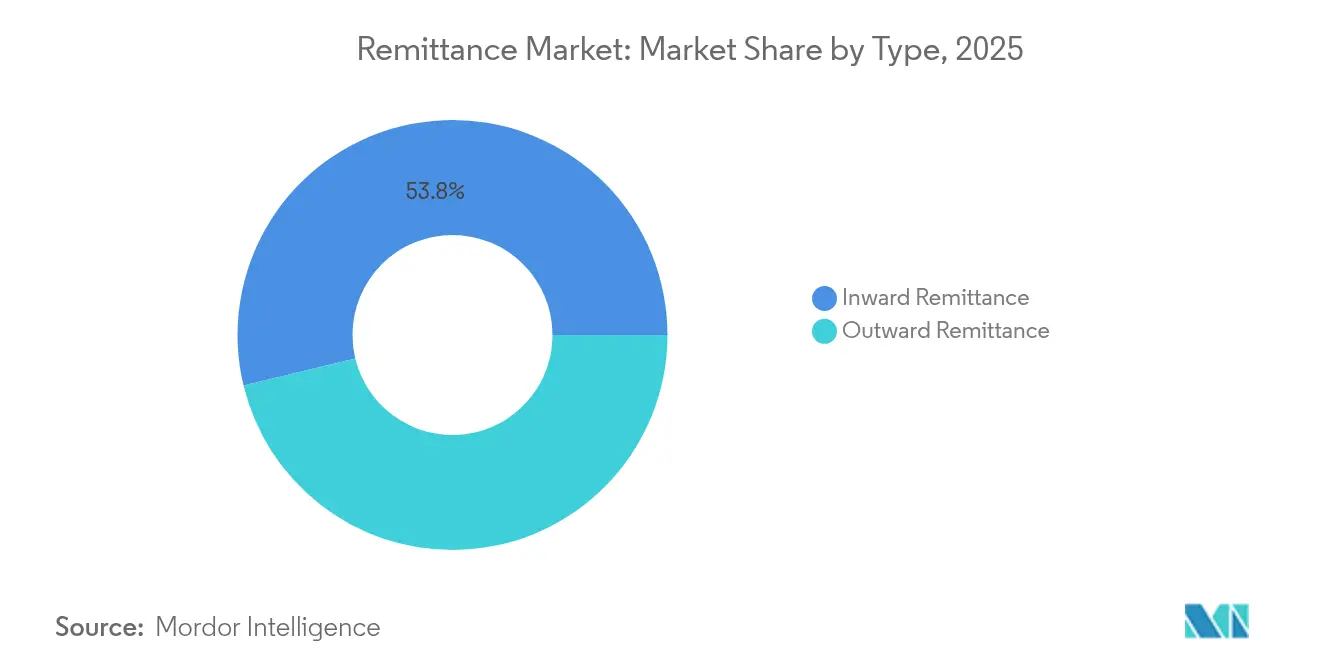
- By type, inward transfers held 53.78% of market share in 2025, while outward flows are forecast to advance at a 13.02% CAGR through 2031.
- By mode of transfer, traditional channels commanded 71.65% of the remittance market size in 2025; digital channels are projected to grow 15.41% annually to 2031.
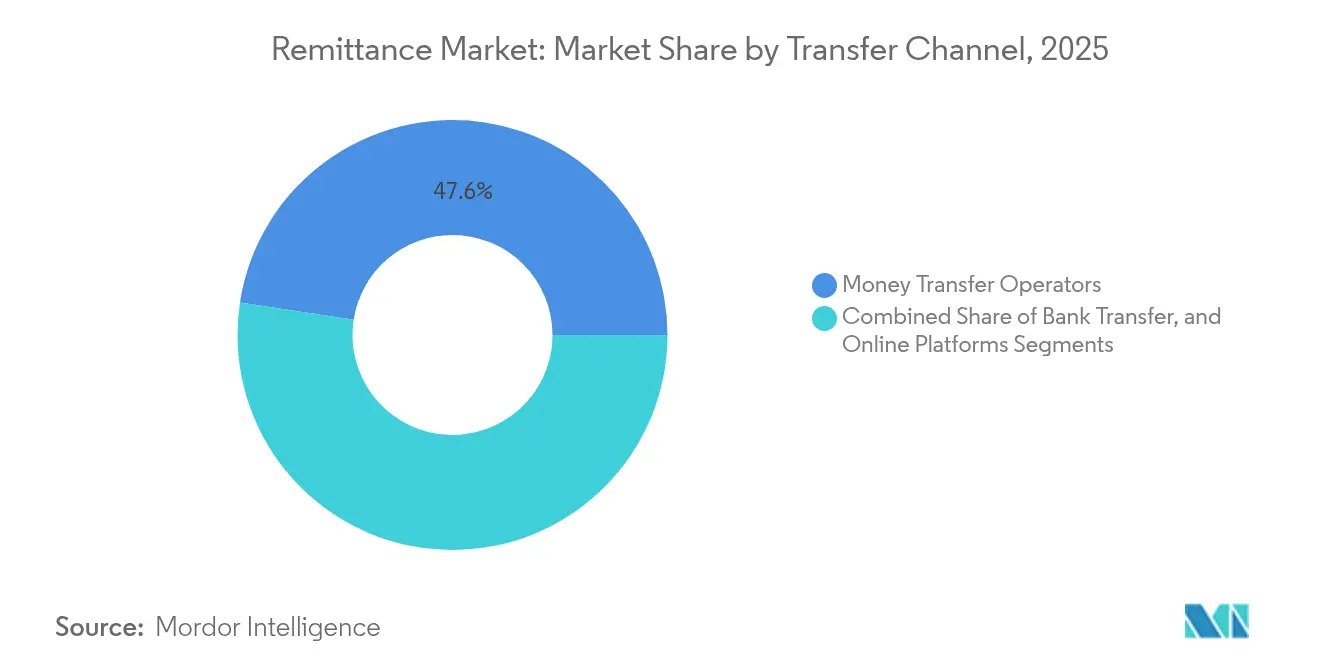
- By transfer channel, money-transfer operators led with 47.58% of market share in 2025, whereas online platforms are expanding at a 18.89% CAGR.
- By end-user, personal transfers accounted for 88.05% of the remittance market size in 2025, but commercial transfers post the fastest 15.03% CAGR through 2031.
Note: Market size and forecast figures in this report are generated using Mordor Intelligence’s proprietary estimation framework, updated with the latest available data and insights as of 2026.
Global Remittance Market Trends and Insights
Drivers Impact Analysis*
| Drivers | (~) % Impact on CAGR Forecast | Geographic Relevance | Peak Impact |
|---|---|---|---|
| Surge in migrant worker flows from Sub-Saharan Africa to GCC corridors | +2.1 | Sub-Saharan Africa, Middle East (GCC) | Medium term |
| Mobile-money interoperability in East Africa lowering fees | +1.8 | East Africa, with spillover to other African regions | Medium term |
| Real-time payment rails (PIX, UPI) accelerating South America-Asia transfers | +2.3 | Latin America, Asia-Pacific | Medium term |
| Blockchain-based micro-remittances cutting cost to < US$1 | +1.5 | Global, with early adoption in Asia-Pacific and North America | Long term |
| Nigeria's Naira4Dollar and similar FX-incentive schemes | +0.9 | Africa, with focus on Nigeria and other countries with similar schemes | Short term |
| Diaspora bonds and remittance-linked investment products | +0.7 | Global, with emphasis on major remittance-receiving countries | Long term |
| Source: Mordor Intelligence | |||
Surge in migrant worker flows from Sub-Saharan Africa to GCC corridors
Migration into Gulf economies rose sharply, with foreign nationals now exceeding half of the GCC resident workforce. Saudi Arabia alone remitted USD 38 billion in 2023. [1]German Federal Statistical Office, “Remittances by Migrants,” destatis.de Legal reforms to the kafala system have improved labor mobility, bolstering migrant earning potential and, by extension, outbound transfers. As corridors expand, specialized pay-out partners are embedding local-currency disbursement tools that cut settlement time. Supervisory agencies are also tightening data-collection standards, which should enhance visibility on corridor-level flows and help policymakers fine-tune inclusion targets. Given demographic momentum and ongoing megaproject hiring, the upside for the remittance market remains significant through the medium term.
Mobile-money interoperability in East Africa lowering fees
Inter-network agreements among mobile-money operators have brought average transfer fees down by 2.3 percentage points compared to cash-based alternatives. [2]Rishi Raithatha & Gianluca Storchi, “State of the Industry Report on Mobile Money 2025,” gsma.com The wider service range—savings, credit, insurance—reinforces wallet stickiness and lifts average balance growth. Lower costs have also shifted activity from informal avenues to regulated digital rails, improving AML compliance. Regulators, in turn, are pushing proportional KYC rules that acknowledge national ID gaps while safeguarding systemic integrity. As smartphone penetration edges past 60%, wallet-anchored transfers are projected to capture deeper share of the remittance market in East Africa and spill over to adjacent regions.
Real-time payment rails (PIX, UPI) accelerating South America-Asia transfers
Brazil’s PIX system clocked 1 billion monthly transactions within its first year, and India’s UPI crossed 11 billion monthly in late-2024. [3]ACI Worldwide, “Prime Time for Real-Time Report 2022,” aciworldwide.com Bilateral linkages—PromptPay-PayNow in Southeast Asia, PIX-UPI pilots—are shaving processing windows to seconds and compressing FX spreads. For exporters and gig-workers, instant settlement removes working-capital drag. Corridor-specific fintechs are layering credit-scoring APIs atop these rails, enabling same-day micro-loans collateralized by incoming remittances. With G20 targets pushing 75% of cross-border payments to settle within an hour by 2027, real-time rails stand out as a decisive growth lever for the market.
Blockchain-based micro-remittances cutting cost to < USD 1
Protocols such as RippleNet process settlements in under five seconds at near-zero network fees. [4]Mohammad El Hajj & Imad Farran, “Blockchain in Remittances,” doi.org Stablecoin rails further insulate value from EM-currency volatility, helping senders lock in rates before pay-out. Compliance layers—travel-rule APIs and smart-contract-based sanctions screening—are reducing correspondent-bank dependencies. While regulatory uncertainty still limits mass adoption, sandbox programs in Singapore and the UAE signal growing policy support. As layered solutions mature, blockchain micro-payments are set to widen access for low-ticket transactions that were previously uneconomical, giving the remittance market fresh headroom.
Restraints Impact Analysis*
| Restraints | (~) % Impact on CAGR Forecast | Geographic Relevance | Peak Impact |
|---|---|---|---|
| De-risking driven correspondent-bank closures in SIDS | -1.2 | Small Island Developing States, Caribbean, Pacific | Medium term |
| EM currency volatility discouraging senders | -0.8 | Global, with emphasis on emerging markets | Short term |
| Data-localization mandates hindering cross-border wallets | -1.0 | Global, with focus on countries implementing strict data localization laws | Medium term |
| Cash-dominant migrant clusters in GCC limiting digital uptake | -0.7 | Middle East (GCC), with impact on South Asian and African corridors | Short term |
| Source: Mordor Intelligence | |||
De-risking driven correspondent-bank closures in SIDS
Global banks have trimmed 30% of correspondent lines to certain island economies since 2017, citing AML compliance cost spikes. Tonga, where remittances represent nearly 47% of GDP, now faces limited access to formal rails, pushing average fees above 10%. Regional fintech hubs are piloting shared KYC utilities, yet capital-controls legislation slows onboarding. Unless multilateral credit-enhancement facilities materialize quickly, the remittance market in small islands will keep operating below potential.
EM currency volatility discouraging senders
Sharp swings in Naira, Peso, and Egyptian Pound pairs have eroded purchasing power at destination, cutting sender volumes by up to 20% during peak turbulence. Stablecoin remittances, used by 26% of surveyed U.S. migrants, offer partial insulation but remain niche. Larger providers are experimenting with rate-lock options at point of sale. While hedging tools ease short-term pain, macro stability in recipient economies remains the structural fix the remittance market needs.
*Our forecasts treat driver/restraint impacts as directional, not additive. The impact forecasts reflect baseline growth, mix effects, and variable interactions.
Segment Analysis
By Type: Inward Dominance, Outward Momentum
Inward transfers accounted for 53.78% of remittance market share during 2025. India alone attracted USD 120 billion, while Mexico and the Philippines combined took in USD 105 billion, reflecting entrenched migration ties. The market size attached to inward flows is expected to hold steady as recipient households channel funds toward basic consumption, healthcare, and education. Digital disbursement platforms integrated with micro-insurance add stickiness and help convert one-way transfers into broader service bundles.
Outward transfers, at a 46.22% share, are expanding 13.02% annually—faster than the overall remittance market. North-South and emerging South-South corridors underpin the surge. Multi-currency accounts offered by neo-banks let expatriates route funds across several destinations without repeated onboarding, increasing transaction frequency. Compliance automation tools now parse destination-country sanctions lists in real time, reducing sender drop-off. Consequently, the outward component enlarges the market size and diversifies provider revenue streams.


By Mode of Transfer: Digital Upswing amid Traditional Stronghold
Traditional agents and bank counters retained 71.65% of remittance market share in 2025, anchored by high-trust rural networks. Nonetheless, mounting cost-of-cash and tighter AML screening are dampening growth momentum. Providers are optimizing agent networks using location analytics and shifting larger-ticket flows toward account-to-account corridors.
Digital methods recorded a 15.41% CAGR and will likely eclipse a 40.12% slice of the market by 2031. Faster KYC through biometric ID, fee transparency, and in-app FX tools fuel adoption. Real-time ledgering also minimizes float risk for providers. For consumers, average remittance fees have dropped to 4.96%, improving disposable income at destination.
By Transfer Channel: MTO Leadership, Online Surge
Money-transfer operators held a 47.58% grip on the global remittance market in 2025. Their hybrid brick-digital proposition offers last-mile flexibility, especially in cash-preferred locales. Yet margin pressure is intense; fee grids are moving toward sub-3% thresholds in major corridors, compelling back-office automation and agent-commission redesign.
Online-first platforms, expanding at 18.89% CAGR, exemplify asset-light scaling. Transparent mid-market FX rates and instant price quotes enhance user trust. ISO 20022 messaging standards improve orchestration with banks, bringing down exception-handling costs. As user acquisition costs fall through referral loops and embedded transfer buttons, online challengers are positioned to capture incremental market share more rapidly than legacy peers.
Bank transfers, though smaller, leverage deep balance-sheet trust and payroll integration. White-label APIs let banks embed third-party FX engines, enlarging their service menu without major tech overhauls.
By End-User: Personal Core, Commercial Upshift
Personal transfers occupied 88.05% of the remittance market size in 2025, underlining their welfare role. About three-quarters of incoming funds settle essential expenses before residual sums are invested in housing or education. Digital wallets now offer micro-investment tabs, nudging senders toward goal-based saving plans.
Commercial transfers—for SME payroll, supplier payments, and freelancer invoices—stand at an 11.95% slice but grow 15.03% annually. Cross-border e-commerce platforms integrate instant-settlement modules, letting sellers repatriate earnings daily. Trade-finance digitization and blockchain bills of lading further compress cash-conversion cycles, stimulating incremental volumes into the remittance market.
Geography Analysis
North America controlled 33.88% of 2025 flows, powered by its sizable immigrant workforce. The U.S.-Mexico corridor alone funneled USD 66.2 billion. Fintech incumbents have embedded remittance widgets inside neobank apps, catalyzing repeat transaction frequency. Regulatory clarity on digital banks and stablecoins also fosters innovation that keeps the region at the forefront of the remittance market.
Asia-Pacific clocks a 14.06% CAGR to 2031, reflecting its dual sender-receiver status. India is projected to top USD 129 billion in 2024 inflows, while expatriates in Japan and Australia drive rising outbound volumes. UPI’s domestic success spills into regional corridors via network-to-network bridges, lowering average fees below the SDG 3% threshold in 53% of reported corridors. Hence, Asia-Pacific’s digital intensity positions it to seize an outsized share of future market size expansions.
Europe remains a pivotal source region supplied by Germany, the UK, and France. Average fees have fallen yet still sit at 5.8% on a USD 200 ticket, above the G20 target. Open-banking mandates and PSD3 proposals aim to foster cross-provider interoperability, which should gradually compress costs. With sizable Ukrainian and Syrian diasporas—plus intra-EU worker remittances—the continent’s corridor complexity continues to influence product design in the remittance market.
Latin America witnesses surging digital adoption. Brazil’s PIX underpins instant domestic transfers and is extending to cross-border pilots. Mexico’s share of the remittance market accelerates as gig-platform workers and seasonal laborers favor transparent FX apps. Regulatory sandboxes in Colombia and Chile nurture wallet interoperability that could unlock new south-south routes to Peru and Bolivia.
The Middle East and Africa deliver contrasting patterns. GCC countries are among the world’s largest senders due to high expatriate concentrations, yet cash preference persists, capping digital uptake. Sub-Saharan Africa, recipient of USD 100 billion in 2023, still pays the highest average fees globally despite mobile-money leadership. Regulatory drive toward unified continental payment systems (AfCFTA PAPS) offers a medium-term route to cost reduction and wider market coverage.
Mordor Intelligence provides coverage of the remittance market across other key regional markets. Detailed country-level analysis extends to Philippines incorporating local coverage and market participation, as required.

Competitive Landscape
Traditional majors maintain scale advantages, yet fintech challengers chip away through pricing agility and user-centric design. Western Union’s planned Dash wallet acquisition adds a 1.2 million-user Asian ecosystem, signalling pivot from agent reliance to end-to-end digital capability. MoneyGram’s new leadership is accelerating cloud-based settlement, shortening reconciliation cycles to enhance cash-flow predictability for agents.
Digital disruptors ride data-driven segment marketing. Wise doubled its USD-linked debit-card issuance in 18 months, embedding cross-border spend and transfer in one journey. Remitly now services 5,100 corridors, with AI-powered risk engines that cut chargeback costs by 18%. Both firms leverage multi-currency balances, which act as float and generate interest revenue that subsidizes headline fees, allowing them to win incremental remittance market share.
Bank-fintech partnership models flourish. JPMorgan’s Liink network offers pre-validated beneficiary data to select MTOs, slashing repair fees. Singapore’s DBS partners with TransferMate to offer next-day corporate remittances to 70 markets, a capability difficult to replicate through internal builds alone. Collectively, ecosystem interplay increases switching costs for customers and intensifies competition for transaction margin.
Remittance Industry Leaders
-
Western Union Company
-
MoneyGram International Inc.
-
Wise plc (formerly TransferWise)
-
PayPal Holdings Inc. (incl. Xoom Corp.)
-
Revolut Ltd.
- *Disclaimer: Major Players sorted in no particular order

Recent Industry Developments
- April 2025: Wise plc reported a 24% year-over-year revenue increase to GBP 1.05 billion for FY 2024, with its customer base reaching 12.8 million, underscoring digital-first scale economics.
- March 2025: The Financial Stability Board announced tangible progress on the G20 roadmap, advancing interoperability standards that underpin future remittance-fee reductions.
- February 2025: IFAD launched RemitSCOPE, a free data platform designed to enhance corridor transparency and support policy alignment.
- January 2025: The Central Bank of the UAE released plans for a wholesale-retail CBDC aimed at streamlining domestic and cross-border remittances within its Financial Infrastructure Transformation Program.


Global Remittance Market Report Scope
A remittance is money sent to another party, usually in another country. Typically, the sender is a foreign worker and the recipient is a relative in the recipient's home country. Remittances represent one of the largest sources of income for people in low-income and developing nations.
The remittance market is segmented by mode of transfer (digital, traditional), by end-user (commercial, personal), geography (North America, Europe, Asia-Pacific, Latin America, Middle East and Africa). The market sizes and forecasts are provided in terms of value (USD) for all the above segments.
| Inward Remittance |
| Outward Remittance |
| Digital |
| Traditional |
| Bank Transfer |
| Money Transfer Operators |
| Online Platforms |
| Personal (Migrant Remittances) |
| Commercial (SME and Corporate Payments) |
| North America | United States |
| Canada | |
| Mexico | |
| Europe | Germany |
| United Kingdom | |
| France | |
| Spain | |
| Rest of Europe | |
| Asia-Pacific | China |
| India | |
| Japan | |
| South Korea | |
| Rest of Asia-Pacific | |
| South America | Brazil |
| Argentina | |
| Rest of South America | |
| Middle East | Saudi Arabia |
| United Arab Emirates | |
| Rest of Middle East | |
| Africa | South Africa |
| Rest of Africa |
| By Type | Inward Remittance | |
| Outward Remittance | ||
| By Mode of Transfer | Digital | |
| Traditional | ||
| By Transfer Channel | Bank Transfer | |
| Money Transfer Operators | ||
| Online Platforms | ||
| By End-User | Personal (Migrant Remittances) | |
| Commercial (SME and Corporate Payments) | ||
| By Geography | North America | United States |
| Canada | ||
| Mexico | ||
| Europe | Germany | |
| United Kingdom | ||
| France | ||
| Spain | ||
| Rest of Europe | ||
| Asia-Pacific | China | |
| India | ||
| Japan | ||
| South Korea | ||
| Rest of Asia-Pacific | ||
| South America | Brazil | |
| Argentina | ||
| Rest of South America | ||
| Middle East | Saudi Arabia | |
| United Arab Emirates | ||
| Rest of Middle East | ||
| Africa | South Africa | |
| Rest of Africa | ||


Key Questions Answered in the Report
How big is the remittance market today and how fast is it growing?
The market stands at USD 212.43 billion in 2026 and is projected to climb to USD 381.98 billion by 2031, reflecting a 12.44% CAGR.
Which region will witness the quickest expansion in remittances through 2031?
Asia-Pacific leads growth with a 14.06% CAGR, driven by mobile-money uptake and real-time payment linkages such as India’s UPI.
What channel captures the highest remittance market share?
Money-transfer operators hold 47.58% of 2025 flows, although online-only platforms are gaining ground at a 18.89% CAGR.
How do fees compare between digital and traditional remittances?
Digital transfers averaged a 4.96% cost on a USD 200 transaction in Q1 2024, versus 6.94% for non-digital methods, giving senders meaningful savings.
What innovations will shape future remittance services?
Real-time payment rails, blockchain micro-remittances, and diaspora-linked investment products are set to lower costs, speed settlement, and unlock new revenue streams.
Are government incentive schemes effective in boosting formal remittance flows?
Evidence from Nigeria’s Naira4Dollar and Bangladesh’s 2% cash bonus shows formal inflows rising 6–7%, indicating that well-structured incentives can redirect funds from informal channels.
Page last updated on:


