Market Overview
| Study Period | 2019 - 2030 |
|---|---|
| Forecast Data Period | 2025 - 2030 |
| Historical Data Period | 2019 - 2023 |
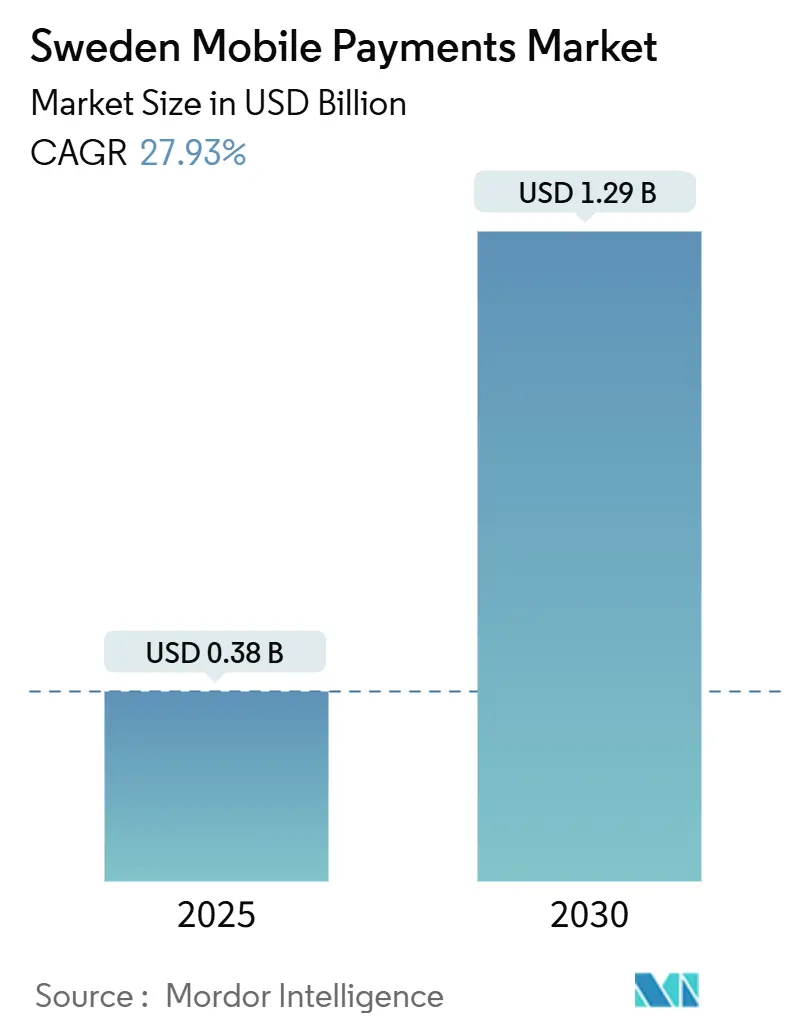
| Market Size (2025) | USD 0.38 Billion |
| Market Size (2030) | USD 1.29 Billion |
| Growth Rate (2025 - 2030) | 27.93% CAGR |
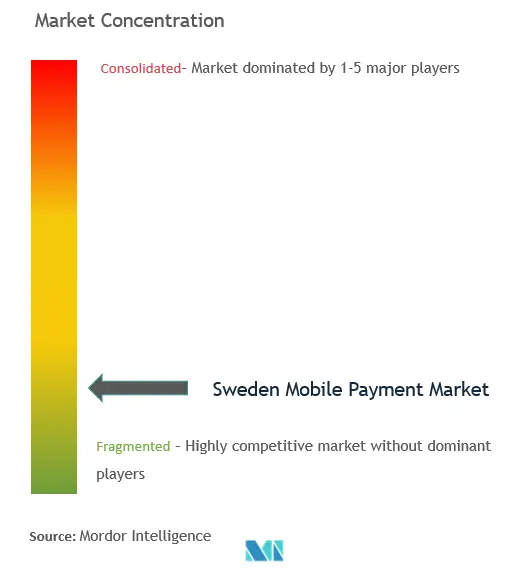
| Market Concentration | Medium |
Major Players *Disclaimer: Major Players sorted in no particular order Image © Mordor Intelligence. Reuse requires attribution under CC BY 4.0. | |
Sweden Mobile Payments Market Analysis by Mordor Intelligence
The Sweden mobile payments market is valued at USD 0.38 billion in 2025 and is forecast to climb to USD 1.29 billion by 2030, reflecting a powerful 27.93% CAGR. Strong digital literacy, near-universal 5G coverage, and a national ID infrastructure that removes verification friction are reinforcing daily usage of mobile wallets across retail, transit, and peer‐to‐peer settings. Accelerating migration by small and mid-sized merchants to QR-based point-of-sale (PoS) acceptance is widening consumer touchpoints, while the Instant Payments Regulation is lowering unit economics and fostering new entrants. The Sweden mobile payments market is also benefiting from the government’s long-standing ambition to reduce cash, with cash circulating at only 1.25% of GDP, and from sustainability-oriented features that resonate with Gen Z consumers. Rising fraud incidents and interchange-fee pressure remain headwinds, yet heavy investment in security and data-led value-added services continues to support adoption momentum.
Key Report Takeaways
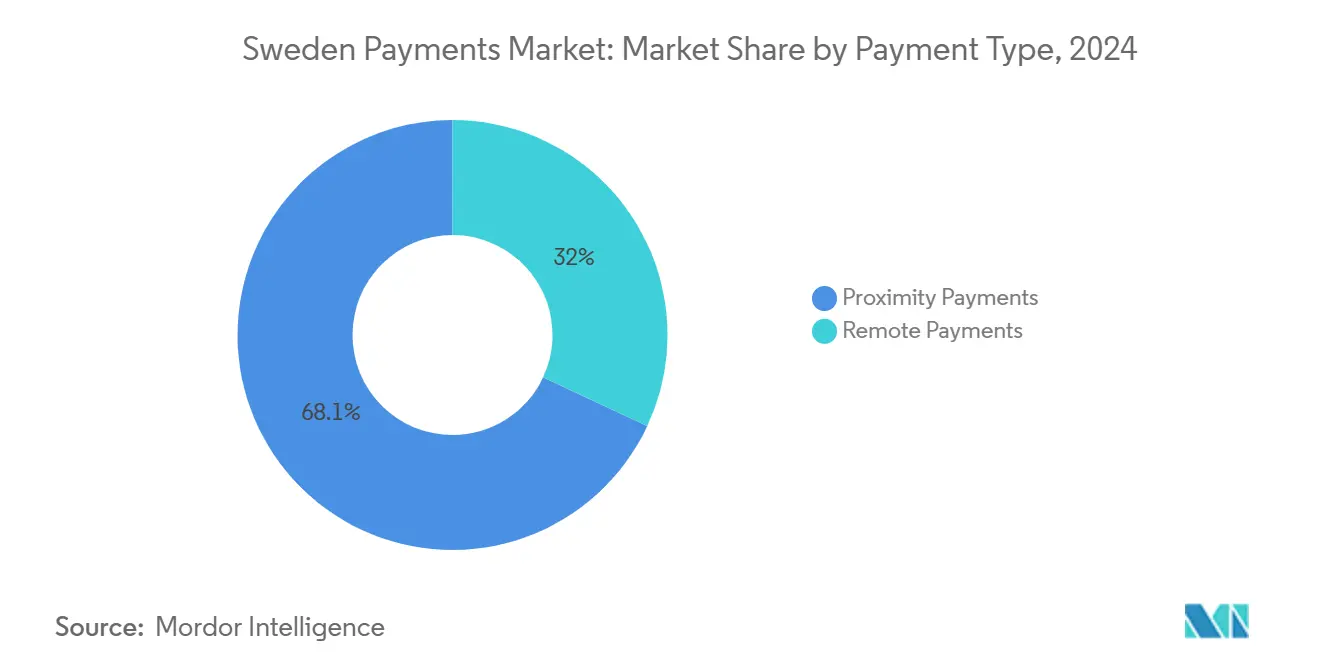
- By payment type, proximity payments held a 68.05% share of the Sweden mobile payments market in 2024; remote payments are projected to advance at a 34.20% CAGR to 2030.
- By transaction type, in-store PoS led with 44.22% of Sweden mobile payments market share in 2024, while peer-to-peer transactions are forecast to register a 32.50% CAGR through 2030.
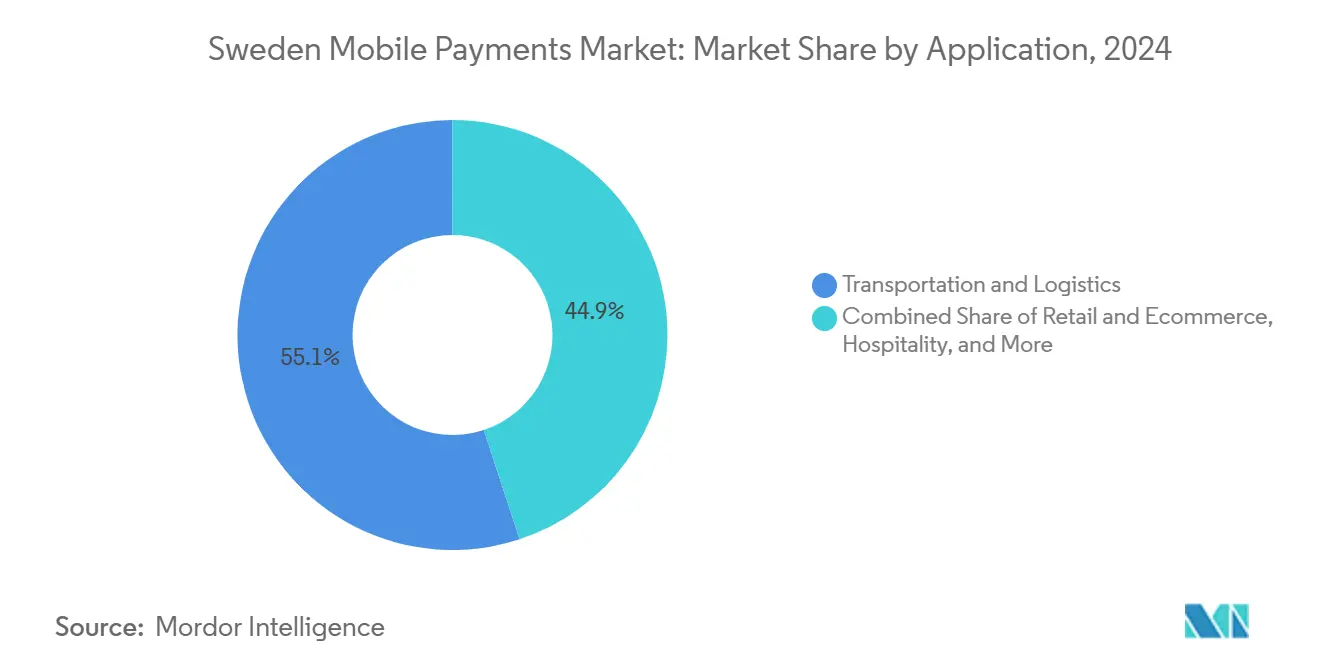
- By application, transportation and logistics accounted for 55.06% of Sweden mobile payments market size in 2024; retail & e-commerce will expand fastest at a 35.04% CAGR between 2025 and 2030.
- By end-user, personal users dominated with an 80.12% share in 2024, whereas business users are expected to grow at a 31.07% CAGR during 2025-2030.
Sweden Mobile Payments Market Trends and Insights
Drivers Impact Analysis*
| Driver | (~) % Impact on CAGR Forecast | Geographic Relevance | Impact Timeline |
|---|---|---|---|
| BankID-enabled user authentication ubiquity | +7.0% | National, with cross-border implications for Nordic countries | Short term (≤ 2 years) |
| High contactless & smartphone penetration | +6.1% | National, with urban centers leading adoption | Short term (≤ 2 years) |
| Government push toward a cash-less society | +5.6% | National, with policy influence extending to EU | Medium term (2-4 years) |
| Rapid migration by SMEs to Swish QR for PoS | +4.2% | National, with concentration in retail and service sectors | Medium term (2-4 years) |
| Digital-ID integration with public-service wallets | +2.8% | National, with initial focus on major urban centers | Medium term (2-4 years) |
| Carbon-tracking "green receipt" features attracting Gen-Z | +2.2% | National, with higher impact in urban areas | Long term (≥ 4 years) |
| Source: Mordor Intelligence | |||
BankID-enabled user authentication ubiquity
BankID processed 7.6 billion authentications in 2024, covering 99.9% of the Swedish adult population and connecting to 7,500 online services, 18% of which relate directly to payments.1BankID, “Statistics,” bankid.com This uniform identity layer removes onboarding friction, shortens checkout flows, and underpins trusted instant transfers—fostering a network effect that intensifies daily wallet usage. Listing in the EU’s official electronic-ID journal also positions BankID to enable cross-border wallet acceptance, a prospect likely to bolster the Sweden mobile payments market during 2025-2027.2Biometric Update, “Can BankID Spread its Footprint Outside of the Nordics?” biometricupdate.com
High contactless & smartphone penetration
In 2024, 51% of Swedes used a mobile phone for in-store payments.3Sveriges Riksbank, “Payments Report 2025,” riksbank.se Nearly all new phones embed NFC, and merchant card terminals already support tap-to-phone acceptance, creating a dual-use environment that lowers incremental hardware spend. Fifth-generation network coverage further guarantees low-latency processing, reinforcing consumer confidence at checkout.
Government push toward a cash-less society
The Payment Services Act balances cash access with incentives for digital alternatives, pushing cash to only 10% of 2024 in-store purchases. Exploration of the e-krona reinforces commitment to digital sovereignty while recent civil-defence guidance on modest cash reserves highlights the need for resilient offline capabilities.
Rapid migration by SMEs to Swish QR for PoS
A 2025 Riksbank survey showed that 50% of small firms prefer immediate account credits via Swish QR, especially in hospitality and personal services. Eliminating monthly terminal rental and reducing interchange charges improve cost structures and facilitate integrated cash-flow analytics, spurring stickiness.
Restraints Impact Analysis*
| Restraint | (~) % Impact on CAGR Forecast | Geographic Relevance | Impact Timeline |
|---|---|---|---|
| Fraud & social-engineering incidents rising | -3.4% | National, with higher impact in urban areas | Short term (≤ 2 years) |
| Strict interchange-fee caps compress margins | -2.2% | National, with EU regulatory influence | Medium term (2-4 years) |
| Ageing-population digital-exclusion gap | -1.4% | National, with higher impact in rural areas | Long term (≥ 4 years) |
| Fin-tech tax-reporting compliance burden | -0.8% | National, with cross-border implications | Medium term (2-4 years) |
| Source: Mordor Intelligence | |||
Fraud & social-engineering incidents rising
In 2024, 15% of Swedes experienced payment fraud, costing the wider Nordic region EUR 828 million (USD 890 million) and prompting banks to reimburse victims. New safeguards—delayed disbursements, secondary authorisation, and transaction caps—add friction that could slow adoption, but they also re-balance liability, compelling providers to harden authentication flows.
Strict interchange-fee caps compress margins
EU-wide fee ceilings squeeze issuer and acquirer revenue, challenging start-ups lacking diversified income streams. Providers have responded by layering subscription-based analytics and embedded financing, yet the margin reset could temper near-term investment in advanced wallet features.4Danmarks Nationalbank, “The Digital Retail Payment Market is Changing,” nationalbanken.dk
*Our forecasts treat driver/restraint impacts as directional, not additive. The impact forecasts reflect baseline growth, mix effects, and variable interactions.
Segment Analysis
By Payment Type: Proximity Solutions Extend First-Mover Advantage
Proximity payments accounted for 68.05% of Sweden mobile payments market in 2024 as tap-to-pay acceptance in grocery, transit, and quick-service restaurants became ubiquitous. The Digital Markets Act requirement that mobile-wallet providers gain equal NFC access removes historical gate-keeping, creating a more competitive field that should keep transaction fees low while accelerating merchant adoption. As cash circulation continues to fall, merchants cite cost savings from fewer cash reconciliations and lower shrinkage among chief reasons for the shift, reinforcing the Sweden mobile payments market’s network externalities.
Remote payments hold a smaller share today yet will outpace overall growth with a 34.20% CAGR through 2030 as mobile commerce expands and biometric-enabled web checkouts mature. The integration of BankID with e-commerce gateways offers stronger fraud protection relative to card-on-file methods and should draw risk-averse shoppers. Converged “shop-and-collect” journeys tap both proximity and remote rails, illustrating how wallet ecosystems can monetise across channels and add depth to Sweden mobile payments market size forecasts.


By Transaction Type: In-store PoS Commands Scale; P2P Spreads to P2M
In-store PoS transactions delivered 44.22% of Sweden mobile payments market size in 2024, driven by Swish QR codes replacing cash tills among food-service operators and salons. Integrated loyalty benefits and inventory linkages are turning PoS systems into broader business-management hubs, raising switching costs for merchants. Security fears motivate the 70% of shops that still accept cash to steer customers toward digital alternatives, a trend that ultimately supports wider wallet penetration.
Peer-to-peer volumes are expected to clock a 32.50% CAGR through 2030 as Swish becomes the default mechanism for shared bill payments, micro-commerce, and marketplace settlements. The line between P2P and merchant receiving is blurring, giving small traders low-cost access to electronic payments while fuelling further wallet activity. Expansion of instant transfer limits under the Instant Payments Regulation should reinforce this momentum inside the Sweden mobile payments market.
By Application: Transport Dominates Today; Retail & e-Commerce Accelerate
Transportation and logistics applications generated 55.06% of 2024 revenues, illustrating how daily commuting creates habitual wallet use. Mobile ticketing in metros and regional rail slashes boarding times and cuts paper-ticket overheads, while ride-share integration secures routine, high-frequency transactions that underpin Sweden mobile payments market share leadership in this domain.
Retail & e-commerce will surge at a 35.04% CAGR to 2030, reflecting 77% online-shopping penetration and average digital spend of EUR 2,110 (USD 2,270) per capita. One-click wallet buttons and biometric login grow conversion metrics for merchants and open upsell avenues such as buy-now-pay-later add-ons. Hospitality and government fee collection provide incremental volume, rounding out a diversified demand base that strengthens the overall Sweden mobile payments market.

By End-user: Personal Usage Mature; Business Uptake Surges
Personal users retained an 80.12% foothold in 2024, cemented by 8.6 million BankID holders and everyday reliance on Swish for split dinners and marketplace sales. Added lifestyle utilities like receipt archiving and budgeting widgets heighten stickiness, although digital exclusion among seniors remains a drag on uniform penetration.
Business adoption is forecast to climb at a 31.07% CAGR through 2030, making enterprises the swing factor in Sweden mobile payments market growth dynamics. SMEs reap immediate liquidity benefits from instant account settlements, while data-rich dashboards inform staffing and procurement decisions. Sectoral clustering is pronounced—restaurants, beauty, and gig services are early movers—yet government e-invoicing mandates are likely to spread mobile workflows across additional verticals.
Geography Analysis
Stockholm, Gothenburg, and Malmö form the core of wallet activity, each exhibiting greater than 90% smartphone penetration and dense clusters of NFC-enabled merchants. These metros host pilot rollouts for new features such as in-app commuting passes, allowing providers to refine UX before scaling nationwide. High student populations and technology employers promote early adoption, multiplying network effects that favour the Sweden mobile payments market.
Rural counties display slower uptake due to older demographics and patchier card-terminal coverage. To minimise geographic disparities, the Riksbank funds digital-literacy programs and incentivises local shops to install QR acceptance, narrowing the inclusion gap. Government social-benefit disbursements through mobile wallets also furnish rural residents with compelling use cases, gradually elevating baseline usage.
Border regions with Finland and Norway post above-average cross-wallet activity as EMPSA interoperability trials unlock seamless kroner-to-euro transfers. Tourist hotspots however still lean on conventional card rails to cater to visitors lacking Swedish apps. Meanwhile, civil-defence guidance to retain modest cash reserves has prompted some municipalities to safeguard offline card functions, a policy affecting wallet providers competing for public-sector contracts. Together, these regional nuances underline the varied adoption pathways feeding overall Sweden mobile payments market expansion.
Competitive Landscape
The Sweden mobile payments market is moderately concentrated, with the top seven platforms capturing roughly 75% of annual volume. Getswish AB’s Swish leverages its 12-bank consortium backing to process 2.5 million payments daily. Klarna strengthens its ecosystem through instalment financing and data analytics, although its sale of Klarna Checkout indicates a pivot toward differentiated services. Trustly targets account-to-account flows, complementing Swish in the B2B and cross-border arenas.
Incumbent banks such as SEB and Nordea embrace open APIs to integrate fintech features, balancing regulatory compliance with rapid iteration. Payment processors Bambora and Zettle embed mobile acquirer capabilities within SME software suites, tying hardware, invoicing, and analytics into a single proposition. Niche players like Fidesmo address wearables and tokenised card issuance, expanding form-factor diversity.
Regulation continues to shape strategy. The Instant Payments Regulation forces equal pricing on instant transfers, compressing fee margins yet broadening addressable volume. Riksbank mandates on offline card readiness require fresh investment in resilient infrastructures by July 2026. Providers are therefore reallocating R&D budgets toward redundancy features while experimenting with ancillary revenue—sustainability dashboards, SME credit scoring, and embedded insurance—to offset margin dilution in the Sweden mobile payments market.
Sweden Mobile Payments Industry Leaders
Swish (Getswish AB)
PayPal Holdings Inc.
Apple Inc. (Apple Pay)
Samsung Electronics Co. Ltd (Samsung Pay)
Klarna Bank AB
- *Disclaimer: Major Players sorted in no particular order

Recent Industry Developments
- March 2025: Riksbank announced its focus on enhancing offline payment capabilities by card to ensure functionality during major data communication disruptions, mandating implementation by Jul 1, 2026.
- February 2025: Trustly and Kivra formed a strategic partnership to enhance digital payment solutions in Sweden, aiming to increase mobile payment adoption among consumers.
- February 2025: BankID announced plans to expand its services beyond the Nordics, having listed itself in the EU’s official journal for electronic identification.
- December 2024: The European Commission adopted the Instant Payments Regulation, mandating that payment service providers offer instant credit transfers at no higher cost than regular transfers.


Research Methodology Framework and Report Scope
Market Definitions and Key Coverage
Our study defines Sweden's mobile payment market as all domestic, consumer-initiated proximity and remote transactions that are authorized, cleared, and settled through app-based wallets, NFC tap-to-pay services, QR codes, or account-to-account rails that run on a mobile device. Value is captured as merchant and peer-facing fees plus embedded service charges, expressed in USD terms and tied to spend executed inside Sweden in the study year.
Scope Exclusion: Carrier-billed airtime top-ups, cryptocurrency transfers, and pure card-not-present gateway revenues sit outside this scope.
Segmentation Overview
- By Payment Type
- Proximity Payments
- Remote Payments
- By Transaction Type
- Peer-to-Peer (P2P)
- In-store Point-of-Sale (POS)
- Person-to-Merchant (P2M/Checkout)
- Other Transaction Types
- By Application
- Retail and eCommerce
- Transportation and Logistics
- Hospitality and Food-Service
- Government and Public Sector
- Other Applications (Education, Healthcare)
- By End-user
- Personal
- Business
Detailed Research Methodology and Data Validation
Primary Research
Mordor analysts conducted semi-structured interviews with Swedish acquirers, fintech founders, and merchant groups across Stockholm, Gothenburg, and rural Gavleborg. These conversations clarified take rates, offline acceptance hurdles, and upcoming BankID specification changes, allowing us to validate desk findings and fine-tune penetration assumptions.
Desk Research
We began with publicly available tier-one data sets, Riksbank payments surveys, Eurostat ICT statistics, and the Swedish Trade Federation's retail turnover tables, because they ground yearly transaction counts and average spend. Company filings from Getswish AB and Klarna Bank AB, Visa and Mastercard interchange releases, and press releases by Apple Pay provided wallet adoption curves and fee benchmarks. Industry associations such as the European Payments Council and The Nordic Payments Council supply rule-making timelines that shape volume ramps. Select paid databases, notably Dow Jones Factiva for news flows and D&B Hoovers for revenue splits, filled financial gaps. This list is illustrative; many further sources were checked to corroborate every datapoint.
Market-Sizing & Forecasting
A top-down reconstruction starts with total retail and P2P spend, then applies mobile payment penetration by channel and ticket size. Select bottom-up cross-checks, sampled Swish, Apple Pay, and Klarna wallet volumes multiplied by headline fees, help recalibrate totals. Key inputs include smartphone penetration, contactless-enabled POS share, BankID authentication counts, e-commerce sales, and Riksbank instant rail statistics. Forecasts use multivariate regression where smartphone saturation, POS enablement, and e-commerce value act as drivers; scenario analysis adjusts for regulatory fee caps and offline rule rollouts. Gaps in bottom-up player data are bridged through merchant-weighted averages endorsed by interviewed experts.
Data Validation & Update Cycle
Model outputs pass three reviews: variance checks against Riksbank micro-series, peer comparisons, and senior analyst sign-off. Our numbers refresh annually, with interim sweeps when material events, fee cap rulings or new rail launches, shift underlying variables.
Why Mordor's Sweden Mobile Payments Baseline Earns Decision-Maker Trust
Published estimates differ because firms vary in what they measure; some tally gross transaction value, others count provider revenue, and many refresh data on uneven cadences.
Key gap drivers include divergent scope (for example, Global Consultancy A folds in card turnover, inflating its 2024 size to USD 27.5 billion), contrasting base case scenarios (Regional Consultancy B assumes universal NFC acceptance from 2026, lifting its 2023 value to USD 0.26 billion), and currency conversion timing. Mordor reports only provider-side revenue, applies mid-year SEK-USD rates, and updates each variable yearly, keeping figures comparable and current.
Benchmark comparison
| Market Size | Anonymized source | Primary gap driver |
|---|---|---|
| USD 0.38 billion (2025) | Mordor Intelligence | - |
| USD 27.5 billion (2024) | Global Consultancy A | Measures total transaction value and includes card-not-present flows |
| USD 0.26 billion (2023) | Regional Consultancy B | Assumes nationwide NFC coverage and uses historic SEK-USD average |
These contrasts show that when scope is tightly defined, variables are transparent, and refresh cadence is disciplined, Mordor's baseline offers stakeholders a balanced, reproducible foundation for strategy and investment decisions.


Key Questions Answered in the Report
What is the current value of the Sweden mobile payments market?
The market stands at USD 0.38 billion in 2025 and is projected to reach USD 1.29 billion by 2030.
Which segment holds the largest Sweden mobile payments market share?
Proximity payments led with 68.05% share in 2024, driven by ubiquitous NFC infrastructure.
How fast are peer-to-peer transfers growing?
Peer-to-peer transactions are expected to post a 32.50% CAGR between 2025 and 2030, outpacing other transaction types.
Why is BankID important for mobile payments?
BankID delivers a national, trusted ID layer that processed 7.6 billion authentications in 2024, removing verification friction and supporting instant transfers.
What regulatory changes will affect providers by 2027?
The Instant Payments Regulation enforces cost-parity for instant transfers, while Riksbank’s offline-capability mandate requires providers to ensure card functionality during network outages by July 2026.
Which geographic regions in Sweden lag in adoption?
Rural areas show lower wallet usage due to older demographics and fewer accepting merchants, prompting targeted inclusion initiatives by the Riksbank.
Page last updated on:


