Market Overview
| Study Period | 2020 - 2031 |
|---|---|
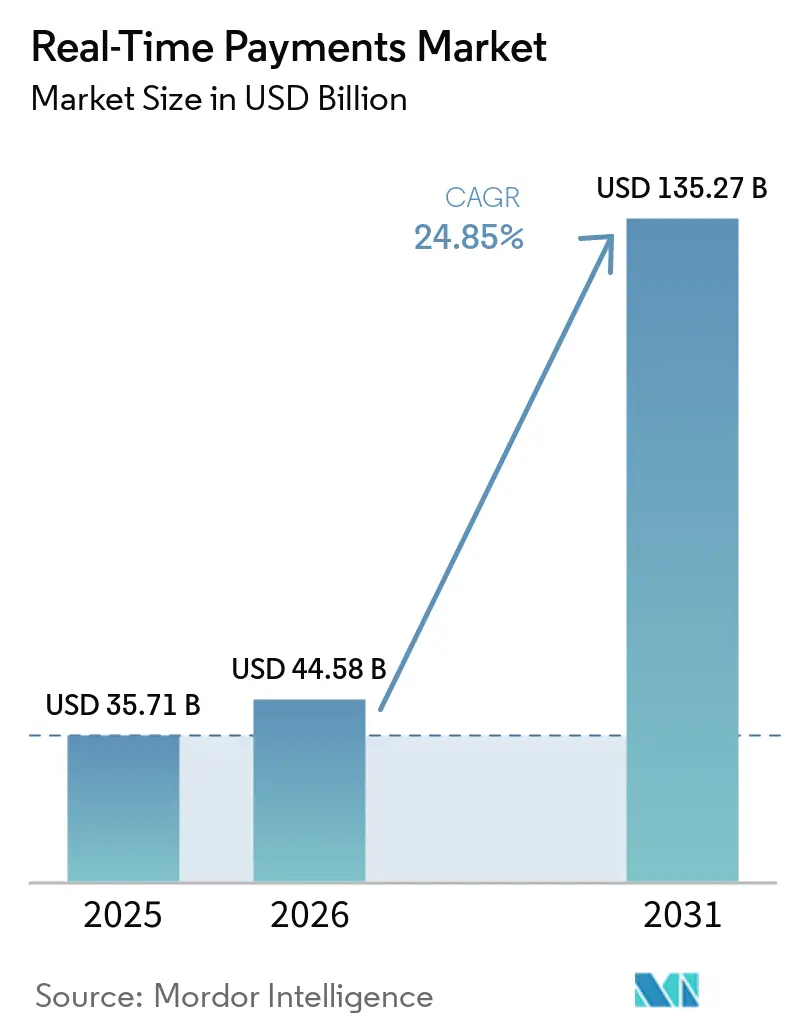
| Market Size (2026) | USD 44.58 Billion |
| Market Size (2031) | USD 135.27 Billion |
| Growth Rate (2026 - 2031) | 24.85% CAGR |
| Fastest Growing Market | Asia-Pacific |
| Largest Market | North America |
| Market Concentration | Medium |
Major Players *Disclaimer: Major Players sorted in no particular order Image © Mordor Intelligence. Reuse requires attribution under CC BY 4.0. | |
Real-Time Payments Market Analysis by Mordor Intelligence
Real Time Payments market size in 2026 is estimated at USD 44.58 billion, growing from 2025 value of USD 35.71 billion with 2031 projections showing USD 135.27 billion, growing at 24.85% CAGR over 2026-2031. Surging adoption originates from regulatory mandates, the November 2025 ISO 20022 deadline, and customer demand for instantaneous settlement across retail, payroll, and bill-payment workflows. In North America, the FedNow rail welcomed 1,300 institutions by April 2025 and processed 1.31 million transactions worth USD 48.6 billion during Q1 2025, underscoring strong network effects.[1]Federal Reserve Bank Services, “FedNow Service: 2025 First-Quarter Statistics,” frbservices.org Europe’s Instant Payments Regulation, effective January 2025, requires 24/7 euro-zone coverage, accelerating bank technology investment.[2]European Commission, “Instant Payments: Regulation (EU) 2021/1230,” ec.europa.eu Asia-Pacific’s momentum is reinforced by India’s UPI expansion into additional corridors and Singapore’s Project Nexus, while Brazil’s PIX processed 42 billion transactions worth BRL 17.2 trillion (USD 3.44 trillion) in 2023, highlighting the scale benefits of government-sponsored schemes.
Key Report Takeaways
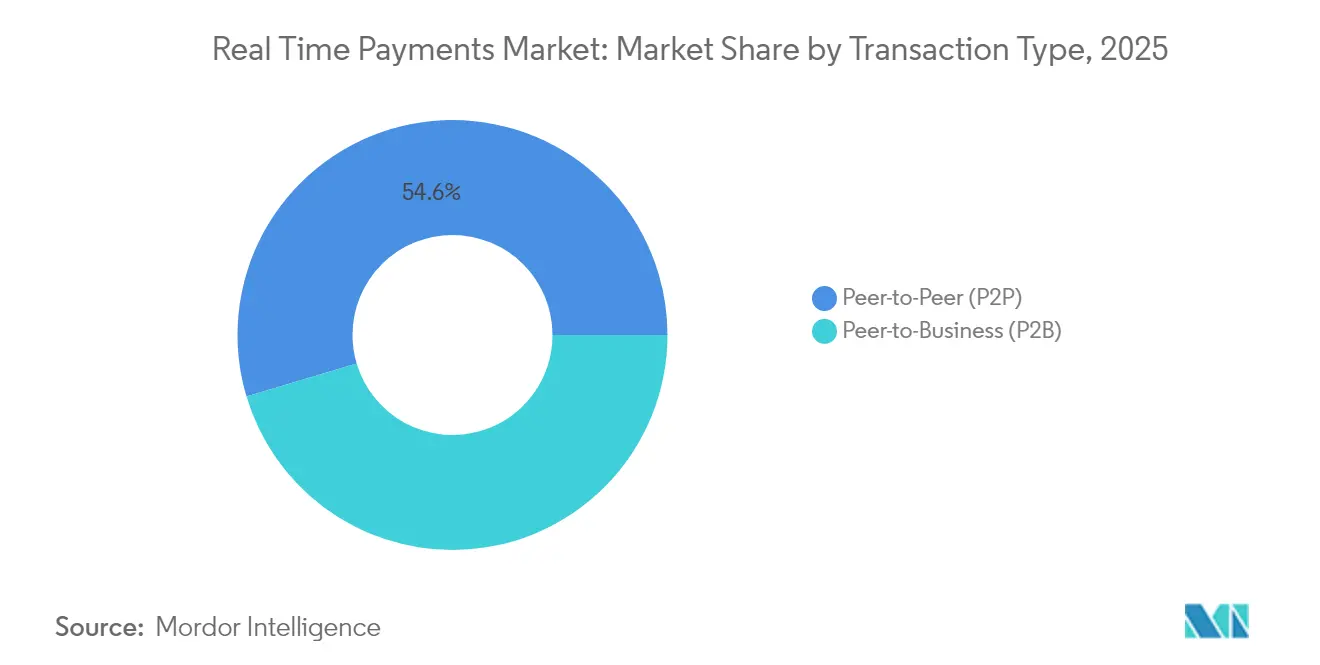
- By transaction type, peer-to-peer transfers led with 54.62% of the Real Time Payments market share in 2025; peer-to-business transfers are projected to expand at a 27.55% CAGR to 2031.
- By component, platform & solution deployments captured 74.95% revenue in 2025, whereas services exhibit the fastest growth at 28.05% CAGR through 2031.
- By deployment mode, cloud deployment accounted for 62.12% of the Real Time Payments market size in 2025 and advances at a 26.35% CAGR through 2031.
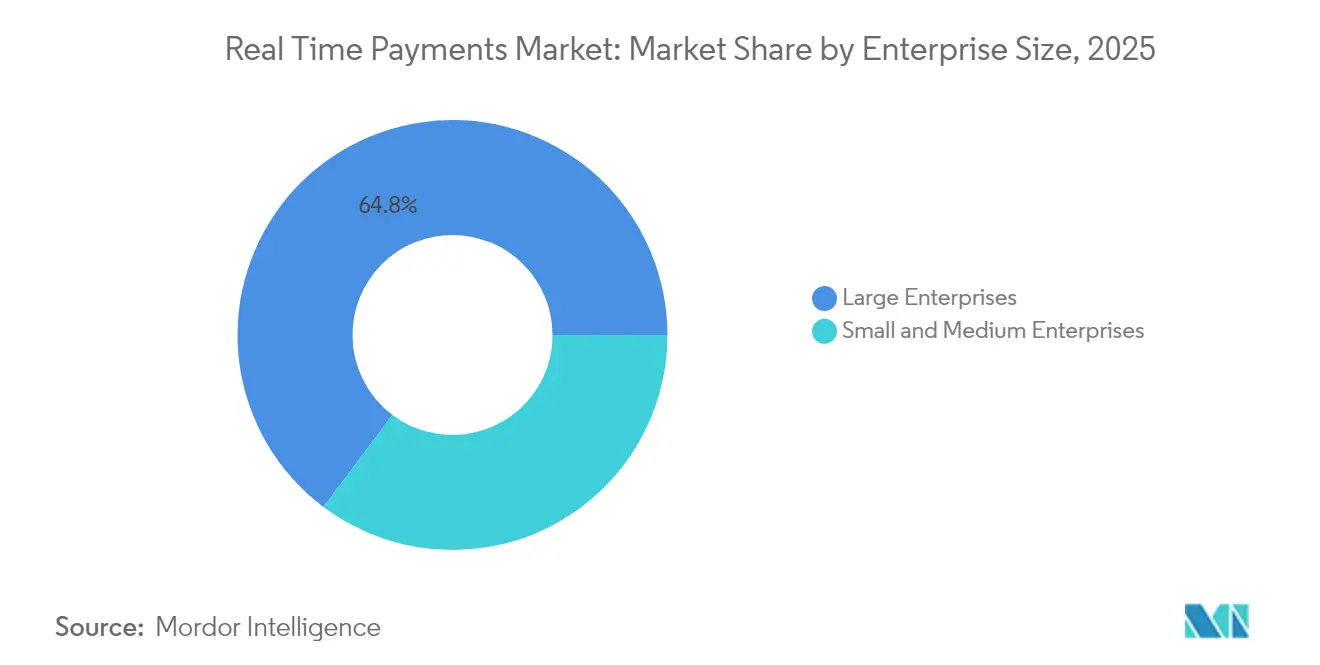
- By enterprise size, large enterprises held 64.75% of 2025 revenue, while SME adoption is growing at a 29.85% CAGR through 2031.
- By end-user industry, banking & financial services commanded 40.55% revenue in 2025; retail & e-commerce is the fastest mover at a 30.15% CAGR to 2031.
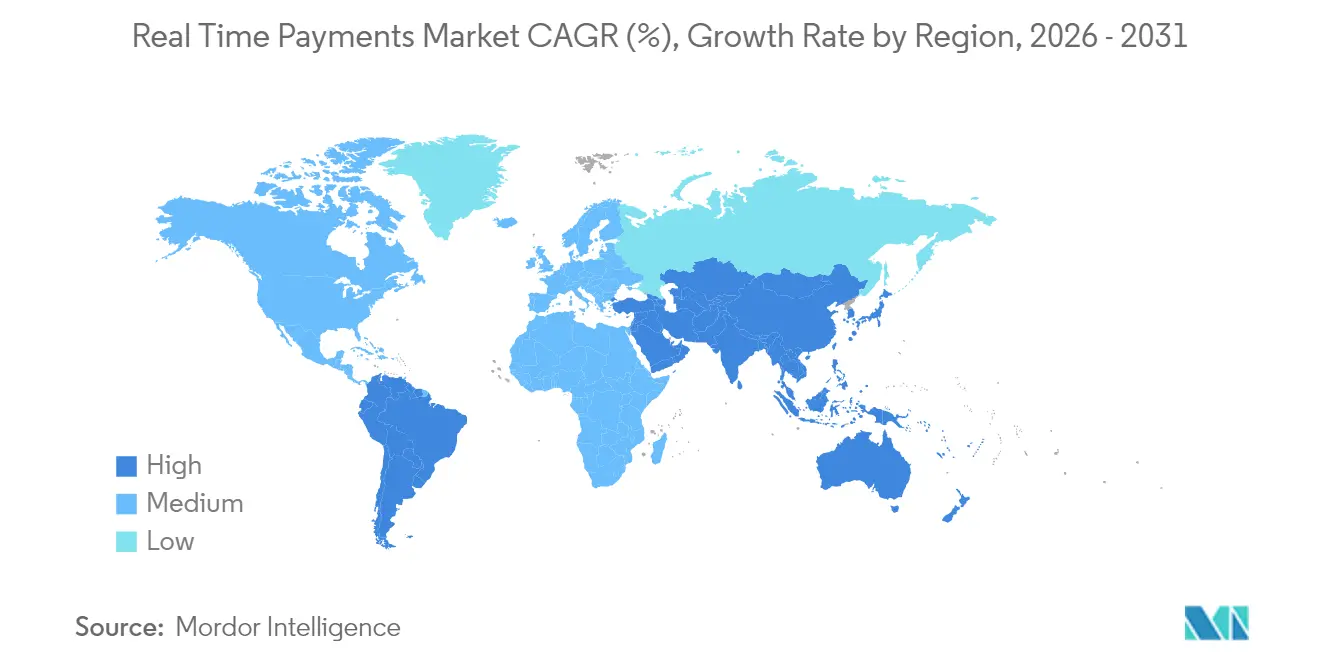
- By geography, North America led with 37.72% revenue share in 2025; Asia-Pacific is the fastest-growing region at a 28.1% CAGR.
Note: Market size and forecast figures in this report are generated using Mordor Intelligence’s proprietary estimation framework, updated with the latest available data and insights as of 2026.
Global Real-Time Payments Market Trends and Insights
Drivers Impact Analysis*
| Driver | (~) % Impact on CAGR Forecast | Geographic Relevance | Impact Timeline |
|---|---|---|---|
| Proliferation of ISO 20022-enabled domestic rails in Europe & Asia-Pacific | +4.2% | Europe, Asia-Pacific | Medium term (2-4 years) |
| Expansion of FedNow & upcoming PIX 2.0 accelerating adoption in the Americas | +3.8% | North America, South America | Short term (≤ 2 years) |
| Real-time payroll and earned-wage access (EWA) demand among U.S. gig workers | +2.1% | North America | Short term (≤ 2 years) |
| BNPL players shifting to RTP for instant merchant settlement in Europe | +1.9% | Europe, North America | Medium term (2-4 years) |
| Government mandates for instant salary & welfare disbursement in GCC countries | +1.7% | Middle East | Long term (≥ 4 years) |
| Surging cross-border RTP corridors via RippleNet & Visa Direct | +3.1% | Global | Medium term (2-4 years) |
| Source: Mordor Intelligence | |||
ISO 20022 migration accelerates infrastructure modernization
The November 2025 ISO 20022 deadline compels banks to update messaging and processing engines simultaneously, making real-time payment rail adoption the most cost-efficient compliance path. SWIFT notes that 32.9% of cross-border messages already ride ISO 20022, up six percentage points in Q4 2024.[3]SWIFT, “ISO 20022 Migration Tracker 2025,” swift.com Richer data payloads improve sanctions screening, and Deutsche Bank showcases real-time compliance benefits for corporates. The looming end of the coexistence period forces institutions to avoid dual-system overhead. Community banks mitigate capability gaps by outsourcing to third-party processors that bundle ISO 20022 translation with instant-payment connectivity.
FedNow expansion drives Americas market leadership
FedNow’s network effects were evident with a 43.1% quarterly volume spike in Q1 2025 and a 140.8% value leap, signalling widening commercial use cases. The Federal Reserve’s ambition to onboard 8,000 institutions positions the rail for nationwide ubiquity. In parallel, Brazil’s PIX 2.0 will introduce recurring and instalment capabilities in September 2025, showing how mature systems evolve into multifunction platforms. Combined, these initiatives set cross-continental performance benchmarks that other markets emulate.
Earned-wage access transforms payroll economics
California’s February 2025 rules finally classify earned-wage access (EWA) as regulated consumer credit, removing legal uncertainty and enabling national payroll providers to scale offerings. The CFPB’s interpretive proposal may extend harmonized oversight, creating a predictable framework for nationwide deployment. EWA relies on instant rails for competitive differentiation, linking liquidity needs of gig workers with bank revenue prospects from high-frequency payouts. This mutual dependence rapidly intensifies Real Time Payments market adoption among payroll processors and employers.
Cross-border RTP corridors reshape international payments
India’s UPI already facilitates payments in seven foreign markets and targets up to six more during 2025, deepening diaspora-driven remittance corridors. Singapore’s Project Nexus interlinks Thai, Indonesian, and Malaysian instant systems, proving the viability of multilateral settlement hubs. Visa Direct’s one-minute US-recipient guarantee, effective April 2025, elevates consumer expectations for speed in remittances. These developments collectively push account-to-account cross-border transfer volumes away from traditional correspondent networks.
Restraints Impact Analysis*
| Restraint | (~) % Impact on CAGR Forecast | Geographic Relevance | Impact Timeline |
|---|---|---|---|
| Fragmented fraud-monitoring standards across RTP schemes | -2.3% | Global | Short term (≤ 2 years) |
| Legacy core-bank modernization backlog in Tier-2 Asian banks | -1.8% | Asia-Pacific | Medium term (2-4 years) |
| Interoperability gaps between card tokenization and account-to-account rails | -1.4% | Global | Medium term (2-4 years) |
| Merchant surcharge regulation uncertainty in the U.S. | -0.9% | North America | Short term (≤ 2 years) |
| Source: Mordor Intelligence | |||
Fraud monitoring complexity constrains adoption velocity
Verification-of-Payee frameworks differ across schemes, obliging banks to invest in separate rule sets for FedNow, PIX, and SEPA Instant. ACI Worldwide’s European PoC with Banfico illustrates workaround partnerships to meet the EU’s October 2025 compliance deadline. Visa’s Featurespace acquisition underscores the capital-intensive nature of AI-based instant fraud detection. Smaller institutions face operational strain from parallel systems, slowing onboarding to multiple networks.
Legacy infrastructure modernization challenges
Tier-2 Asian banks grapple with real-time processing demands that exceed batch-oriented cores. The BIS reports that success hinges on central-bank leadership and non-bank participant inclusion, yet many regional banks lack the capex to upgrade swiftly. Japan’s push toward a 40% cashless ratio by 2025 elevates compliance urgency, but fragmented vendor landscapes prolong replacement cycles. Third-party hosted cores offer relief, although integration projects stretch internal resources.
*Our forecasts treat driver/restraint impacts as directional, not additive. The impact forecasts reflect baseline growth, mix effects, and variable interactions.
Segment Analysis
By Transaction Type: P2P Dominance Meets B2B Acceleration
Peer-to-peer transfers accounted for 54.62% of Real Time Payments market revenue in 2025, underscoring widespread consumer adoption. Business-driven flows now outpace personal transfers, with peer-to-business transactions growing 27.55% annually as instant payroll disbursements and merchant settlement take hold. FedNow’s early corporate pilots in payroll and supplier payments highlight this pivot, signalling that working-capital benefits resonate with finance executives. Business-to-business adoption remains in early stages but promises the largest addressable pool, given ACH’s multi-day settlement drag. Consumer-to-business flows gain momentum where buy-now-pay-later (BNPL) providers embed account-to-account settlement to minimise interchange costs. Brazil’s PIX demonstrates this migration, with e-commerce merchants projected to book USD 30 billion in instant-payment turnover during 2025. Government-to-person mandates across GCC economies create a new baseline expectation for 24/7 disbursement, cementing instant infrastructure as a public-service standard.
Real-time salary advances reshape payroll economics, enlarging transaction frequency rather than ticket size, thus increasing absolute rail volume. Corporates synchronise treasury and AP processes, shifting from weekly payment runs to on-demand pushes. Cross-border organisations leverage bilateral links such as UPI-PayNow to shorten supplier settlement cycles in Southeast Asia. Market platforms introduce split-payment models that route commission and principal amounts simultaneously, removing reconciliation delays. These combined use cases reinforce the Real Time Payments market as indispensable for liquidity optimisation.


By Component: Platform Investments Drive Service Demand
Platform & solution spending captured 74.95% of 2025 revenue, signalling that banks favour holistic overhauls versus tactical bolt-ons. ISO 20022 migration serves as the triggering event, since message translation, fraud analysis, and API orchestration are most efficient on unified stacks. Yet service revenue rises 28.05% annually, reflecting heavy reliance on specialist integrators for phased rollout. Consulting engagements cover readiness assessments, roadmap design, and regulatory gap analysis. Institutions outsource managed services for SLAs covering 24/7 uptime, ensuring compliance while containing headcount. Integration partners such as ACI Worldwide logged 42% software-segment growth in Q1 2025, proving that combinational platform-plus-professional-services deals resonate with mid-tier institutions.
Over the forecast period, middleware capable of orchestrating real-time and batch flows side-by-side becomes critical. Hybrid-cloud orchestrators with containerised microservices enable progressive decoupling from legacy cores. This architecture allows banks to retire mainframe modules gradually while front-ending customers with instant-payment APIs. Training programmes address the operational culture shift to continuous settlement and real-time liquidity monitoring.
By Deployment Mode: Cloud Acceleration Transforms Infrastructure
Cloud-hosted instances represented 62.12% of the Real Time Payments market size in 2025 and advance by 26.35% CAGR, as SaaS adoption removes capex barriers and compresses launch timelines. Elastic compute supports unpredictable peak loads typical of retail events and payroll runs. Vendors certify FedNow send/receive functionality on multi-tenant environments, simplifying upgrades. On-premise deployments persist among Tier-1 banks committed to data-centre amortisation and jurisdictional data-sovereignty rules. Hybrid architectures emerge, keeping sensitive ledgers local yet outsourcing orchestration and fraud-scoring to public clouds. Edge deployments appeal to capital-markets arms seeking sub-millisecond round-trip SOR (source-of-record) updates.
Regional regulations shape design decisions: EU-based institutions weigh GAIA-X-aligned clouds, while US banks adopt private-cloud FedRAMP configurations. FIS’s FedNow send certification showcases how cloud-native cores can extend instant functionality across thousands of community banks simultaneously, proving the scalability economics of the model.
By Enterprise Size: SME Adoption Accelerates Through Simplified Access
Large enterprises held 64.75% of Real Time Payments market revenue in 2025, yet the SME segment now compounds at 29.85% annually. Fintech gateways publish no-code connectors that embed real-time payouts into ERP suites, slashing integration cost. The Faster Payments Council finds that up to 40% of U.S. banks expect to enable outbound instant credits by 2028, guaranteeing SME reach. In Brazil, 15 million merchants were live on PIX by March 2024, demonstrating viral uptake when onboarding is mobile-first. Subscription pricing aligns with SME cash-flow patterns, shifting costs from capex to predictable opex.
Mid-market companies appreciate the working-capital gains from just-in-time supplier payments. Earned-wage access providers bundle payroll APIs that automate employee onboarding, enabling even micro-employers to offer daily wage availability. Programmes targeting micro-exporters combine real-time settlement with foreign-exchange conversion, lowering friction for cross-border e-commerce sellers.
By End-User Industry: BFSI Leadership Faces Retail Disruption
Banks and financial institutions generated 40.55% of 2025 revenue as both processors and major users, yet their dominance erodes as merchant and platform ecosystems integrate direct RTP connectivity. Retail & e-commerce is projected to grow 30.15% annually, as instant settlement strips interchange cost and elevates checkout conversion. Walmart’s partnership with Fiserv epitomises merchant demand for alternatives to three-day card funding lags. Healthcare adoption escalates where insurers implement instant claim payouts, improving patient NPS scores and lowering paper cheque overhead. Utilities deploy RTP refunds to accelerate storm-related credit credits. Government agencies in GCC countries legislate instant salary and welfare disbursement, institutionalising infrastructure demand.
Fintech lenders leverage real-time payout and repayment to compress credit cycles, exploiting data visibility that instant rails provide. Insurance innovators test parametric micro-payouts within seconds of trigger events, such as flight delays or rainfall thresholds. Collectively, these vertical expansions broaden use-case diversity and insulate the Real Time Payments industry against single-sector volatility.
Geography Analysis
North America posted 37.72% revenue share in 2025, anchored by FedNow and The Clearing House RTP network maturity. Volume growth accelerates as regional banks join en masse, aided by packaged cloud connectors. Regulatory clarity on interchange treatment for instant debit pushes merchant adoption. Canada plans Real-Time Rail launch in 2026, which could open a USD-denominated cross-border corridor with the United States.
Asia-Pacific delivers the highest CAGR at 28.1% to 2031. India’s UPI handled 131 billion transactions worth INR 200 trillion (USD 2.4 trillion) in FY24, illustrating scale benefits of a government-backed open API model. Singapore’s Project Nexus presents a template for multi-country clearing, while Australia’s NPP finalises PayTo mandates, expanding business billing capabilities. Japan’s regional banks accelerate modernization to meet the national cashless-ratio target.
Europe’s mandatory 24/7 receiving requirement effective January 2025 induced a 27% instant-payment jump at Deutsche Bank that same month. Full send capability by October 2025 will drive further adoption yet may squeeze fee margins given regulation-imposed price caps. Nordic P27’s pause leaves SEPA Instant as the de-facto cross-border option inside Europe, pushing banks toward bilateral links with the UK’s FPS.
South America’s trajectory centres on PIX, now extending to instalment and offline modes that remove the last cash use-cases. Colombia, Chile, and Argentina examine replicating PIX’s public-private partnership structure. The Middle East experiences policy-driven growth where Saudi Arabia’s Sarie rail and the UAE’s IPP mandate instant salary credits for government workers. Africa witnesses mobile-money players integrating open-loop instant rails, blending wallet ubiquity with bank-grade clearing.

Competitive Landscape
The Real Time Payments market remains moderately fragmented but consolidates quickly. Visa and Mastercard leverage legacy card networks and tokenisation assets, evidenced by Visa’s 10% top-line lift to USD 9.5 billion in Q1 2025 and the Featurespace acquisition that upgrades AI fraud capacity. ACI Worldwide recorded 25% revenue growth, underpinned by end-to-end instant processing wins at CIMB Bank and community institutions. FIS repositions after acquiring Global Payments’ issuer arm for USD 13.5 billion, deepening issuer processing scale while divesting part of Worldpay to streamline focus.
Competitive advantage increasingly hinges on modularity, open APIs, and value-added data services. Providers offering ISO 20022 translation, dispute-management APIs, and overlay services such as Request-to-Pay command pricing premiums. Cross-border capability serves as the next battleground: Visa Direct’s one-minute benchmark compels rivals to match SLAs. Blockchain-powered settlement propositions from PayPal and RippleNet target lower-cost corridors; however, widespread uptake awaits clearer regulatory frameworks.
Regional government networks complicate market entry – UPI, PIX, and Sarie grant interoperability through open APIs but restrict levy potential, prompting vendors to monetise analytics, fraud, and treasury dashboards instead. Banks with legacy cores favour vendors supplying phased-migration playbooks, positioning Temenos, Finzly, and Alacriti as niche winners for smaller U.S. institutions. Overall, mergers will intensify as vendors seek portfolio breadth, particularly in risk analytics and cross-border orchestration.
Real-Time Payments Industry Leaders
ACI Worldwide Inc.
Fiserv Inc.
Paypal Holdings Inc.
Mastercard Inc.
Montran Corporation
- *Disclaimer: Major Players sorted in no particular order


Recent Industry Developments
- June 2025: PayPal unveiled plans to route PYUSD stablecoin settlements over the Stellar network, pursuing low-cost remittance corridors and expanding its reach beyond card-based checkout. The move enables PayPal to diversify funding sources and lock in crypto-centric customers.
- May 2025: CIMB Bank selected ACI to converge all account-to-account payment flows onto a single ISO-ready platform, aligning with the bank’s Forward30 plan to reach 70% digital transaction share. The deal demonstrates regional banks’ appetite for one-vendor stack consolidation.
- April 2025: FIS acquired Global Payments’ issuer unit for USD 13.5 billion and simultaneously divested part of Worldpay for USD 6.6 billion, signalling a pivot toward core processing scale while exiting commoditised acquiring.
- April 2025: Brazil’s central bank confirmed PIX instalment features for Sep 2025, aiming to erode credit-card revolving balances and lower consumer finance costs.


Research Methodology Framework and Report Scope
Market Definitions and Key Coverage
Mordor Intelligence defines real-time payments as inter-bank, electronically initiated transfers where funds are irrevocably moved and confirmation reaches sender and receiver within sixty seconds, operating 24 x 7 x 365. Coverage values the total fees, platform revenues, and ancillary software tied to P2P and P2B transactions processed on open-loop rails across all deployment modes and enterprise sizes.
Scope exclusion: closed-loop wallet balances and crypto-asset rails are not counted.
Segmentation Overview
- By Transaction Type
- Peer-to-Peer (P2P)
- Peer-to-Business (P2B)
- By Component
- Platform / Solution
- Services
- By Deployment Mode
- Cloud
- On-Premise
- By Enterprise Size
- Large Enterprises
- Small and Medium Enterprises
- By End-User Industry
- Retail and E-Commerce
- BFSI
- Utilities and Telecom
- Healthcare
- Government and Public Sector
- Other End-user Industries
- By Geography
- North America
- United States
- Canada
- Mexico
- Europe
- United Kingdom
- Germany
- France
- Spain
- Rest of Europe
- Asia-Pacific
- China
- India
- Japan
- South Korea
- Rest of Asia-Pacific
- South America
- Brazil
- Argentina
- Colombia
- Rest of South America
- Middle East
- United Arab Emirates
- Saudi Arabia
- Rest of Middle East
- Africa
- South Africa
- Nigeria
- Rest of Africa
- North America
Detailed Research Methodology and Data Validation
Primary Research
We interviewed payment-scheme operators, core-banking vendors, processor executives, treasury heads at retailers, and regional fintech associations across North America, Europe, Asia-Pacific, and Latin America. Those conversations validated real ticket sizes, interchange trajectories, and go-live pipelines, filling gaps left by public data and grounding model assumptions in practitioner experience.
Desk Research
Our analysts gathered foundational data from central-bank payment statistics (Federal Reserve, ECB, Banco Central do Brasil), industry rulebooks such as ISO 20022 and SEPA Inst, and trade-association dashboards (Swift RTP tracker, U.S. Faster Payments Council). Complementary insights came from BIS Red Book tables, IMF Financial Access Surveys, and patent searches via Questel to trace innovation in fraud mitigation modules. Company 10-Ks, investor decks, and press releases provided recent adoption metrics and pricing moves. Access to D&B Hoovers and Dow Jones Factiva enabled quick cross-checks of bank volume disclosures. This list is illustrative, not exhaustive, as many additional public and paid sources informed desk analysis.
Market-Sizing & Forecasting
The base year value flows from a top-down construct where domestic transaction volumes published by clearing houses are multiplied by blended fee yields, then reconciled with import-export of processing services and cloud migration rates. Bottom-up spot checks, sampled platform revenues, acquirer roll-ups, and SME penetration surveys tune the totals before sign-off. Key variables feeding the model include smartphone penetration, ISO 20022 migration status, fraud-loss ratios, average ticket size drift, and cloud-hosted node share. Five-year forecasts employ multivariate regression on those drivers, complemented by scenario analysis for regulatory shocks, with coefficients vetted by our primary research panel.
Data Validation & Update Cycle
Outputs undergo variance scans against independent metrics, peer review by a second analyst, and management review. Models refresh annually, with interim recalibration triggered by major scheme launches or fee-cap rulings. A final pass just before publication ensures clients receive the freshest view.
Why Mordor's Real-Time Payments Baseline Commands Reliability
Published estimates often diverge because firms mix closed-loop wallets, use dissimilar clearing fee assumptions, or apply outdated exchange rates.
Key gap drivers include differing inclusion of on-us transactions, one-time license revenues treated as recurring, and refresh cycles that lag new mandates like FedNow or the EU Instant Payments Regulation. Mordor's scope aligns strictly to open-loop rails and filters non-recurring revenues, while our annual refresh captures rapid scheme roll-outs.
Benchmark comparison
| Market Size | Anonymized source | Primary gap driver |
|---|---|---|
| USD 35.71 B (2025) | Mordor Intelligence | - |
| USD 24.91 B (2024) | Global Consultancy A | Excludes cloud-hosted service fees and counts only P2P flows |
| USD 23.02 B (2023) | Trade Journal B | Uses 2022 currency averages and omits cross-border RTP corridors |
These contrasts show how Mordor's disciplined scope selection, variable choice, and quicker refresh cadence yield a balanced, transparent baseline that decision-makers can trust.


Key Questions Answered in the Report
What is the projected size of the Real Time Payments market by 2031?
The Real Time Payments market is expected to reach USD 135.27 billion by 2031, expanding at a 24.85% CAGR from 2026.
Which region grows the fastest in real-time payments through 2031?
Asia-Pacific posts the strongest trajectory at 28.1% CAGR, driven by India’s UPI scale-up and multilateral projects like Singapore’s Project Nexus.
How are regulatory mandates influencing adoption?
Mandates such as the EU’s Instant Payments Regulation and the ISO 20022 November 2025 deadline require 24/7 availability and enriched messaging, prompting banks worldwide to accelerate platform upgrades.
What role does earned-wage access play in market growth?
EWA providers rely on instant rails for immediate salary disbursements; regulatory clarity in states like California underpins mainstream deployment, boosting transaction volumes.
Why is cloud deployment dominant?
Cloud models account for 62.12% of the 2025 Real Time Payments market size, offering elastic scalability and lower upfront investment, which align with 24/7 processing and rapid feature rollouts.
How are fraud concerns being addressed?
Major networks integrate AI-driven verification like Visa’s Featurespace acquisition, while regulators mandate verification-of-payee frameworks to curb authorised-push payment fraud.
Page last updated on:


