
Rare Neurological Disease Treatment Market Size and Share
Market Overview
| Study Period | 2022 - 2031 |
|---|---|
| Forecast Data Period | 2026 - 2031 |
| Market Size (2026) | USD 16.77 Billion |
| Market Size (2031) | USD 23.15 Billion |
| Growth Rate (2026 - 2031) | 6.66 % |
| Fastest Growing Market | Asia-Pacific |
| Largest Market | North America |
Major Players *Disclaimer: Major Players sorted in no particular order Image © Mordor Intelligence. Reuse requires attribution under CC BY 4.0. | |
Rare Neurological Disease Treatment Market Analysis by Mordor Intelligence
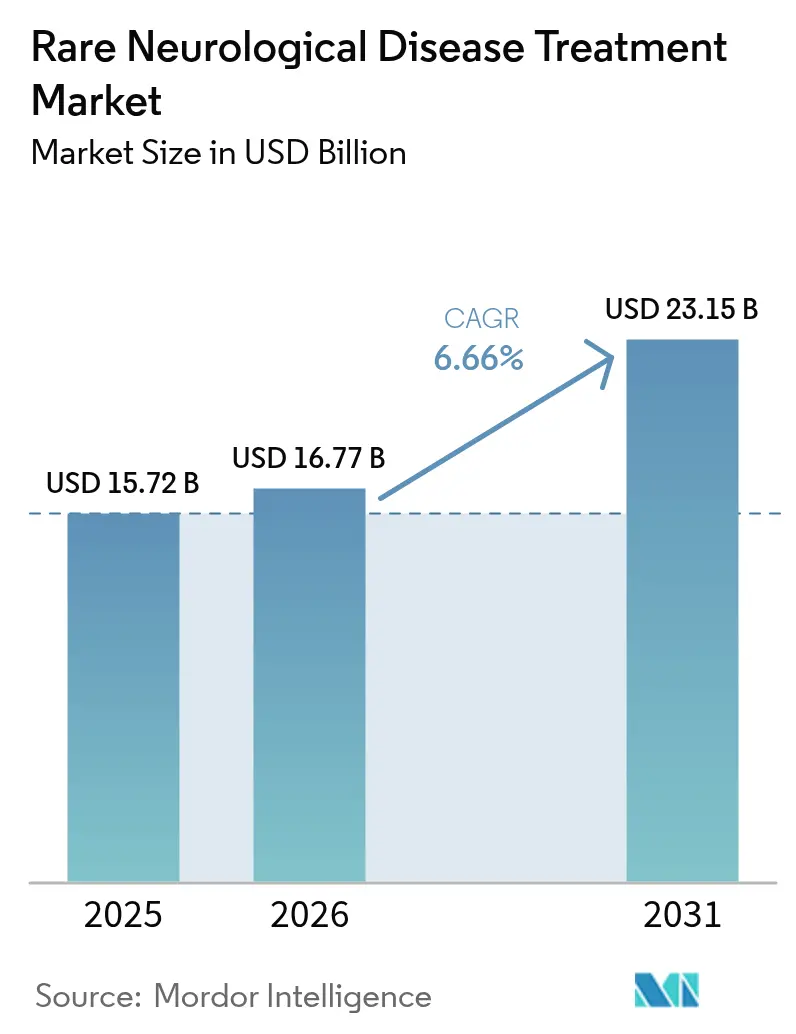
The rare neurological disease treatment market size is expected to grow from USD 15.72 billion in 2025 to USD 16.77 billion in 2026 and is forecast to reach USD 23.15 billion by 2031 at 6.66% CAGR over 2026-2031. A wave of gene-therapy approvals, rapid-cycle orphan-drug designations, and a surge of venture funding into ultra-rare CNS programs are the principal forces behind this upswing. Widespread maturation of RNA platforms, together with streamlined U.S. and EU regulatory pathways that cut average approval times by 18 months, further accelerates commercial timelines. Investors continue to reward validated platform technologies with premium valuations, driving consolidation among large pharmas and specialized biotechs. Geographically, North America leads adoption because of dense treatment-center networks and insurance coverage, while Asia-Pacific records the fastest uptake as governments embed rare-disease initiatives into national health strategies. Countervailing pressures include steep therapy prices, tight cold-chain requirements, and the ever-present hurdle of recruiting ultra-small patient cohorts.
Key Report Takeaways
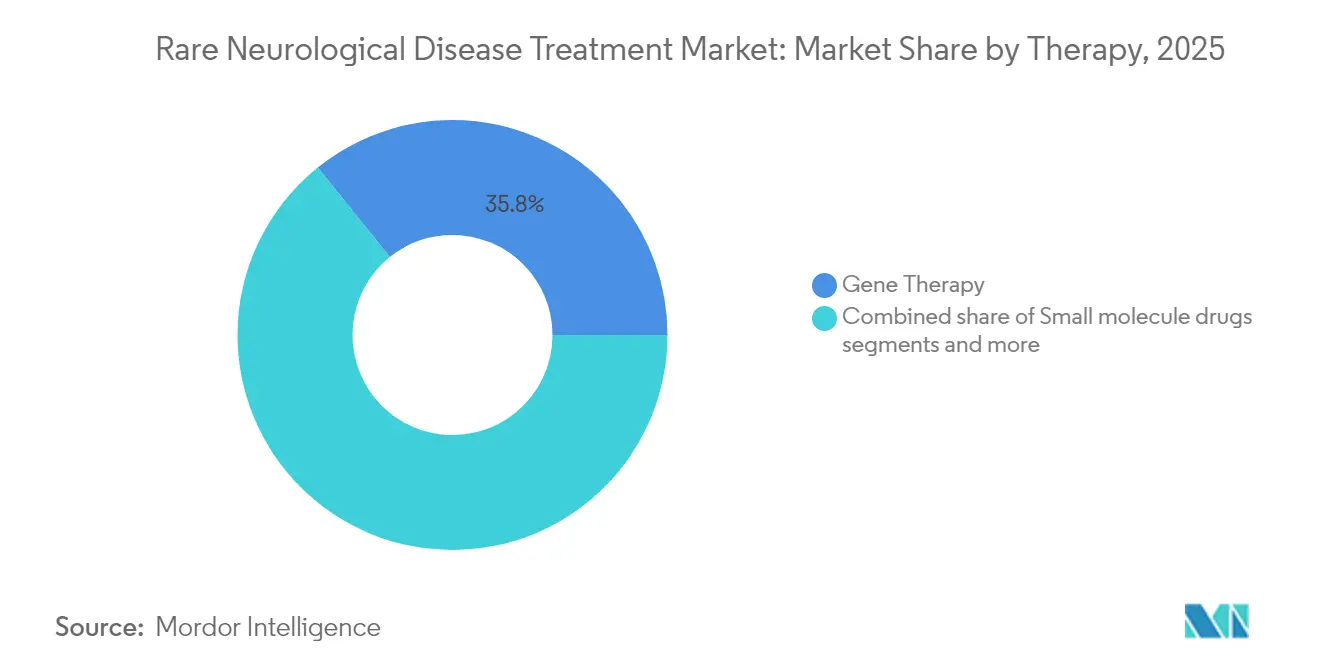
- Gene therapy held the largest share of all therapy types with 35.78% of the rare neurological disease market share in 2025, whereas RNA-based therapy posted the quickest expansion at a 7.12% CAGR through 2031.
- Spinal muscular atrophy accounted for 28.46% of the rare neurological disease market size in 2025, while Duchenne muscular dystrophy advanced at a 7.89% CAGR and remains the most rapidly growing indication.
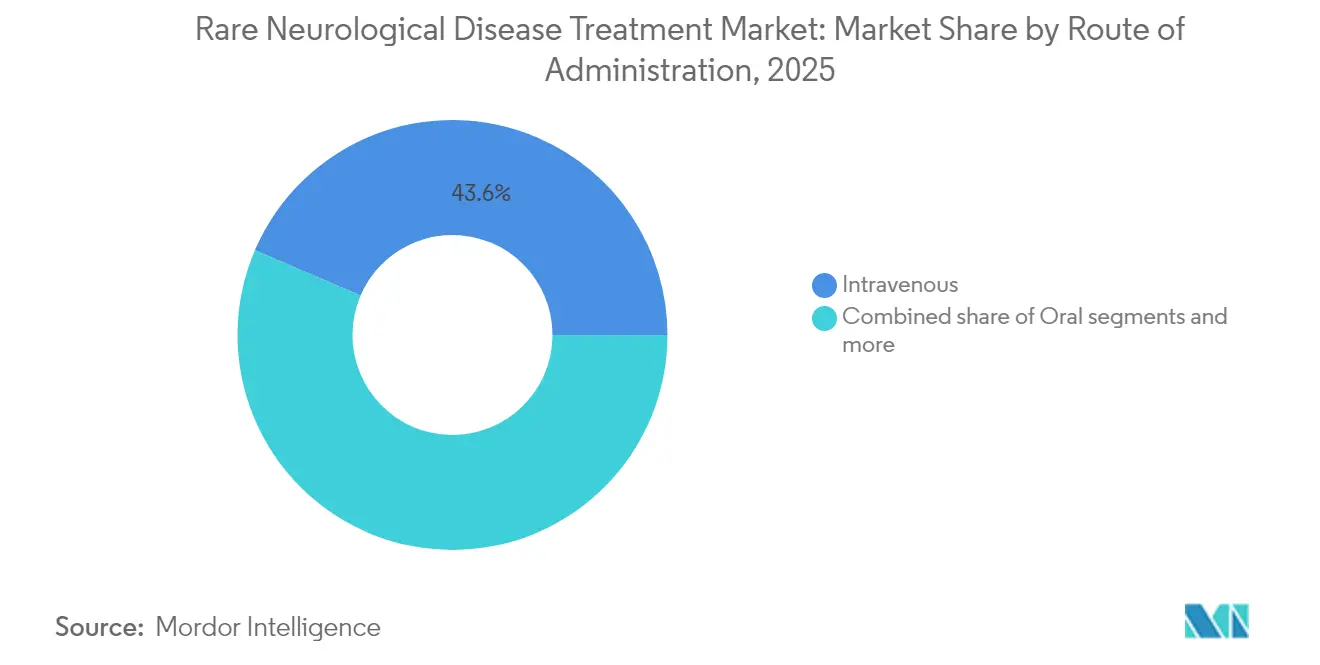
- Intravenous delivery led routes of administration with a 43.55% slice of the market in 2025; intrathecal, subcutaneous, and other emerging methods together are forecast to expand at an 8.39% CAGR over the outlook period.
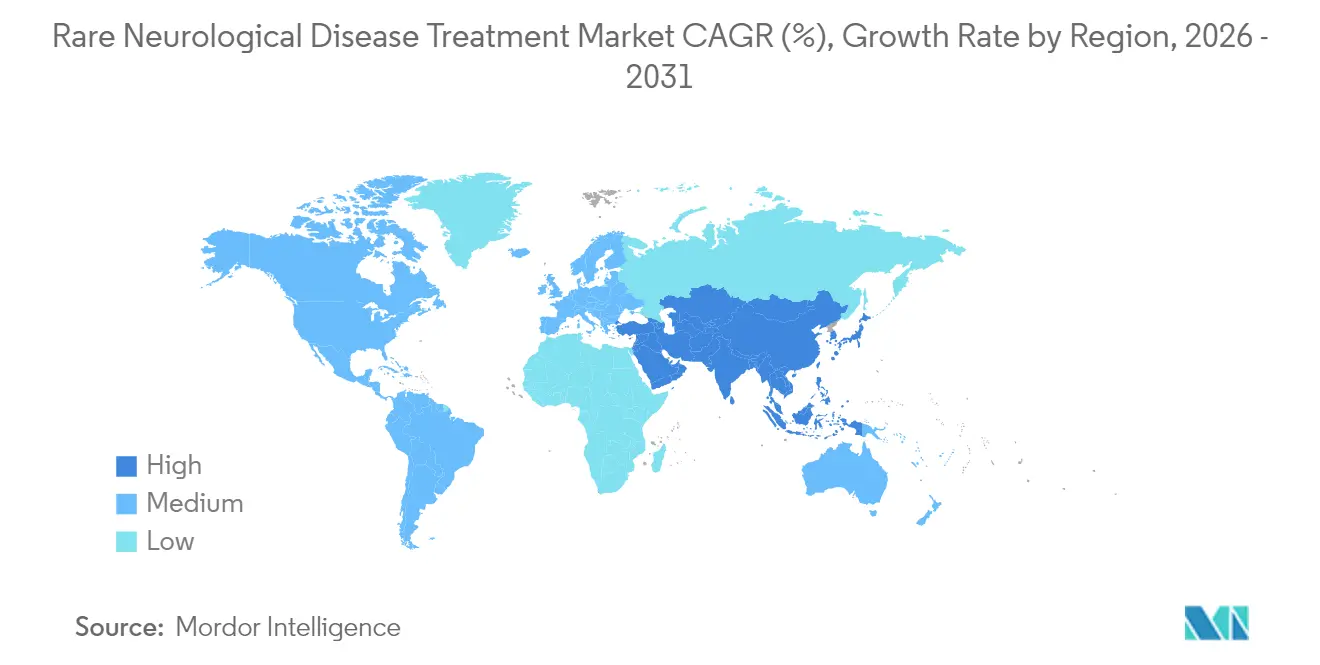
- North America dominated geography segmentation by revenue with 41.72% in 2025, but Asia-Pacific heads the growth table with a 9.58% CAGR to 2031.
Note: Market size and forecast figures in this report are generated using Mordor Intelligence’s proprietary estimation framework, updated with the latest available data and insights as of 2026.
Market Trends and Insights
Drivers Impact Analysis of Rare Neurological Disease Treatment Market*
| Driver | (~) % Impact on CAGR Forecast | Geographic Relevance | Impact Timeline |
|---|---|---|---|
| FDA fast-track & orphan-drug incentives boosting R&D investment | +1.2% | Global, with strongest impact in North America & EU | Medium term (2-4 years) |
| Rising prevalence of rare neurological disorders due to improved diagnostics | +0.8% | Global, with accelerated growth in APAC | Long term (≥ 4 years) |
| Venture-capital funding surge for gene & RNA therapies targeting rare CNS diseases | +1.1% | North America & EU core, spill-over to APAC | Short term (≤ 2 years) |
| Increasing newborn-screening programs for spinal muscular atrophy & others | +0.9% | North America, expanding to EU and select APAC markets | Medium term (2-4 years) |
| AI-powered drug-repurposing platforms identifying CNS orphan indications | +0.7% | Global, with early adoption in North America | Long term (≥ 4 years) |
| Cross-border patient-advocacy consortiums accelerating compassionate-use access | +0.6% | Global, with emphasis on emerging markets | Medium term (2-4 years) |
| Source: Mordor Intelligence | |||
FDA Fast-Track & Orphan-Drug Incentives Boosting R&D Investment
The FDA Rare Disease Innovation Hub now assigns specialist reviewers who move dossiers through priority cycles that shorten standard timelines. Breakthrough therapy designations for rare neurological conditions rose 34% year-over-year after 2024, with approvals such as UniQure’s AMT-130 and PTC Therapeutics’ PTC518 setting precedents for Huntington’s disease. Seven-year market exclusivity, fee waivers, and tax credits make the economics attractive even for niche indications, inviting small biotechs into a space once ruled by large pharma. Validation of one program often unlocks broader platform applications, creating virtuous funding loops that keep the rare neurological disease treatment market momentum intact. Accelerated pathways also encourage smarter trial designs that accept surrogate endpoints, enabling developers to pivot resources early.
Rising Prevalence of Rare Neurological Disorders Due to Improved Diagnostics
Universal newborn screening for spinal muscular atrophy in all U.S. states now pinpoints affected infants before symptom onset, transforming lifetime outcomes with early Zolgensma or Spinraza dosing. Costs of whole-genome sequencing have plummeted 99.9% since 2001, bringing advanced diagnostics to community hospitals. Tele-genetics and virtual counseling extend expert oversight to underserved areas, while cloud-based variant libraries increase detection of ultra-rare CNS mutations. Enhanced prevalence data provides a sturdier commercial rationale that fuels additional R&D. Asia-Pacific gains materially as government-funded sequencing panels reach rural populations, broadening the global base for the rare neurological disease treatment market.
Venture-Capital Funding Surge for Gene & RNA Therapies
Rare-neurology start-ups attracted USD 2.8 billion in 2024, a 23% year-on-year rise despite sector-wide tightening of capital. Investors cite reusable delivery systems and high regulatory success rates under orphan frameworks as risk mitigants. Deals such as Neurolentech–Kaerus and Cajal Neuroscience–Creyon Bio demonstrate the preference for collaborations that fuse molecular engineering with genetic insight. This inflow of capital allows simultaneous development of multiple pipeline assets, distributing portfolio risk and deepening the bench of near-term launches in the rare neurological disease treatment market.
Increasing Newborn-Screening Programs for SMA & Others
Universal newborn screening for spinal muscular atrophy has transformed treatment outcomes by enabling presymptomatic intervention with disease-modifying therapies like Zolgensma and Spinraza. The expansion of screening programs beyond SMA to include other rare neurological conditions creates a pipeline of early-diagnosed patients who can benefit from emerging therapies. Early treatment initiation is particularly critical for neurodegenerative conditions where irreversible damage occurs before symptom onset. The success of SMA programs has provided a blueprint for similar initiatives, with several U.S. states piloting expanded panels that include additional lysosomal storage and metabolic disorders.
Restraints Impact Analysis of Rare Neurological Disease Treatment Market*
| Restraint | (~) % Impact on CAGR Forecast | Geographic Relevance | Impact Timeline |
|---|---|---|---|
| High cost of biologics and gene therapies limiting affordability | -1.2% | Global, with acute impact in emerging markets | Long term (≥ 4 years) |
| Clinical-trial recruitment challenges due to ultra-small patient pools | -0.8% | Global, with particular challenges in APAC and MEA | Medium term (2-4 years) |
| Stringent CNS safety requirements prolonging regulatory approval timelines | -0.9% | Global, with strictest enforcement in North America & EU | Medium term (2-4 years) |
| Cold-chain logistics gaps for intrathecal RNA drugs in emerging markets | -0.6% | Emerging markets, particularly APAC, MEA, and South America | Short term (≤ 2 years) |
| Source: Mordor Intelligence | |||
High Cost of Biologics and Gene Therapies Limiting Affordability
Average annual therapy spend for rare diseases hit USD 32,000 in 2024, and top-end gene therapies such as Zolgensma list at USD 2.1 million. Payers respond with prior-authorization layers, outcome-based deals, and installment contracts that slow rollout. In middle-income settings, fiscal ceilings effectively ration access, creating a bifurcated global landscape unseen in mass-market therapies. Manufacturers are experimenting with annuity-style arrangements, but the administrative burden often outweighs benefits for smaller health systems.
Clinical-Trial Recruitment Challenges Due to Ultra-Small Patient Pools
Several ultra-rare neurological conditions involve fewer than 1,000 individuals worldwide, forcing innovative designs such as adaptive N-of-1 or basket trials. Geographic dispersion raises logistic costs, and site expertise is concentrated in a handful of academic centers. Virtual-first protocols and decentralized monitoring ease travel burdens yet still require regulator acceptance. Global patient registries and natural-history cohorts become essential pre-competitive assets that companies must now sponsor early.
*Our forecasts treat driver/restraint impacts as directional, not additive. The impact forecasts reflect baseline growth, mix effects, and variable interactions.
Rare Neurological Disease Treatment Market Segment Analysis
By Therapy Type:
Gene Therapy Maintains Lead as RNA SurgesGene therapy contributed 35.78% to 2025 revenue, underpinned by blockbuster launches and label extensions of AAV-based constructs. The rare neurological disease market size tied to gene therapy will grow at 6.05% annually through 2031 as next-generation vectors tackle larger genes and re-dosing obstacles. RNA-based therapy records the swiftest climb at 7.12% CAGR, reflecting investor appetite for antisense and siRNA platforms that reuse chemistry across indications. Small-molecule programs keep residual share where blood-brain barrier penetration remains feasible, and monoclonal antibodies advance alongside improved CNS delivery systems. Enzyme-replacement therapy stabilizes as a workhorse for lysosomal storage disorders.
Pipeline activity highlights how platform reuse lowers per-asset cost. Spinraza, Eteplirsen, Vutrisiran, and Eplontersen illustrate that one delivery backbone can support diverse targets, a dynamic that intensifies competitive pressure across therapy classes. As price scrutiny mounts, developers tout manufacturing scalability and rapid tech-transfer as differentiators. This competition fosters a richer portfolio of launch candidates, reinforcing the long-term trajectory of the rare neurological disease treatment market.



By Indication:
SMA Leadership Faces DMD DisruptionSpinal muscular atrophy held 28.46% of 2025 sales because of universal newborn screening, three commercially mature therapies, and measurable clinical outcomes. Yet Duchenne muscular dystrophy accelerates at 7.89% CAGR to 2031 as exon-skipping, gene-editing, and micro-dystrophin constructs enter late-stage trials. Huntington’s disease therapies leveraging huntingtin-lowering RNA and gene-silencing agents inch closer to the marketplace. Rare epilepsy syndromes adopt precision ASO regimens tailored to single-gene defects, supporting premium pricing tied to demonstrable seizure reduction.
The indication landscape reflects the evolution from broad-spectrum approaches to precision-medicine strategies that target specific genetic mutations or pathological pathways. Batten disease exemplifies this trend, with multiple companies developing therapies for different genetic subtypes using gene therapy, enzyme replacement, and small-molecule approaches.
By Route of Administration:
IV Dominates but Patient-Friendly Formats RiseIntravenous infusion represented 43.55% of 2025 revenue because most AAV vectors and recombinant biologics require controlled hospital settings. The rare neurological disease treatment market share for IV is projected to erode slowly as intrathecal, subcutaneous, and implantable systems post an 8.39% CAGR to 2031. Direct cerebrospinal fluid delivery enhances drug concentration at the site of action while reducing systemic toxicity risk. Oral agents remain niche but gain attention where small-molecule modulators can cross the blood-brain barrier via transporter exploitation.
Developers differentiate on dosing convenience: long-acting depots, osmotic pumps, and micro-dosing chips seek to transform chronic infusions into quarterly or annual procedures. Such innovation could tilt purchasing decisions among payers who weigh treatment burden alongside efficacy.
Geography Analysis
North America Rare Neurological Disease Treatment Market
North America generated 41.72% of global sales in 2025 on the back of specialized clinics, integrated payer systems, and the FDA’s orphan-friendly stance. The region’s multiplier effect—where rapid regulatory approval feeds early reimbursement and guideline adoption—creates a cyclical advantage that entrenches its leadership. Yet price negotiations intensify under the Inflation Reduction Act, prompting manufacturers to weigh net-price erosion against early-launch benefits.
Europe Rare Neurological Disease Treatment Market
Europe occupies the second-largest share with its centralized EMA approval route but fragmented reimbursement labyrinth. Health-technology assessments in Germany, France, and the United Kingdom scrutinize cost-effectiveness of seven-figure therapies, occasionally imposing risk-share deals that delay full market entry. Nonetheless, Europe’s academic depth fuels investigator-sponsored trials that enrich global evidence bases, particularly in gene-therapy translational research.
APAC Rare Neurological Disease Treatment Market
Asia-Pacific is the rare neurological disease treatment market’s fastest climber at a 9.58% CAGR, benefitting from Japan’s SAKIGAKE, China’s breakthrough therapy designation, and Australia’s expedited schemes. National rare-disease catalogs unlock early access funding, while high population density magnifies absolute patient counts despite low prevalence. Cold-chain logistics and affordability remain hurdles, but regional collaborations—exemplified by South Korea’s rare-disease registry network—are narrowing the infrastructure gap.

Regulatory Landscape
Regulation for rare neurological disease treatments is anchored by orphan-drug frameworks and expedited review pathways across major agencies, notably the US FDA and the EMA. These mechanisms support development through orphan designation, protocol assistance, and access to accelerated programs. In the United States, the FDA Rare Disease Innovation Hub provides a cross-center coordination mechanism relevant to both CDER and CBER products, reflecting the market mix of small molecules, biologics, and gene and RNA therapies.
In February 2026, the FDA issued draft guidance describing a Plausible Mechanism Framework for individualized therapies for ultra-rare diseases. The agency signals willingness to consider limited clinical evidence packages where randomized trials are impractical. In the United Kingdom, the MHRA opened a May 2026 public consultation on a Rare Disease Therapies Regulatory Framework, including an Investigational Marketing Authorisation concept that blends trial authorization with a progressive route to market authorization. In the European Union, orphan designation remains governed under the established EMA legal framework, while broader EU pharmaceutical legislation reform reached a preliminary agreement in December 2025 and continued through 2026, keeping focus on how designation governance and timelines may be handled going forward.
Value Chain Analysis
The value chain starts with discovery and translational research (academic labs, biotech platforms, and patient-advocacy enabled registries). It then moves into specialized development steps, including vector design for gene therapies, oligonucleotide chemistry for RNA therapies, and biomarker strategy suitable for ultra-small cohorts. Clinical development concentrates at centers of excellence able to support intrathecal administration, advanced imaging, and long-term neurodevelopmental follow-up. As recruitment constraints intensify, developers increasingly rely on alternative trial designs and natural-history data.
Manufacturing and distribution are major cost and risk nodes, particularly for advanced therapy medicinal products that require specialized facilities, trained personnel, and high-quality release testing. These steps also depend on stringent temperature-controlled logistics. Commercial distribution often bypasses retail channels in favor of limited networks and specialty pharmacy models that enable direct-to-patient shipment or delivery to treatment centers, supported by services such as benefits verification and adherence monitoring. Operational execution is shaped by compliance requirements, including the US federal Anti-Kickback Statute and state-by-state pharmacy laws that affect limited distribution structures, while Europe emphasizes supply resilience through initiatives aligned with the Pharmaceutical Strategy for Europe, encouraging more localized operational presence and manufacturing footprint choices for critical therapies.
Competitive Landscape
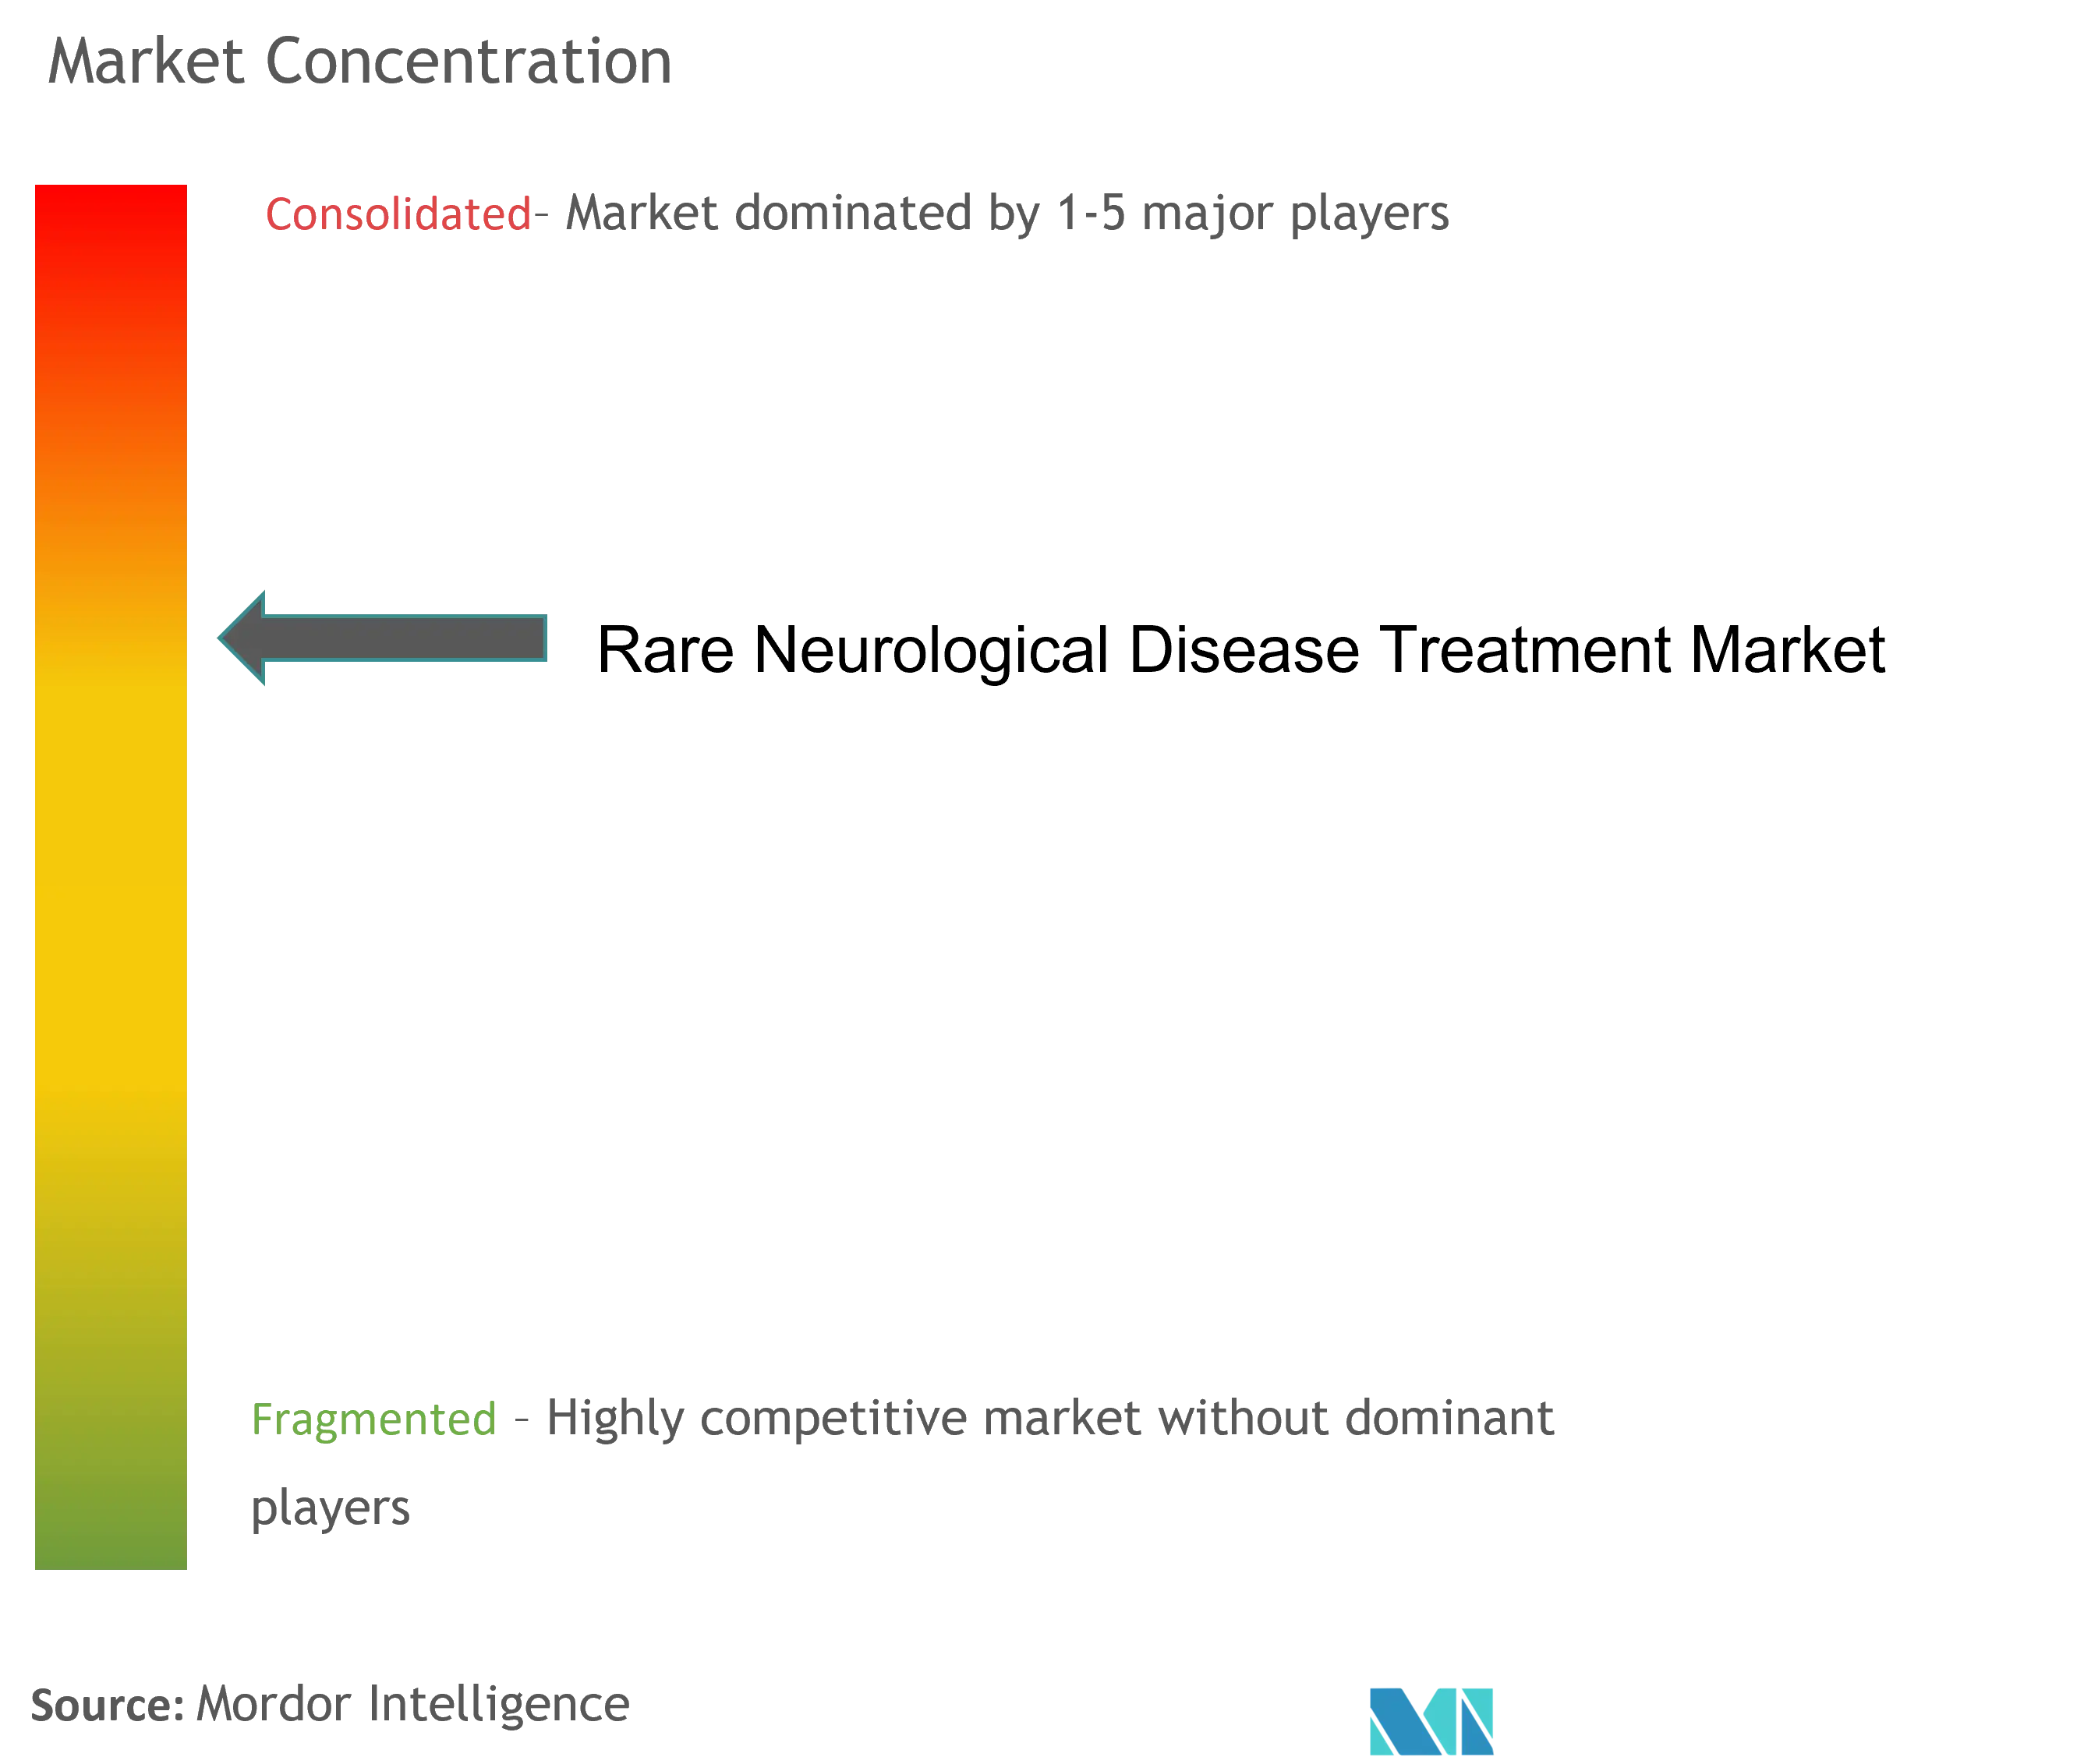
The market exhibits moderate fragmentation: the top five vendors hold roughly half of the revenue share. AbbVie’s USD 8.7 billion sweep of Cerevel Therapeutics and Johnson & Johnson’s USD 14.6 billion buyout of Intra-Cellular Therapies exemplify defensive moves to secure rare-neurology franchises and platform technologies.
Strategic differentiation rests increasingly on delivery and access logistics. Firms allocate capital to bespoke cold-chain distribution that validates temperature integrity for RNA therapeutics across multi-day transits[2]Source: Accredo Specialty Pharmacy, “Safe Delivery of Rare Therapies,” accredo.com . Patient-support programs offering genomic counseling, travel reimbursement, and value-based payment structures have become competitive necessities.
Digital discovery tools add another layer of rivalry. AI-native entrants analyze real-world datasets to flag repurposing candidates, compressing early-stage timelines and fostering partnerships with legacy pharmas that lack in-house computational depth. IP strategies now lock in not only molecular composition but also delivery devices and combination regimens.
Rare Neurological Disease Treatment Industry Leaders
CSL Ltd
Merz Pharma GmbH & Co. KGaA
Kedrion Biopharma Inc.
US WorldMeds LLC (Solstice Neurosciences LLC)
Aquestive Therapeutics Inc.
- *Disclaimer: Major Players sorted in no particular order
Rare Neurological Disease Treatment Market Companies Covered in this Report
- Biogen
- Roche
- Novartis
- Pfizer
- Sarepta Therapeutics
- Ionis Pharmaceuticals
- UCB
- Argenx SE
- Reata Pharmaceuticals, Inc.
- Sanofi
- AstraZeneca
- Biomarin Pharmaceutical
- Jazz Pharmaceuticals plc
- Ultragenyx Pharmaceutical Inc.
- PTC Therapeutics, Inc.
- CSL Behring
- Ipsen
- Mitsubishi Tanabe Pharma Corp.
- Marinus Pharmaceuticals, Inc.
- Catalyst Pharmaceuticals, Inc.
Read Analysis of Rare Neurological Disease Treatment Companies

Market Opportunities and Future Outlook
White space remains substantial in ultra-rare and genetically defined neurological conditions where a validated delivery platform can be reused across multiple indications. That reuse can reduce marginal development time per asset and support portfolio approaches rather than single-asset bet-making. Public programs are also expanding the translational bridge for gene-based therapies: the NIH/NINDS Ultra-rare Gene-based Therapy (URGenT) network supports late-stage preclinical development and clinical trial readiness for ultra-rare neurological diseases. It targets a recurring bottleneck between proof-of-concept and first-in-human execution.
Momentum in precision genetic medicines is also showing across rare childhood epilepsies and other monogenic CNS disorders. In July 2026, ARPA-H announced the THRIVE initiative, awarding up to USD 160 million to a consortium developing in vivo precision genetic medicines for rare genetic diseases. This reinforces a platform-centric investment pathway that can broaden the pipeline beyond single-asset programs. In February 2026, the FDA Rare Disease Innovation Hub published its Strategic Agenda, which provides developers a clearer coordination touchpoint across FDA centers for rare disease programs. Company clinical data readouts continue to shape investor and partner interest; for example, Neurogene reported June 2026 data (cutoff) from its Phase 1/2 NGN-401 Rett syndrome program with milestone gains across treated participants through extended follow-up, supporting continued attention on gene-based approaches in severe pediatric neurodevelopmental disorders.
Recent Industry Developments in Rare Neurological Disease Treatment Market
- July 2026: ARPA-H announced the THRIVE initiative, awarding up to USD 160 million to a consortium to develop in vivo precision genetic medicines for rare genetic diseases, including rare childhood epilepsies. The program structure favors scalable platform approaches rather than single-asset bets, supporting broader pipeline formation in monogenic CNS indications.
- November 2025: Kedrion Biopharma reported that the EMA granted Orphan Drug Designation to its plasma-derived investigational treatment for congenital aceruloplasminemia. The designation strengthens regulatory positioning in an ultra-rare neurology-adjacent genetic disorder and supports development planning through established orphan incentives.
- October 2024: Bright Minds Biosciences and Firefly Neuroscience initiated a Phase II EEG-based absence-epilepsy study for BMB-101. The trial design pairs a therapy program with objective neurophysiology endpoints, reflecting the market shift toward biomarker-supported development in rare epilepsy syndromes.


Rare Neurological Disease Treatment Market Report Scope and Research Methodology
Market Definition and Coverage
This market covers revenues from medicines and advanced therapies used to treat rare neurological diseases, where treatment is directed at a defined rare condition affecting the brain, spinal cord, or peripheral nerves, and is prescribed through standard clinical pathways.
Scope exclusions: We exclude diagnostics, standalone supportive devices, and non-therapeutic services unless they are bundled into the priced drug or therapy course.
Segments Covered in This Report
- By Therapy Type (Value)
- Small-Molecule Drugs
- Biologics & Monoclonal Antibodies
- Gene Therapy
- Enzyme-Replacement Therapy
- RNA-based Therapy
- Others
- By Indication (Value)
- Spinal Muscular Atrophy
- Duchenne Muscular Dystrophy
- Batten Disease
- Amyotrophic Lateral Sclerosis (Rare Forms)
- Huntington’s Disease
- Rare Epilepsy Syndromes
- Others
- By Route of Administration (Value)
- Oral
- Intravenous
- Others
- By Geography (Value)
- North America
- United States
- Canada
- Mexico
- Europe
- Germany
- United Kingdom
- France
- Italy
- Spain
- Rest of Europe
- Asia-Pacific
- China
- India
- Japan
- South Korea
- Australia
- Rest of Asia-Pacific
- South America
- Brazil
- Argentina
- Rest of South America
- Middle East and Africa
- GCC
- South Africa
- Rest of Middle East and Africa
- North America
Data Sources, Market Sizing, and Validation
Desk Research
Desk work starts by mapping what counts as a rare neurological disease therapy, then collecting demand and supply signals that can be checked across regions. Public sources we use include FDA and EMA drug label and approval databases, NIH ClinicalTrials.gov for pipeline tracking, CDC and WHO epidemiology and burden-of-disease statistics, and materials from groups such as NORD and EURORDIS (along with peer reviewed neurology and orphan-drug journals).
We also review company annual reports, investor presentations, and earnings transcripts to understand therapy launch timing, patient support programs, and revenue mix by region. Where needed, we pull structured company financials and patent filings through approved subscription databases so pricing direction and life-cycle events can be cross-checked. These examples are illustrative rather than exhaustive, and we referred to many other public materials for collection, validation, and clarification.
Primary Interviews and Surveys
Primary conversations and short surveys were used to validate how patients get diagnosed, when they become treatment eligible, and how therapy choice shifts across lines of care. We typically speak with neurology specialists, pharmacy and access leaders, patient-advocacy informed experts, and commercial teams across Americas, EMEA, and APAC, so regional reimbursement and launch sequencing are reflected in the final assumptions.
Distribution of primary research fieldwork respondents
| Company type | Respondent position | Region |
|---|---|---|
| Top tier: 29% | CXOs: 14% | APAC: 48% |
| Mid tier: 50% | Functional/Unit leaders: 33% | EMEA: 34% |
| Smaller Players: 21% | Managers: 53% | Americas: 18% |
Market-Sizing & Forecasting
Sizing is built using a top-down demand pool assessment. Prevalence and diagnosed population are translated into treated cohorts by indication, then multiplied by typical annual therapy cost ranges that were validated through interviews. Because many rare neuro conditions have small addressable pools, we further anchor the model to observable signals such as orphan-drug approvals, therapy launch dates, specialty center density, reimbursement breadth, and route-of-administration mix, which influences site-of-care cost and uptake.
The totals are then checked with selective bottom-up approximations, such as rolling up a sample of therapy revenues where disclosures exist, and using sampled patient volumes and price bands to confirm that country and region numbers remain realistic. When data is thin in smaller countries, we use proxy assumptions from similar reimbursement systems and referral pathways, then adjust once expert feedback indicates earlier or later adoption.
For forecasting, we use scenario analysis around key inflection points, including new gene therapy approvals, label expansions, and loss of exclusivity events, and we run a regression style sanity check against expected diagnosis rates and healthcare spend capacity. Final growth paths are kept aligned with what clinicians and access experts expect to be feasible, especially for ultra-rare indications with limited treatment centers.
Data Validation & Update Cycle
Each major step is validated by cross-checking outputs against independent signals, including indication level treated-patient logic, known launch calendars, and region level access maturity. Outliers are flagged, reviewed, and corrected through re-checks of assumptions, then followed by a second analyst review before numbers are signed off.
The model is refreshed annually so new approvals, safety updates, and reimbursement changes are captured in the next release. If a material event occurs between cycles, the affected parts of the model are updated after assumptions are revisited. Before delivery, we do a final pass to confirm the latest public and expert inputs are reflected.
Mordor Intelligence's Rare Neurological Disease Treatment Market Size Compared With Other Published Estimates
Published market values for rare neurological disease treatment can look far apart because the scope is not standardized and the condition list is not always handled the same way. Differences also come from how one-time gene therapies are annualized versus recorded as upfront cost, and whether pricing is modeled as list price, net price, or blended realized price.
The main gap comes from how broadly the disease and therapy basket is defined, where some estimates pool in broader rare-disease neurology overlaps and symptom-management drug spend that is not tied to a specific rare neurological indication with a distinct treatment pathway.
Benchmark comparison
| Source | Market Size | Gaps in Research Methodology |
|---|---|---|
| Mordor Intelligence | USD 15.72 B (2025) | |
| Global Consultancy A | USD 45.90 B (2025) | Uses a wider condition and therapy basket, which likely includes broader rare-disease neurology overlaps and supportive treatment spend, and this expands the treated pool beyond marketed therapy pathways. |
| Industry Publisher B | USD 10.64 B (2025) | Often reports factory-gate style revenues and may exclude downstream channel markups and some high-cost advanced therapies, which can compress the value in years with major launches. |
The table points to scope and pricing treatment as the two biggest drivers of variance. With Mordor Intelligence, the 2025 value is kept linked to diagnosed-to-treated cohort build-ups by indication and therapy-type pricing assumptions (including how one-time therapies are spread over time), which makes the total easier to reconcile across regions when access changes.


Key Questions Answered in the Report
Question
Answer
How large is the rare neurological disease treatment market today?
Forecasts indicate USD 16.77 billion in 2026 and USD 23.15 billion by 2031, reflecting a 6.66% CAGR over 2026-2031.
Which device format is most widely used in hospitals today?
Band or strap-based cuffs remain the most common, accounting for 46.62% of 2025 global sales.
Why are ambulatory surgical centers increasing their use of radial compression devices?
ASCs favor radial access for same-day discharge and have recorded 8.27% annual growth in device adoption through 2031.
How do hybrid automatic cuffs improve safety compared with pneumatic models?
Hybrids use sensors to adjust pressure automatically, supporting patent-hemostasis and lowering radial artery occlusion incidence to below 2% in leading programs.
What regulatory issue most affects device pricing in Europe?
EU-MDR certification costs of EUR 5,000100,000 per product elevate production expenses and influence final pricing across European hospitals.
Which region is expected to record the fastest procedural growth during the forecast period?
Asia-Pacific is poised for the highest growth as co
Page last updated on:


 Your data is secure and never sold or shared.


