Molded Fiber Packaging Market Size and Share
Market Overview
| Study Period | 2020 - 2031 |
|---|---|
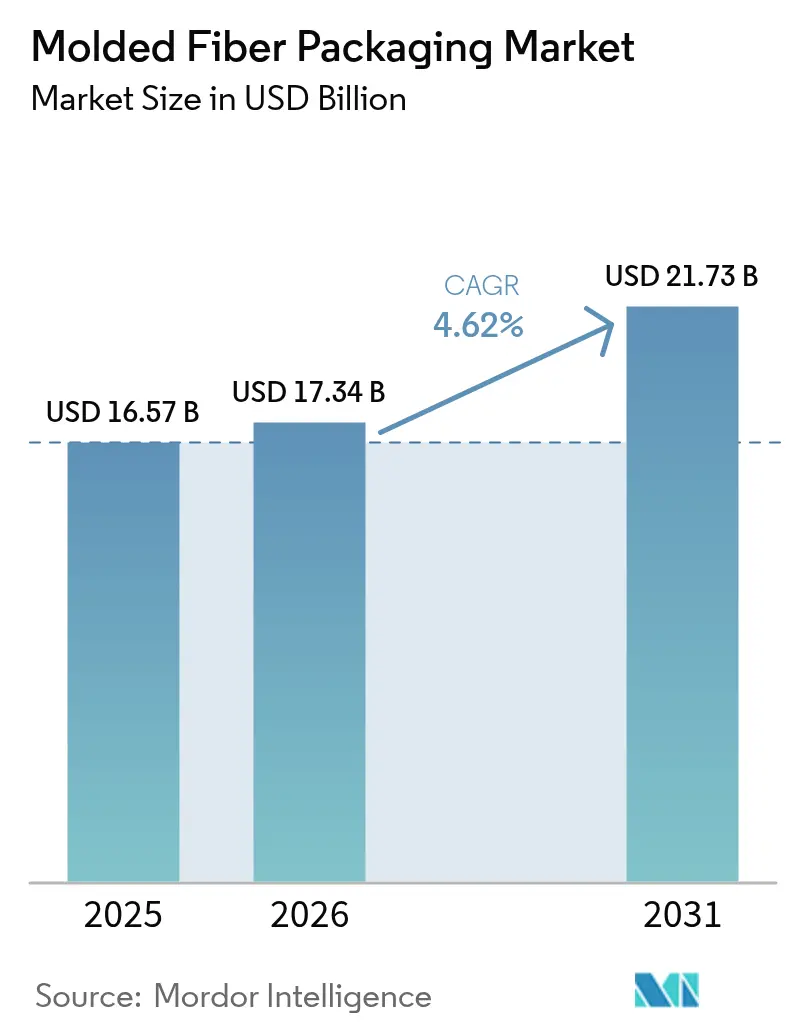
| Market Size (2026) | USD 17.34 Billion |
| Market Size (2031) | USD 21.73 Billion |
| Growth Rate (2026 - 2031) | 4.62% CAGR |
| Fastest Growing Market | Asia Pacific |
| Largest Market | Asia Pacific |
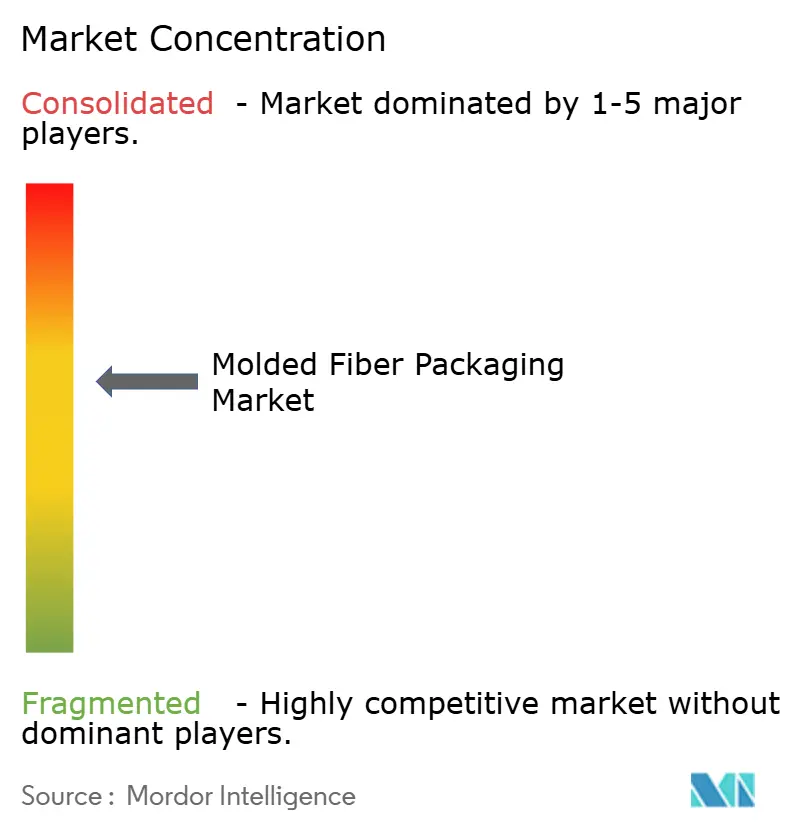
| Market Concentration | Medium |
Major Players *Disclaimer: Major Players sorted in no particular order Image © Mordor Intelligence. Reuse requires attribution under CC BY 4.0. | |
Molded Fiber Packaging Market Analysis by Mordor Intelligence
The molded fiber packaging market size is projected to expand from USD 16.57 billion in 2025 and USD 17.34 billion in 2026 to USD 21.73 billion by 2031, registering a CAGR of 4.62% between 2026 to 2031. A wave of single-use plastic prohibitions is shortening brand conversion cycles, and molded fiber delivers a 12-18% landed-cost advantage once Extended Producer Responsibility fees on polystyrene are factored in. E-commerce networks report 18-22% lower damage claims when molded fiber replaces expanded polystyrene, reinforcing the channel’s preference for dimensional stability. Quick-service restaurants are scaling compostable clamshells that meet ASTM D6868, while 3-D dry-molding patents allow wall thicknesses below 1.2 millimeters without losing crush resistance. Competitive intensity is moderate because the top five suppliers hold only a 35% share, leaving room for regional converters that specialize in barrier coatings and custom tooling.
Key Report Takeaways
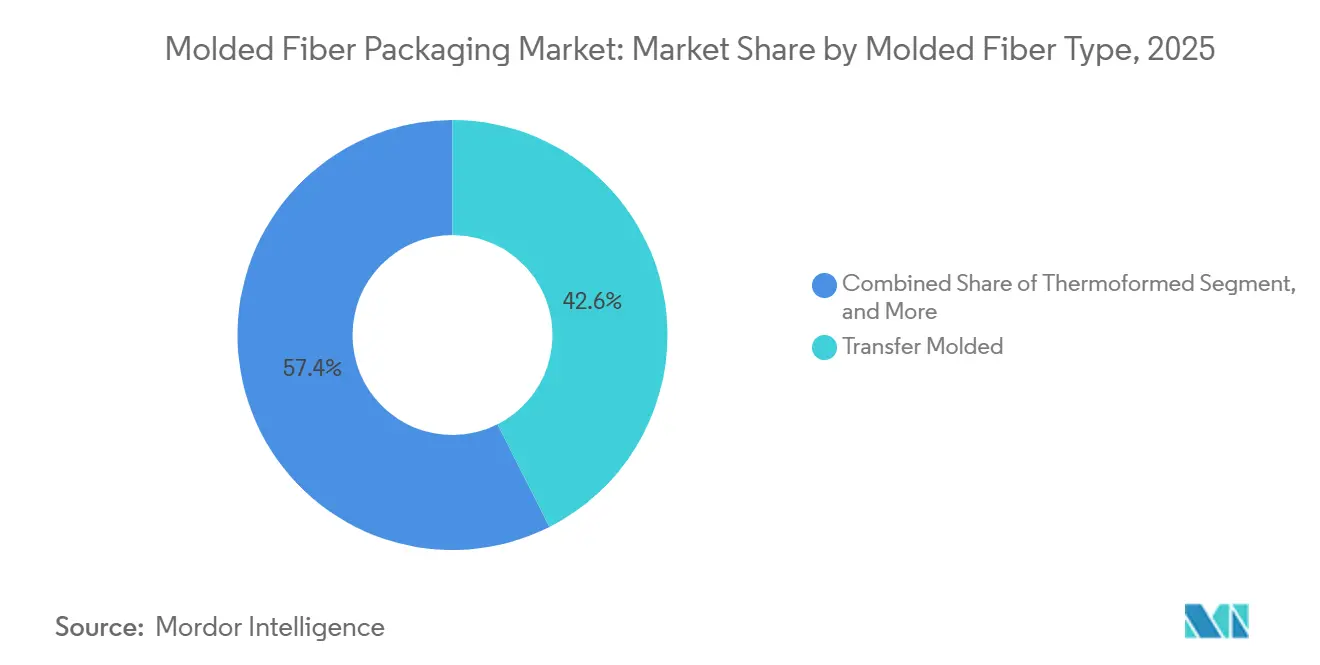
- By molded fiber type, transfer-molded formats led with a 42.56% of the molded fiber packaging market share in 2025, while thermoformed variants recorded the highest projected CAGR at 5.44% through 2031.
- By product type, trays accounted for 37.69% of the 2025 total, whereas clamshells and containers are forecast to grow the fastest at a 5.63% CAGR to 2031.
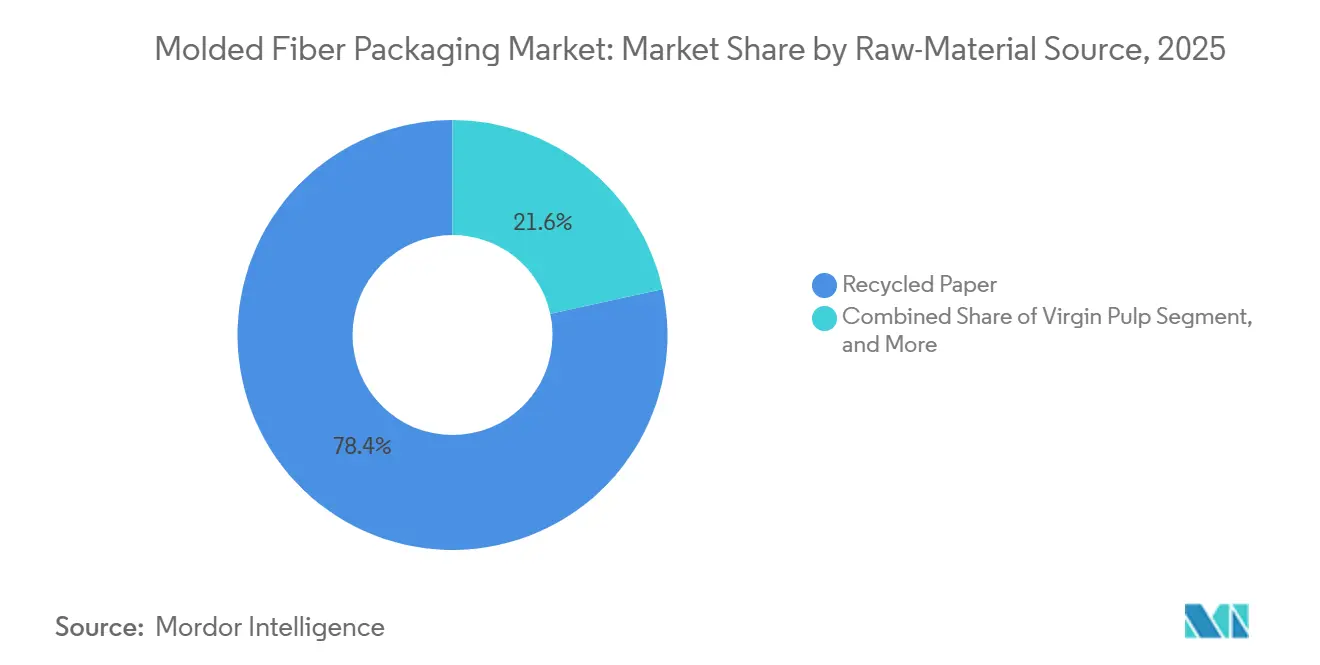
- By raw-material source, recycled paper supplied 78.42% of the molded fiber packaging market share in 2025, while virgin pulp is expected to advance at the quickest 5.21% CAGR during 2026-2031.
- By end-user industry, food and beverages dominated with 53.47% of the molded fiber packaging market share in 2025, whereas electronics and appliances are set to post the strongest 5.66% CAGR over the forecast period.
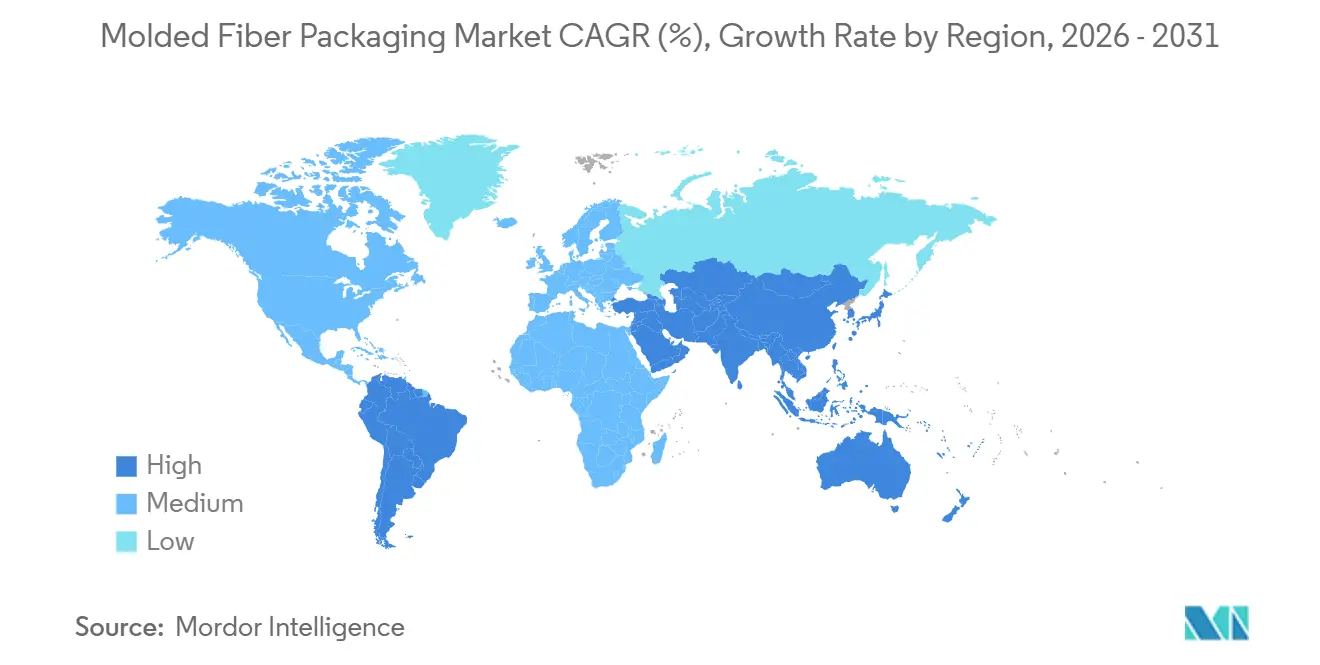
- By geography, Asia-Pacific captured 36.83% of global revenue in 2025 and is also projected to register the highest regional growth at a 5.69% CAGR through 2031.
Note: Market size and forecast figures in this report are generated using Mordor Intelligence’s proprietary estimation framework, updated with the latest available data and insights as of 2026.
Global Molded Fiber Packaging Market Trends and Insights
Drivers Impact Analysis*
| Driver | (~) % Impact on CAGR Forecast | Geographic Relevance | Impact Timeline |
|---|---|---|---|
| Regulatory Bans on Single-Use Plastics | +1.2% | EU, Canada, UAE, global spillover | Short term (≤ 2 years) |
| Growth of E-Commerce and Food-Delivery | +0.9% | North America, Europe, Asia-Pacific | Medium term (2-4 years) |
| Shift in Consumer Preference Toward Eco-Friendly Packaging | +0.7% | North America, Europe, emerging Asia-Pacific | Medium term (2-4 years) |
| Quick-Service Restaurant Adoption of Compostable Clamshells | +0.6% | North America, Europe expanding to Asia-Pacific | Medium term (2-4 years) |
| Commercialization of 3-D Dry-Molded Fiber | +0.5% | Early in Europe and North America | Long term (≥ 4 years) |
| Brand-Level Carbon-Neutral Pledges | +0.4% | Multinationals worldwide | Long term (≥ 4 years) |
| Source: Mordor Intelligence | |||
Regulatory Bans on Single-Use Plastics
National prohibitions now cover polystyrene foodservice ware in the European Union, Canada, and the United Arab Emirates, forcing brand owners to switch materials within single-year budget cycles instead of multi-year pilots. The EU’s Packaging and Packaging Waste Regulation 2025/40 sets a 30% recycled-content floor for certain plastic formats by 2030, but molded fiber already complies, so procurement teams shift their focus from unit price to total compliance costs.[1]European Parliament, “Regulation (EU) 2025/40 on Packaging and Packaging Waste,” eur-lex.europa.eu Germany and France exempt fiber from Extended Producer Responsibility fees that average EUR 0.08-0.12 per item, giving molded fiber a 12-18% landed-cost edge versus virgin polystyrene. Brands also anticipate stricter microplastics rules that took effect across the EU in December 2025, which have led fiber sidesteps to be entirely avoided as more jurisdictions mirror these bans. As more jurisdictions adopt these bans, molded fiber’s regulatory advantage widens, accelerating demand through 2027.
Growth of E-Commerce and Food-Delivery Channels
E-commerce sellers such as Amazon reduced damage claims by up to 22% after switching from expanded polystyrene to molded fiber inserts, strengthening the business case for fiber in protective packaging.[2]Amazon, “2025 Sustainability Report,” sustainability.aboutamazon.com Urban food-delivery operators face mounting scrutiny because a single order creates roughly 1.2 kilograms of packaging waste, so DoorDash began piloting BPI-certified molded fiber bowls that meet municipal compost standards. Dimensional stability allows denser palletization, lowering warehouse rent by as much as 40% in high-cost cities. Hybrid thermoformed trays with aqueous barriers now serve both logistics and take-out needs, enabling converters to amortize tooling across multiple channels. Together, these volume gains reinforce steady raw-material offtake that cushions suppliers against cyclical downturns in any single sector.
Shift in Consumer Preference Toward Recyclable and Eco-Friendly Packaging
In 2025, 68% of U.S. consumers said they favor fiber over plastic, and more than half are willing to pay a 5-10% premium for compostable formats.[3]Foodservice Packaging Institute, “2025 Consumer Preference Survey,” fpi.org Large brand owners such as Procter and Gamble cut virgin plastic use by 21% between 2021 and 2024 and now specify molded fiber for appliance edge protectors to meet public sustainability pledges. The Ellen MacArthur Foundation’s New Plastics Economy provides standardized definitions that reduce the risk of greenwashing, so marketing teams prefer molded fiber claims over ambiguous bioplastic terminology. Retailers leverage the material’s curbside recyclability to meet corporate zero-waste goals without investing in specialized recovery systems. Rising consumer activism, therefore, translates directly into procurement mandates that favor molded fiber in both primary and secondary packaging.
Quick-Service Restaurant Adoption of Compostable Clamshells
McDonald’s achieved 96% fiber-based packaging across Europe by late 2024, eliminating 12,000 tons of polystyrene annually through new molded fiber sundae cups and McFlurry containers. Starbucks followed in May 2025 with molded fiber beverage lids as part of its commitment to phase out plastic straws and lids worldwide by 2030. The NextGen Cup Consortium awarded USD 5 million to cup-and-lid innovators that can maintain a 60-minute liquid barrier without perfluoroalkyl substances, closing a critical performance gap. High-volume contracts exceeding 5 million units annually let converters recover USD 150,000 tooling costs in under 18 months, an economic advantage smaller chains cannot replicate. As leading QSRs expand fiber adoption to global franchises, they institutionalize molded fiber specifications that ripple through the supply base.
Restraints Impact Analysis*
| Restraint | (~) % Impact on CAGR Forecast | Geographic Relevance | Impact Timeline |
|---|---|---|---|
| Price Volatility of High-Grade Recycled Fiber | -0.6% | North America, Europe, global | Short term (≤ 2 years) |
| Bioplastics and Coated Paperboard Substitutes | -0.5% | Premium segments in Europe and North America | Medium term (2-4 years) |
| Barrier-Property Limitations for Wet Foods | -0.3% | Humid climates in Asia-Pacific and South America | Medium term (2-4 years) |
| Capital-Intensive Custom Tooling Requirements | -0.2% | Global, burdens SMEs | Long term (≥ 4 years) |
| Source: Mordor Intelligence | |||
Price Volatility of High-Grade Recycled Fiber
Northern Bleached Softwood Kraft pulp slid from USD 1,400 per ton in mid-2024 to USD 1,160 by year-end, yet still sits one-third above 2020 averages, while Old Corrugated Container values in the United States dropped 24% from 2023 highs before stabilizing at USD 85-95 per ton. China cut recovered-paper imports to 8.3 million tons in 2024, tightening global supply and lifting Asian spot prices. Because paper fibers survive only 5 to 7 recycling loops, the U.S. recovery rate of 65.7% is near its ceiling, capping additional growth in feedstock. Converters without long-term contracts face 8-12% swings in margins when weather or labor disruptions idle pulp capacity. Persistent volatility discourages capital spending among smaller players and may slow molded fiber penetration during price spikes.
Bioplastics and Coated Paperboard Substitutes
Global polylactic acid capacity reached 1.2 million tons in 2024, and coated paperboards now deliver moisture barriers that molded fiber absorbs within 30 minutes, capturing premium shelf-stable food applications. Danimer Scientific and Newlight Technologies commercialized polyhydroxyalkanoate resins that offer compostability with lower water uptake, eroding molded fiber’s environmental impact. Ricoh’s foamed PLA cushions achieve the shock absorption of expanded polystyrene at densities 40% lighter than molded fiber, appealing to electronics brands with tight dimensional tolerances. These alternatives command a 15-20% cost premium, but brands serving organic foods, cosmetics, and high-end electronics accept the surcharge in exchange for printability and liquid barrier performance, without rapid progress in fluorine-free aqueous coatings, molded fiber risks losing share in these lucrative niches.
*Our forecasts treat driver/restraint impacts as directional, not additive. The impact forecasts reflect baseline growth, mix effects, and variable interactions.
Segment Analysis
By Molded Fiber Type: Transfer Molded Dominates, Thermoformed Accelerates
Transfer-molded products held 42.56% of the molded fiber packaging market share in 2025, driven by economical 2-4 millimeter walls that protect appliances during global transit. Thermoformed lines are expanding at an annual rate of 5.44%, bolstering the molded fiber packaging market for foodservice clamshells. This growth is driven by advancements in manufacturing processes, which enable the production of thinner wall thicknesses under 1.8 millimeters. These thinner walls reduce material usage, leading to cost savings and improved sustainability, all while maintaining the necessary rigidity for effective packaging performance.
PulPac’s dry-molding platform eliminates water-based pulping, so cycle times fall to 5 seconds and electricity consumption drops by 65%, a breakthrough that lowers cost parity with conventional plastic lids. Thick-wall formats persist in automotive and industrial trays, where drop-test criteria outweigh aesthetics, while processed variants, calendered or barrier-coated, address grease migration in bakery packaging. Apple’s patent for variably compressed fiber foreshadows density-tuned inserts that slash both weight and raw-material spend.


By Product Type: Clamshell Demand Outpaces Tray Growth
In 2025, trays accounted for 37.69% of the revenue, catering to fresh produce, eggs, and baked goods, all of which emphasize stack height and airflow. While clamshells and containers currently hold a smaller market share, they're growing at a rate of 5.63% annually. This growth is largely driven by the endorsement of McDonald’s European sundae cups and Starbucks beverage lids, both of which have proven their efficacy under hot-fill conditions.
Cup and carrier formats claim roughly 18% of demand but remain constrained by coating costs that lift unit economics 12-18%. Plates and bowls scale in institutional catering where zero-waste mandates override initial price concerns. Protective inserts for high-value electronics command higher margins, making them attractive to converters that already own precision tooling. The NextGen Cup Consortium’s grants aim to solve the 60-minute liquid barrier, which could unlock coffee and tea segments previously reserved for bioplastic-lined paperboard.
By Raw-Material Source: Recycled Streams Lead, Virgin Pulp Gains
Recycled paper comprised 78.42% of input tonnage in 2025 because OCC trades at only USD 85-95 per ton, yet virgin pulp is rising at 5.21% as regulators tighten mineral-oil migration limits on food-contact packaging. While incurring a 10-15% surcharge, the blended-fiber solution—comprising 70% recycled and 30% virgin fibers—satisfies hygiene standards and upholds sustainability claims. This composition ensures a balance between environmental responsibility and compliance with hygiene requirements, making it a viable option for industries prioritizing both sustainability and quality.
Asia-Pacific supply tightened when China cut recovered-paper imports by nearly 2 million tons in 2024, narrowing the cost gap between recycled and virgin streams. In response, several converters in India and Southeast Asia locked multi-year pulp contracts to shield themselves against volatility. As the molded fiber packaging industry edges toward hybrid formulations, demand for wet-strength chemical additives, including starch blends and polyamide-epichlorohydrin resins, is climbing accordingly.
By End-User Industry: Electronics Momentum Builds Beyond Foodservice
Food and beverages accounted for 53.47% of volume in 2025 but now exhibit mature growth, whereas electronics and appliances expand by 5.66% annually as Apple, Dell, and Samsung pivot to fiber inserts. California's Extended Producer Responsibility statute imposes disposal fees on manufacturers. As a result, manufacturers using recyclable molded fiber can avoid liabilities ranging from EUR 80 to 120 per ton, a cost typically shouldered by those using styrenics.
Healthcare adoption remains restricted to non-sterile kits because most molded fiber cannot tolerate ethylene oxide or gamma irradiation. Industrial segments leverage thick-wall corner protectors for refrigerators and washing machines, benefiting from molded fiber’s energy-absorbing geometry. Cosmetics and personal-care brands are testing processed fiber trays that accept high-definition embossing suitable for premium gifting, an adjacency likely to gain share as aqueous barrier chemistries mature.
Geography Analysis
Asia-Pacific held a 36.83% share in 2025, and regulatory tailwinds mean the region will add 5.69% CAGR through 2031. China’s coastal paper-recycling hubs and India’s rapid rollout of quick-service restaurants create dense demand nodes that justify greenfield thermoforming plants. Huhtamaki’s Telangana site, inaugurated in 2024, already exports to Middle East franchisees because freight savings offset India’s import tariffs.
In North America, the U.S. benefits from a well-established curbside recycling system, leading to stable pricing for OCC. However, growth has tempered to 4.1%. This moderation is largely due to major retailers completing their packaging-optimization initiatives, which not only downsized boxes but also removed unnecessary inserts. Meanwhile, Canada's impending plastics ban in January 2026 is set to create a temporary surge in demand for clamshells and foodservice trays.
Regulation 2025/40 is propelling Europe's growth, mandating a 30% recycled plastic content by 2030. In a bid to avoid plastic fees, grocery chains in Germany and France are replacing molded fiber produce trays. Meanwhile, converters in Scandinavia are at the forefront, developing aqueous dispersion barriers that align with the EU's microplastics restrictions. South America, the Middle East, and Africa each have a near-5 % share but display heterogeneous conditions. Brazil’s e-commerce boom is boosting demand for protective inserts, while the United Arab Emirates' ban on polystyrene will redirect restaurant sourcing to fiber-based containers in 2026. Converters eye Mexico as a cross-border logistics hub under USMCA, with Sonoco evaluating a new facility in Nuevo León.

Competitive Landscape
The top five suppliers, Huhtamaki, Brødrene Hartmann, Sonoco, UFP Technologies, and Pactiv Evergreen, command about 35% combined share, illustrating moderate concentration. Scale players invest in vertical integration to lock recycled-fiber flows; for example, Huhtamaki poured EUR 30 million into Finnish thermoforming lines capable of 500 million units a year. Hartmann expanded via a German egg-packaging acquisition that guaranteed grocery contracts.
Technology licensors such as PulPac monetize intellectual property rather than operate machinery, licensing dry-molding cells that cut cycle time to 3 seconds and energy use by almost two-thirds. Material specialists, including Solenis and Ecolab, supply fluorine-free grease barriers, a capability that secured new business after the EU banned intentionally added microplastics in 2025. Large quick-service restaurant tenders prefer suppliers that can amortize USD 150,000 tooling across tens of millions of units, reinforcing barriers to smaller regional firms.
White-space opportunities remain in wet-food packaging where molded fiber must overcome 8-12% water absorption within 30 minutes. Converters that commercialize dispersion-coated fiber capable of 60-minute liquid barriers without PFAS are positioned to win premium soup, sauce, and ready-meal contracts. Meanwhile, electronics giants patent density-modulated inserts, indicating an appetite to differentiate via proprietary packaging rather than rely on catalog stock.
Molded Fiber Packaging Industry Leaders
Huhtamaki Oyj
Brødrene Hartmann A/S
Sonoco Products Company
UFP Technologies Inc.
Omni-PAC Group UK
- *Disclaimer: Major Players sorted in no particular order

Recent Industry Developments
- January 2026: Canada enforced a nationwide single-use plastics ban, eliminating polystyrene foodservice ware and triggering a rapid shift to molded fiber clamshells and trays.
- January 2026: The United Arab Emirates implemented a full prohibition on polystyrene foodservice articles, accelerating molded fiber uptake in Dubai and Abu Dhabi.
- May 2025: Starbucks rolled out compostable molded fiber hot-beverage lids across select United States and European cafés as part of its plastic-reduction roadmap.
- March 2025: Huhtamaki completed a EUR 30 million expansion of Finnish thermoforming capacity, adding 500 million-unit annual output for quick-service applications.


Global Molded Fiber Packaging Market Report Scope
The Molded Fiber Packaging Market Report is Segmented by Molded Fiber Type (Thick Wall, Transfer Molded, Thermoformed, Processed), Product Type (Trays, Clamshells and Containers, Cups and Cup-Carriers, Plates and Bowls, Other Product Types), Raw-Material Source (Recycled Paper, Virgin Pulp, Hybrid Fiber Blends), End-user Industry (Food and Beverages, Electronics and Appliances, Healthcare and Medical Devices, Industrial, Other End-user Industries), and Geography (North America, South America, Europe, Asia-Pacific, Middle East and Africa). The Market Forecasts are Provided in Terms of Value (USD).
| Thick Wall |
| Transfer Molded |
| Thermoformed |
| Processed |
| Trays |
| Clamshells and Containers |
| Cups and Cup-Carriers |
| Plates and Bowls |
| Other Product Types |
| Recycled Paper |
| Virgin Pulp |
| Hybrid Fiber Blends |
| Food and Beverages |
| Electronics and Appliances |
| Healthcare and Medical Devices |
| Industrial |
| Other End-user Industries |
| North America | United States | |
| Canada | ||
| Mexico | ||
| South America | Brazil | |
| Argentina | ||
| Rest of South America | ||
| Europe | United Kingdom | |
| Germany | ||
| France | ||
| Italy | ||
| Rest of Europe | ||
| Asia-Pacific | China | |
| Japan | ||
| India | ||
| South Korea | ||
| Rest of Asia-Pacific | ||
| Middle East and Africa | Middle East | United Arab Emirates |
| Saudi Arabia | ||
| Rest of Middle East | ||
| Africa | South Africa | |
| Egypt | ||
| Rest of Africa | ||
| By Molded Fiber Type | Thick Wall | ||
| Transfer Molded | |||
| Thermoformed | |||
| Processed | |||
| By Product Type | Trays | ||
| Clamshells and Containers | |||
| Cups and Cup-Carriers | |||
| Plates and Bowls | |||
| Other Product Types | |||
| By Raw-Material Source | Recycled Paper | ||
| Virgin Pulp | |||
| Hybrid Fiber Blends | |||
| By End-user Industry | Food and Beverages | ||
| Electronics and Appliances | |||
| Healthcare and Medical Devices | |||
| Industrial | |||
| Other End-user Industries | |||
| By Geography | North America | United States | |
| Canada | |||
| Mexico | |||
| South America | Brazil | ||
| Argentina | |||
| Rest of South America | |||
| Europe | United Kingdom | ||
| Germany | |||
| France | |||
| Italy | |||
| Rest of Europe | |||
| Asia-Pacific | China | ||
| Japan | |||
| India | |||
| South Korea | |||
| Rest of Asia-Pacific | |||
| Middle East and Africa | Middle East | United Arab Emirates | |
| Saudi Arabia | |||
| Rest of Middle East | |||
| Africa | South Africa | ||
| Egypt | |||
| Rest of Africa | |||


Key Questions Answered in the Report
How big will the molded fiber packaging market be by 2031?
It is forecast to reach USD 21.73 billion in 2031, expanding at a 4.62% CAGR from 2026.
Which molded fiber type grows the fastest?
Thermoformed formats expand at 5.44% annually thanks to quick-service restaurant demand for thin-wall clamshells.
Why is Asia-Pacific the largest regional consumer?
Regulatory bans, e-commerce expansion, and new quick-service restaurant outlets push Asia-Pacific to 36.83% share in 2025 and the highest 5.69% CAGR through 2031.
What raw material mix dominates molded fiber production?
Recycled paper supplies 78.42% of input tonnage in 2025, although virgin pulp is gaining in food-contact applications.
Which end-user sector shows the strongest growth momentum?
Electronics and appliances post a 5.66% CAGR as Apple, Dell, and Samsung shift to fiber-based protective inserts.
How fragmented is the supplier base?
The top five companies hold about 35% share, reflecting moderate consolidation and room for regional specialists.
Page last updated on:


