
Rail Components Market Size and Share
Market Overview
| Study Period | 2020 - 2031 |
|---|---|
| Market Size (2026) | USD 84.89 Billion |
| Market Size (2031) | USD 100.94 Billion |
| Growth Rate (2026 - 2031) | 3.52 % |
| Fastest Growing Market | Asia Pacific |
| Largest Market | Asia Pacific |
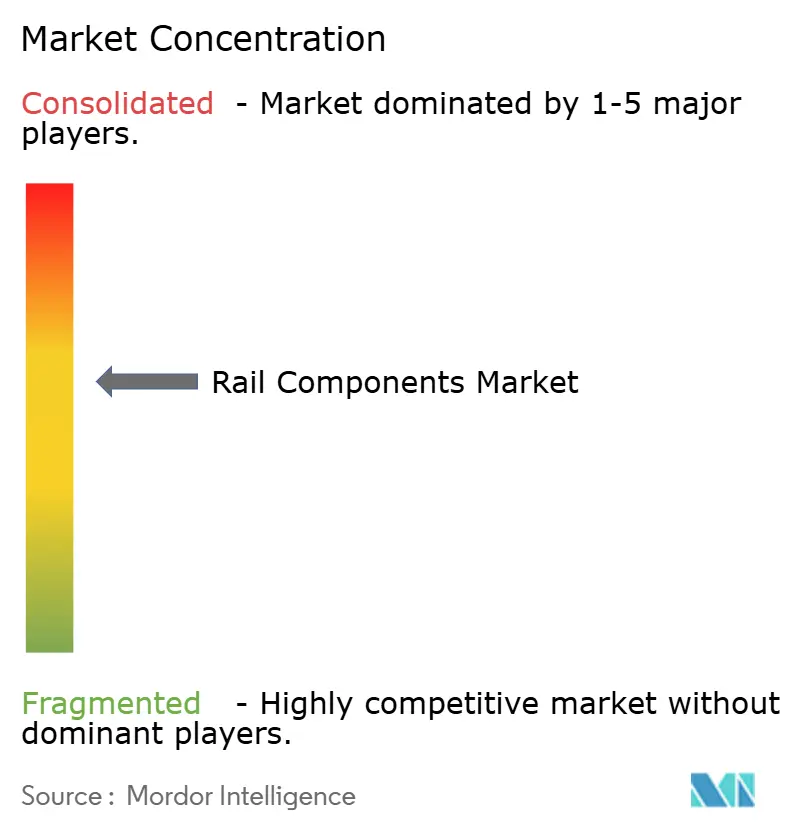
| Market Concentration | Medium |
Major Players *Disclaimer: Major Players sorted in no particular order Image © Mordor Intelligence. Reuse requires attribution under CC BY 4.0. | |
Rail Components Market Analysis by Mordor Intelligence
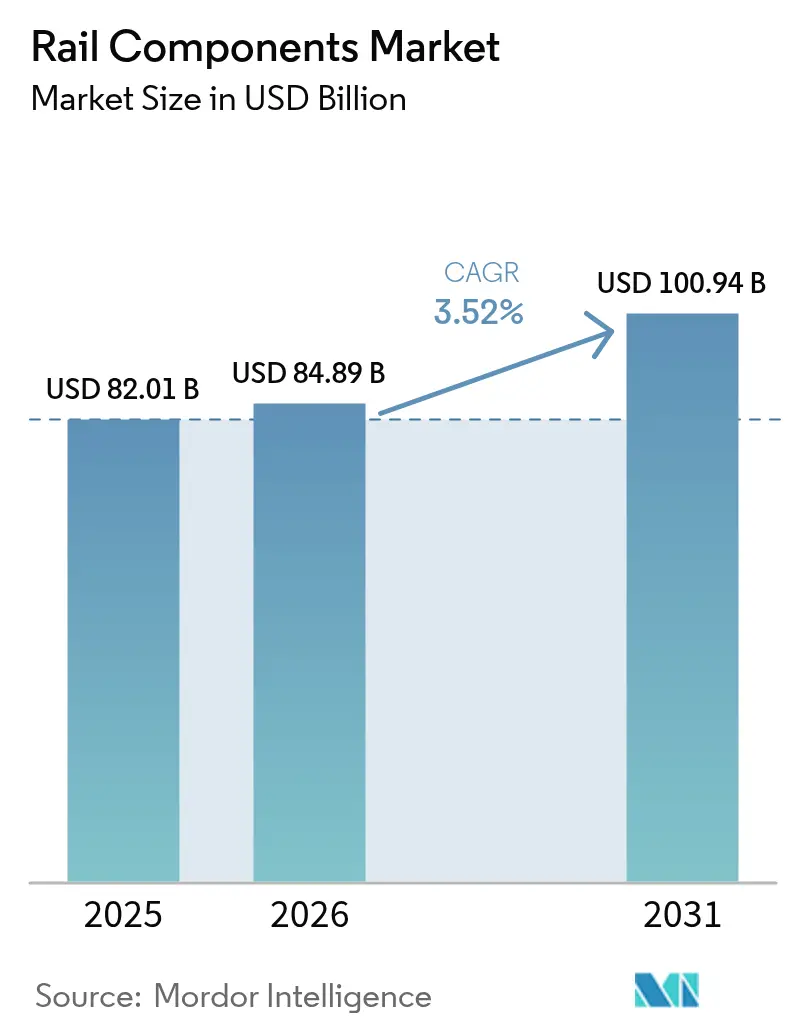
The rail components market size is expected to grow from USD 82.01 billion in 2025 to USD 84.89 billion in 2026 and is forecast to reach USD 100.94 billion by 2031 at 3.52% CAGR over 2026-2031. Continued public-sector spending on high-speed corridors, mandatory fleet renewal to satisfy new safety and noise rules, and life-cycle service contracts keep demand resilient even as the sector matures. Asia-Pacific’s procurement momentum, Europe’s compliance-driven replacement programs, and North America’s heavy-haul upgrades collectively underpin stable order books. Cost-competitive Asian suppliers are intensifying price pressure on traditional European manufacturers, prompting wider vertical integration to secure critical components and tamp down input volatility. Supply-chain fragility around semiconductors and specialty steel accelerates multi-sourcing strategies, while digital twin adoption reshapes maintenance economics by cutting unscheduled downtime.
Key Report Takeaways
- By component, bogies accounted for 33.62% of the rail components market share in 2025, and are also the fastest-growing at a 3.85% CAGR through 2031.
- By train type, urban transit systems held 41.35% of the rail components market share in 2025, whereas high-speed trains are growing the fastest at a 6.34% CAGR through 2031.
- By transit mode, passenger applications commanded 62.40% of the rail components market share in 2025 and are projected to rise at a 4.92% CAGR to 2031.
- By material, carbon steel commanded 45.35% of the rail components market share in 2025, while composites and polymers are projected to rise at a 5.22% CAGR to 2031.
- By end-user, the aftermarket/MRO segment captured 58.62% of the rail components market share in 2025, while OEM procurement is expanding at a 6.02% CAGR to 2031.
- By geography, Asia-Pacific led with 38.65% of the rail components market share in 2025, and its 4.05% CAGR makes it the fastest-expanding regional market through 2031.
Note: Market size and forecast figures in this report are generated using Mordor Intelligence’s proprietary estimation framework, updated with the latest available data and insights as of 2026.
Global Rail Components Market Trends and Insights
Drivers Impact Analysis*
| Driver | (~) % Impact on CAGR Forecast | Geographic Relevance | Impact Timeline |
|---|---|---|---|
| Government-Backed High-Speed Rail | +1.2% | Asia-Pacific, Middle East, select European corridors | Long term (≥ 4 years) |
| Rising Megacity Rail Procurement | +0.9% | Global, concentrated in Asia-Pacific and South America | Medium term (2-4 years) |
| Fleet Renewal for Safety | +0.8% | Europe, spillover to aligned markets | Medium term (2-4 years) |
| Digital Twins for Maintenance | +0.4% | Global, early adoption in North America and Europe | Medium term (2-4 years) |
| Heavy-Haul Axle-Load Limits Jump | +0.3% | Australia, Brazil, select mining corridors | Short term (≤ 2 years) |
| 5G/IoT Drives On-Train Power | +0.2% | Global, led by developed markets | Long term (≥ 4 years) |
| Source: Mordor Intelligence | |||
Government-Backed High-Speed Rail Build-Outs
Sovereign infrastructure programs channel significant investments in annual rail procurement into high-speed projects. Egypt’s 41-train Velaro deal and 2,000 km network illustrate the scale of single-country spending. By 2040, Morocco plans to expand its rail network with an addition of 1,300 km of high-speed lines and 3,800 km of conventional tracks under its "Railway Plan 2040. The 2,117 km GCC Rail line will require standardized train platforms for cross-border compatibility, tilting awards toward incumbents such as Siemens, Alstom, and CRRC that can bundle rolling stock with signaling and long-term service packages. These mega-projects lengthen revenue visibility for prime contractors and pull local suppliers into global value chains.
Rising Metro and Light-Rail Procurement in Megacities
Global urban rail project pipelines with fully automated lines setting new technical baselines. Riyadh Metro’s two driverless lines showcase automation’s cost-efficiency and passenger-service upside [1]“Riyadh Metro Operations,” RATP Dev, ratp.fr. Brazil’s urban rail ridership rebounded to a notable number of passengers in 2024, underscoring demand for rolling stock upgrades and capacity injections. Automated train operation is moving from pilot to procurement requirement, forcing manufacturers to integrate signaling, cybersecurity, and passenger information systems within a unified platform.
Fleet Renewal to Meet EU TSI Noise and Safety Mandates
Technical Specifications for Interoperability deadlines are compressing replacement cycles as operators race to certify vehicles for multi-country use. The European Union Agency for Railways processed 1,800 vehicle authorizations in 2023; most of these authorizations involved cross-border service [2]“Vehicle Authorisations 2023,” European Union Agency for Railways, era.europa.eu. ETCS retrofits create an aftermarket spike that favors OEMs with upgrade kits and in-house installation teams. Noise regulation under UTP NOI 2021 pushes freight wagons that pre-date modern brake blocks out of urban corridors. Manufacturers delivering low-noise bogies and certified acoustic packages are securing premium pricing and multi-year frame agreements.
Digital-Twins for Bogie Predictive Maintenance
Real-time sensor suites feeding cloud-based analytics are shrinking unplanned bogie outages. OEMs now bundle digital-twin dashboards with rolling stock deliveries, creating annuity-like software revenue. Operators gain higher fleet availability, while component makers secure data rights that support product refinement and aftermarket upselling.
Restraints Impact Analysis*
| Restraint | (~) % Impact on CAGR Forecast | Geographic Relevance | Impact Timeline |
|---|---|---|---|
| Volatile Steel and Copper Prices | -0.6% | Global, price-sensitive markets | Short term (≤ 2 years) |
| Semiconductor Shortages for Electronics | -0.4% | Global, high-tech rolling stock | Medium term (2-4 years) |
| Persistent Homologation Delays | -0.3% | Europe, Asia-Pacific | Medium term (2-4 years) |
| Funding Squeeze for Freight | -0.2% | Sub-Saharan Africa | Long term (≥ 4 years) |
| Source: Mordor Intelligence | |||
Volatile Steel and Copper Input Prices
Steel and copper account for a significant share of raw-material costs in new rolling stock, and annual steel price swings complicate fixed-price contracts. Copper spikes undermine traction-system margins because electrical content is non-negotiable. The Red Sea shipping disruption that delayed Indian Railways’ forged-wheel imports illustrates geographic supply vulnerabilities. Manufacturers hedge with long-term offtake agreements but sacrifice flexibility and working-capital efficiency.
Semiconductor Shortages for Traction Electronics
Rail OEMs compete with automotive and consumer-electronics firms for railway-grade chips. Lead times for traction inverters have stretched to 12 months, compelling rolling stock builders to redesign around alternative controllers or hold larger inventories, both of which inflate working capital and engineering expense.
*Our forecasts treat driver/restraint impacts as directional, not additive. The impact forecasts reflect baseline growth, mix effects, and variable interactions.
Segment Analysis
By Component: Bogie Systems Drive Technical Innovation
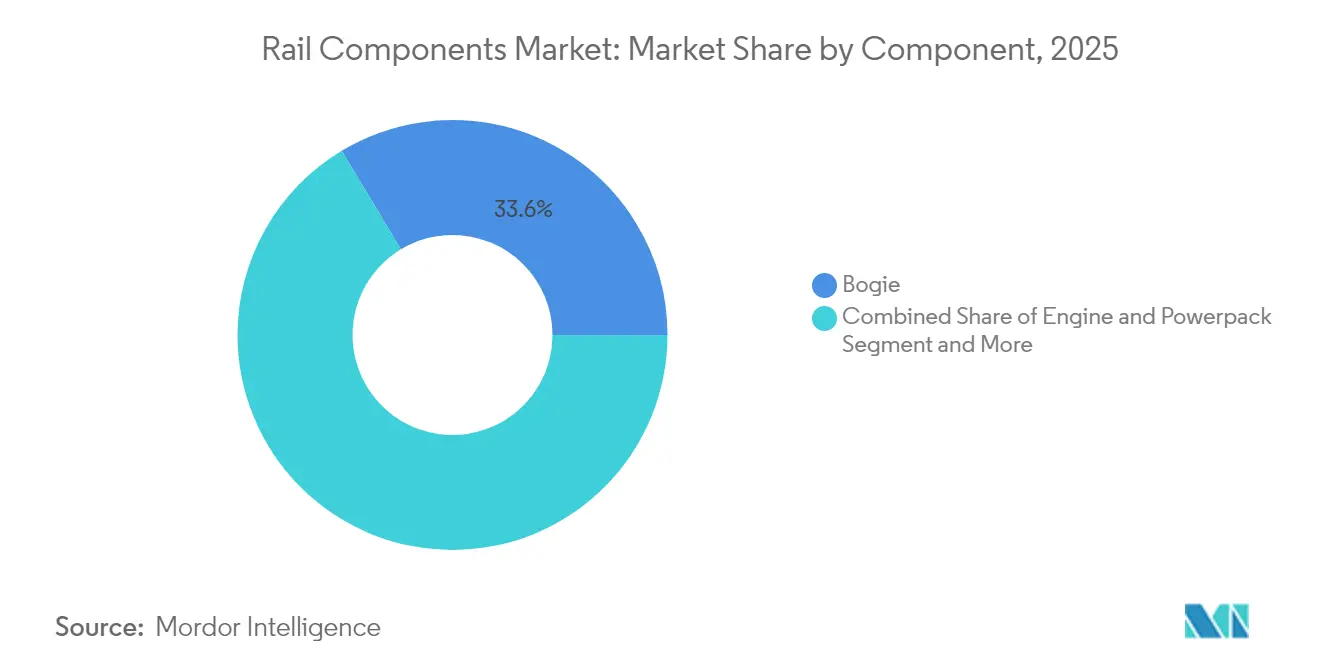
Bogie assemblies represented 33.62% of the rail components market share in 2025 in the rail components market and are forecast to grow at 3.85% through 2031. Their high share reflects the bogie’s central role in ride stability, noise mitigation, and track-wear reduction. Regenerative braking modules bundled into bogies lower energy costs and add hardware value. Advanced suspension systems using active dampers improve passenger comfort and reduce lifecycle rail-surface damage, strengthening demand among metro and high-speed operators.
Software-ready bogies with embedded sensor ports are becoming the default specification as digital maintenance strategies proliferate. Wheelsets and axles engineered for 30 t loads target the lucrative heavy-haul niche. Meanwhile, aluminum and composite housings are gaining ground in high-speed sets where weight directly influences energy use. Brake, gearbox, and traction motor frames maintain premium pricing due to precision-machining tolerances and thermal-management requirements.



By Train Type: Urban Transit Leads While High-Speed Accelerates
Urban transit captured 41.35% of the rail components market share in 2025, mirroring municipal pushes to relieve congestion and cut emissions. Though smaller in absolute volume, high-speed and very-speed trains are poised for a 6.34% CAGR as new corridors come online across Asia and the Middle East.
Demand for mainline passenger stock remains steady with operators emphasizing comfort, Wi-Fi connectivity, and energy efficiency retrofits. Freight locomotives in North America focus on fuel-sipping prime movers, while European freight buyers seek last-mile hybrid traction. Wagon procurement moves in lockstep with commodity cycles, yet intermodal container platforms enjoy structural growth on rising e-commerce flows.
By Transit Mode: Passenger Segment Maintains Dominance
Passenger services accounted for 62.40% of the rail components market share in 2025, and will expand at a 4.92% CAGR to 2031, continuing to benefit from policies that shift travelers away from cars and short-haul flights. Government climate targets keep rail at the center of national decarbonization roadmaps, ensuring fresh tenders for metro, regional, and high-speed vehicles.
Freight rail’s share grows more modestly but gets strategic support through dedicated-corridor programs in India and China, which require specialized wagons and high-horsepower locomotives. Intermodal growth within the freight slice offers incremental upside as shippers seek lower-carbon logistics chains.
By Material: Steel Dominance Faces Composite Challenge
Due to cost and fabrication familiarity, carbon steel held a 45.35% of the rail components market share in 2025. Alloy steels are used for high-stress parts, but aluminum is penetrating high-speed and metro fleets eager to trim energy bills. Composites and polymers record the fastest 5.22% CAGR as operators pilot lightweight interiors and aerodynamic nose cones.
Certification hurdles and recyclability questions temper composite adoption, yet suppliers are developing bio-based resins and modular repair techniques that could unlock larger applications beyond 2030.

By End-User: Aftermarket Services Lead Revenue Generation
Aftermarket/MRO services held 58.62% of the rail components market share in 2025, demonstrating operators' focus on availability over asset count. Predictive analytics platforms moved from pilot to mainstream, letting service providers sell uptime guarantees instead of parts-and-labor billing.
OEM procurement outpaces at 6.02% CAGR, where fleets need replacement for compliance or expansion. New-build contracts increasingly bundle multiyear service obligations, blurring traditional lines between manufacturing and maintenance and creating sticky revenue streams for OEMs.
Geography Analysis
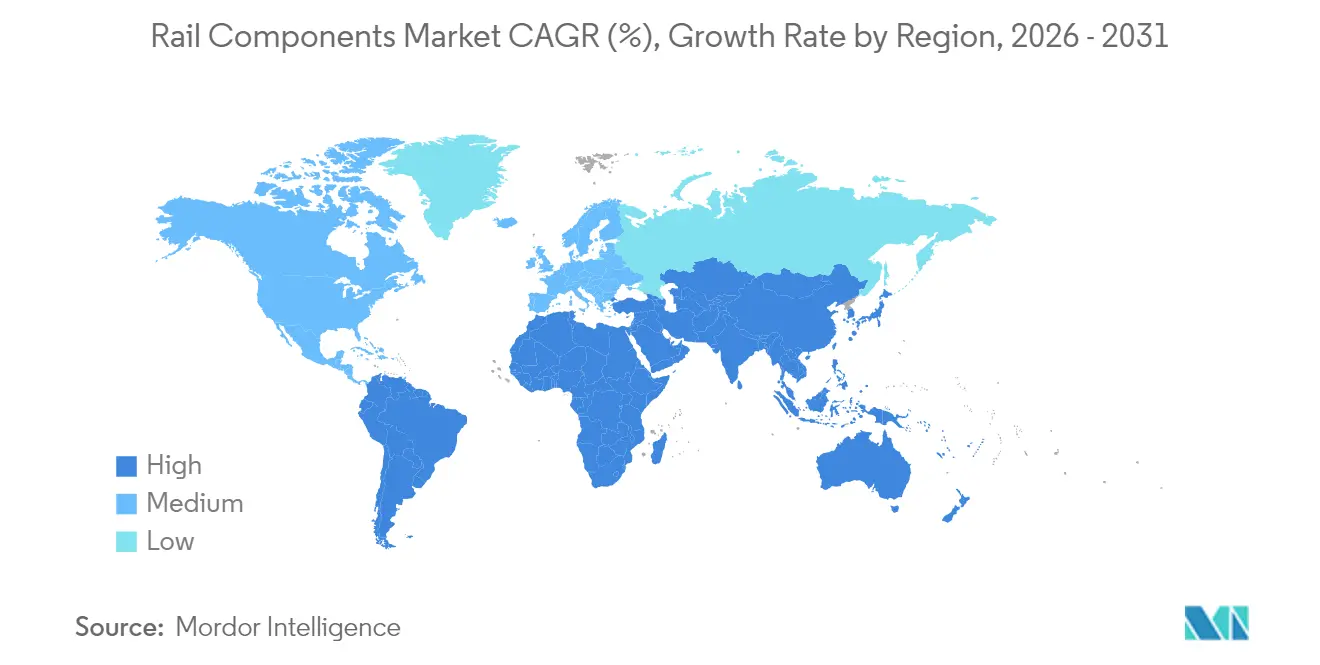
Asia-Pacific tops the rail components market with 38.65% share in 2025, and its 4.05% CAGR through 2031 remains above the global mean. China’s high-speed build-out and India’s metro launches drive headline numbers, while Japan’s Shinkansen heritage keeps domestic suppliers at the technology frontier. Korean manufacturers win export bids via aggressive financing and turnkey offers.
EU-funded green transport budgets and TSI-driven fleet replacement propel Europe's growth. Germany spearheads orders for hybrid regional multiple units, and France exploits its TGV export pedigree to secure overseas contracts. Eastern European projects gain momentum as Cohesion Fund disbursements accelerate, improving market access for pan-EU OEMs.
North America shows stable growth anchored in heavy-haul freight upgrades and selective passenger-rail modernization. The United States prioritizes fuel-efficient locomotives and infrastructure resilience, while Amtrak’s rolling stock overhaul presses ahead. Mexico explores passenger services on existing freight lines, but definitive project schedules hinge on regulatory clarity and federal funding.

Regulatory Landscape
Rail components are governed by safety, interoperability, and cybersecurity rules that shape both new-build specifications and retrofit content. In Europe, Technical Specifications for Interoperability (TSIs) and European Union Agency for Railways (ERA) authorization processes drive cross-border approvals, and ERA processed 1,800 vehicle authorizations in 2023, indicating how much compliance activity is tied to multi-country operations. Implemented Regulation (EU) 2026/693 updates testing specifications and transitional measures for ETCS and ATO on-board units, which reinforces the need for certified upgrade kits and validated software baselines in braking, control, and onboard electronics.
Interoperability alignment also runs through OTIF Uniform Technical Prescriptions (UTPs) under the APTU/ATMF framework, while Great Britain applies its Rail Technical Standards Framework and RSSB-led standards development. Communications and connectivity requirements are tightening as well: UIC updated FRMCS functional requirements (Version 2.1.0) in April 2025, and rail supply chains face added scrutiny from national-security style controls, such as the US Bureau of Industry and Security connected-vehicle restrictions finalized in January 2025 (relevant where rail platforms integrate connectivity hardware and software subject to country-of-origin constraints).
Value Chain Analysis
The value chain begins with raw materials (carbon and alloy steels, aluminum, copper) and critical sub-tier inputs (bearings, castings/forgings, elastomers, and semiconductor devices for traction and control electronics), then moves into machining, fabrication, and system integration for bogies, braking, couplers, HVAC, interiors, and onboard power and communication modules. Safety-critical qualification and homologation extend change cycles, with component validation commonly taking 1 to 2 years, which limits rapid supplier substitution and increases the impact of disruptions in specialty steel, forgings, and electronics.
Upstream risk is increasingly concentrated in electronics, where rail competes for shared semiconductor fabrication capacity. This has been associated with dual-sourcing, higher buffer inventories, and more vertically integrated programs among OEMs and Tier-1s. Midstream, localization and near-shoring initiatives are expanding manufacturing footprints and engineering capability, including India-focused capacity and capability additions that draw global suppliers into domestic ecosystems. Examples include Titagarh Rail Systems installing machinery to produce aluminum coach flat packs domestically (reducing reliance on imported assemblies) and the Pandrol Rahee Technologies joint venture laying out a growth roadmap with higher R&D allocation for smart track diagnostics and AI-driven maintenance. Downstream, operators and prime contractors increasingly procure through bundled packages that combine components with installation, software, and life-cycle service, reinforcing the aftermarket/MRO channel and supporting data-enabled maintenance offerings.
Competitive Landscape
The rail components market remains moderately concentrated, with CRRC, Siemens Mobility, Alstom, Stadler Rail, Hitachi Rail, and Wabtec controlling a notable share of global deliveries. CRRC exploits cost advantages at scale, penetrating South America and Africa through export financing linked to Belt and Road projects. Siemens and Alstom defend their share by doubling down on high-speed and signaling expertise that underpins premium pricing and multi-decade service contracts. Stadler capitalizes on modular designs to win regional rail and light-metro tenders in Europe and the United States.
Hitachi Rail’s acquisition of Thales Ground Transportation Systems extends its command-and-control capabilities, while Wabtec’s buyout of Dellner Couplers deepens its component portfolio[3]“Wabtec Buys Dellner Couplers,” Railway Gazette, railwaygazette.com. OEMs increasingly bundle rolling stock with cloud-based maintenance platforms and cybersecurity suites, differentiating on life-cycle cost rather than purchase price. Semiconductor scarcity and input-price swings validate vertical integration plays and raise capital intensity, favoring incumbents with strong balance sheets.
Regulatory compliance from ETCS Level 2 to cybersecurity standards poses high entry barriers. Established players leverage in-house certification teams to fast-track approvals, whereas newcomers face protracted homologation that dilutes margins and ties up engineering resources.
Rail Components Industry Leaders
CRRC Corporation Limited
Alstom SA
Siemens Mobility
Wabtec Corporation
Stadler Rail AG
- *Disclaimer: Major Players sorted in no particular order

Market Opportunities and Future Outlook
White space is emerging around compliance-driven retrofits and platform standardization, where certified subsystem upgrades (ETCS/ATO readiness, low-noise bogie packages, and cybersecurity-aligned onboard electronics) can be industrialized across mixed fleets. In Europe, ERA's high volume of cross-border vehicle authorizations and the ongoing evolution of ETCS/ATO test and transition rules under Implemented Regulation (EU) 2026/693 expand the addressable market for upgrade kits, validation services, and in-field installation capacity that component suppliers can monetize through multi-year service frameworks.
Infrastructure-led programs are also pulling demand through track, electrification, and train control systems, alongside the rolling stock deployed on upgraded corridors. In June 2026, the California High-Speed Rail Authority approved a consortium (Kiewit, Stacy Witbeck, and Herzog) for track, overhead contact systems, and train control installation in the Central Valley, while corridor initiatives such as Saudi Arabian Railways Landbridge show continued demand for standardized, modular subsystems and supplier qualification at scale. On the freight and heavy-haul side, railroads are funding network and asset upgrades directly, including BNSF Railway's USD 3.6 billion capital investment plan for 2026, which sustains component demand for wheelsets, braking, couplers, and electronics tied to reliability and maintenance productivity.
Recent Industry Developments
- July 2026: Unipart announced it will supply its Onboard Shunt Enhancer (OSE) technology to Siemens Mobility for the expanded Amtrak Airo fleet. The deal links a safety-critical onboard capability to a standardized train platform program, supporting deeper supplier integration into long-term fleet build and support cycles.
- September 2025: BEML placed a multi-system order with Knorr-Bremse covering braking, door, HVAC, and sanitary modules for an Indian metro project. The package nature of the order points to rising preference for integrated subsystem supply that can simplify commissioning and strengthen aftermarket pull-through for Tier-1s.
- January 2024: Wabtec won a USD 157 million brake-system contract from Siemens Mobility India for 1,200 9,000-HP electric locomotives for Indian Railways. This large-volume braking award highlights the scale of component demand tied to locomotive electrification and supports multi-year production planning for safety-critical systems.


Research Methodology Framework and Report Scope
Market Definition and Coverage
This market is defined as the value of components used to build, maintain, and upgrade rail systems, covering parts for rolling stock and core track related hardware that directly supports rail operations.
Scope exclusions: Excludes rail services, rail construction contracting, and full rail vehicles when sold as complete trainsets rather than as component-level revenue.
Segmentation Overview
- By Component
- Bogie
- Brake System
- Suspension System
- Wheel and Axle
- Gearbox and Traction Motor Frames
- Engine and Powerpack
- Couplers and Draft Gear
- Body Shell and Frames
- Interior and HVAC Modules
- Bogie
- By Train Type
- High-Speed and Very-High-Speed Trains
- Mainline Passenger (Inter-city)
- Urban Transit (Metro, LRT, Monorail)
- Freight Locomotives
- Freight Wagons
- By Transit Mode
- Passenger
- Freight
- By Material
- Carbon Steel
- Alloy and Stainless Steel
- Aluminum and Aluminum Alloys
- Composites and Polymers
- By End-User
- OEM
- Aftermarket / MRO
- By Geography
- North America
- United States
- Canada
- Mexico
- South America
- Brazil
- Argentina
- Rest of South America
- Europe
- Germany
- United Kingdom
- France
- Italy
- Russia
- Rest of Europe
- Asia-Pacific
- China
- India
- Japan
- South Korea
- Australia
- Rest of Asia-Pacific
- Middle East and Africa
- Saudi Arabia
- United Arab Emirates
- Turkey
- South Africa
- Egypt
- Rest of Middle East and Africa
- North America
Data Sources, Market Sizing, and Validation
Desk Research
Desk research starts with public infrastructure and transport statistics that help us map rail investment cycles and replacement demand. We typically refer to sources such as national transport ministries and rail regulators, the International Union of Railways (UIC), World Bank transport indicators, UN Comtrade for trade flows on relevant parts, and patent databases to track technology intensity and upgrade themes.
Beyond that, annual reports, 10-K style filings where available, investor presentations, and press releases are used to understand component revenue exposure and regional footprint. A paid subscription for company financials and intelligence is used selectively to normalize business line splits, and an import-export shipment-level database is used when trade signals are needed to sense-check regional supply. These desk sources are not exhaustive, and additional public references are reviewed for data collection, validation, and clarification.
Primary Interviews and Surveys
Primary work is used to pressure-test assumptions that are hard to observe in public data, especially mix shifts across component categories, pricing behavior, and aftermarket intensity. We speak with a spread of OEM-facing suppliers, aftermarket participants, distributors, and rail operator procurement and maintenance stakeholders across APAC, EMEA, and the Americas so gaps in secondary information can be closed and key variables can be triangulated.
Distribution of primary research fieldwork respondents
| Company type | Respondent position | Region |
|---|---|---|
| Top tier: 35% | CXOs: 14% | APAC: 50% |
| Mid tier: 50% | Functional/Unit leaders: 31% | EMEA: 29% |
| Smaller Players: 15% | Managers: 55% | Americas: 21% |
Market-Sizing & Forecasting
Market sizing is built using a top-down and bottom-up approach. We start with a demand-pool build that links rail network expansion and renewal budgets to component procurement and replacement needs. For rail components, we reconstruct the top-down logic through rolling stock production and refurbishment activity, track renewal and maintenance cycles, and region-level investment plans, then convert those volumes into value using pricing and mix assumptions.
To keep outputs realistic, we corroborate totals using selective bottom-up checks, such as sampling supplier revenues by rail component exposure, validating channel splits between OEM and aftermarket, and using indicative ASP x volume for commonly replaced parts. Key inputs used in the model include rail capex and renewal allocations, new rolling stock deliveries and retrofit rates, replacement intervals for track hardware and bogie related items, steel and other input-cost trends that influence pricing, and regional fleet utilization signals that affect maintenance intensity. Forecasts are developed using scenario analysis, where variables like public funding cadence, fleet modernization timing, and input cost direction are adjusted based on what interviewees expect and what public plans indicate. When bottom-up evidence is uneven in smaller regions, we handle gaps by applying proxy penetration rates and then re-checking against trade flows and operator spending signals.
Data Validation & Update Cycle
Validation is done through multiple checks so the final numbers do not rely on a single dataset or a single assumption. We compare model outputs against independent signals such as rolling stock delivery counts, rail renewal announcements, and trade and production directionality, then trace any large variance back to the driver that caused it.
Anomalies are reviewed in a multi-step internal process before sign-off, and follow-up outreach is triggered if a key variable moves outside the expected range, for example a sharp pricing change or a sudden shift in refurbishment activity. Reports are refreshed annually, and interim updates are made when material events occur, such as major public funding changes or supply disruptions. Before delivery, an analyst completes a fresh pass on the key inputs so clients receive the latest updated view.
Mordor Intelligence's Rail Components Market Estimate Compared With Other Published Estimates
Published market size numbers for rail components can look far apart because the underlying scope is not always the same, and because pricing and replacement assumptions are handled differently. Differences also come from the base year chosen, currency timing, and whether OEM and aftermarket are treated consistently across regions.
Some external estimates expand the definition to include broader rail equipment categories, along with signaling and communication systems that behave more like projects than repeatable parts demand. In Mordor Intelligence sizing, revenue is counted only for component-level sales tied to rolling stock and core track related hardware, and then it is validated against renewal cycles and production activity so one-off project inflation does not overstate the demand pool.
Benchmark comparison
| Source | Market Size | Gaps in Research Methodology |
|---|---|---|
| Mordor Intelligence | USD 84.89 B (2026) | |
| Global Consultancy A | USD 92.05 B (2025) | Uses a wider rail component construct that explicitly includes signaling, communications, and power supply elements, and it also reports a different base year, which shifts the value level and price assumptions. |
| Industry Publisher B | USD 65.99 B (2024) | Often leans on manufacturer-side production and sales reporting with limited visibility into aftermarket intensity, and it can undercount higher value replacement parts and pricing progression in regions with strong modernization programs. |
The spread across the three figures is largely explained by what gets counted as a component, and by how replacement demand and pricing are carried forward year to year. By keeping the demand pool tied to observable rail renewal and production signals, and then cross-checking with supplier exposure and channel splits, the estimate stays traceable and can be repeated when new inputs arrive.


Key Questions Answered in the Report
What is the forecast value of the railway rolling stock market in 2031?
The market is projected to reach USD 100.94 billion by 2031, advancing at a 3.52% CAGR.
Which region currently leads procurement?
Asia-Pacific commands 38.65% of global demand, fueled by China’s high-speed and India’s metro expansions.
Which segment holds the largest share?
Aftermarket/MRO services account for 58.62% of 2025 revenue, reflecting the sector’s focus on life-cycle optimization.
What train type is growing the fastest?
High-speed and very high-speed trains are set to expand at a 6.34% CAGR through 2031 on the back of new corridors in emerging markets.
Page last updated on:


 Your data is secure and never sold or shared.


