
Automotive Terminals Market Size and Share
Market Overview
| Study Period | 2020 - 2031 |
|---|---|
| Market Size (2026) | USD 28.59 Billion |
| Market Size (2031) | USD 56.22 Billion |
| Growth Rate (2026 - 2031) | 14.48 % |
| Fastest Growing Market | Asia Pacific |
| Largest Market | Asia Pacific |
| Market Concentration | Medium |
Major Players *Disclaimer: Major Players sorted in no particular order Image © Mordor Intelligence. Reuse requires attribution under CC BY 4.0. | |
Automotive Terminals Market Analysis by Mordor Intelligence
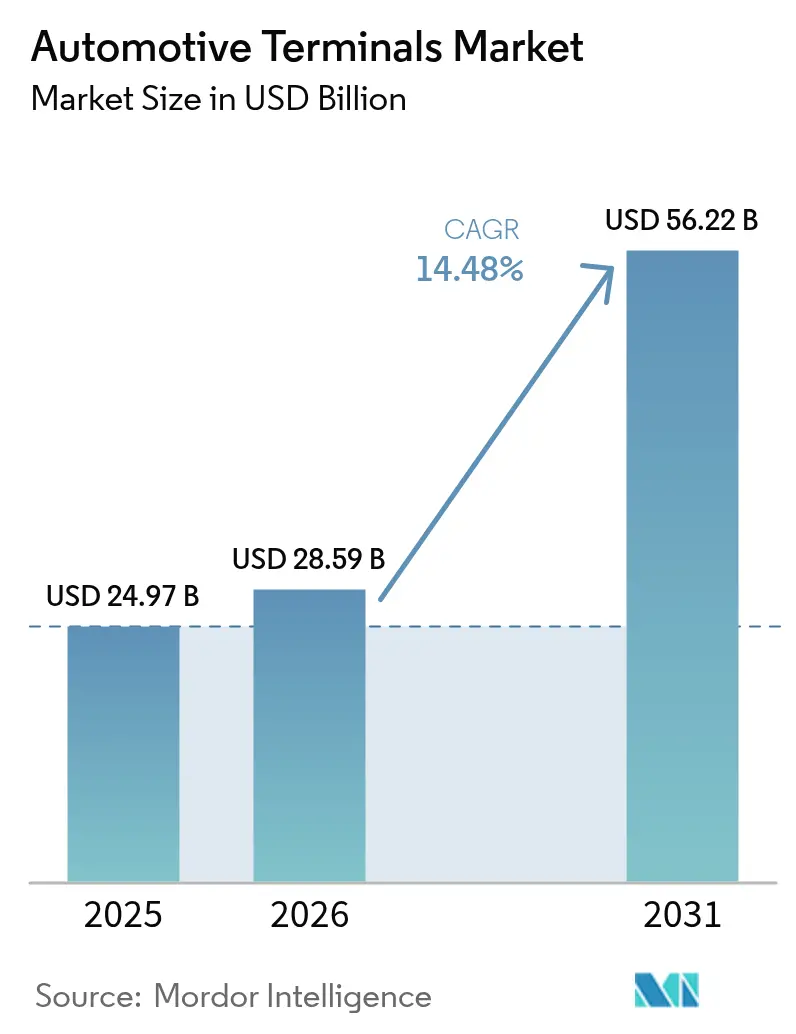
The Automotive Terminals Market size was valued at USD 24.97 billion in 2025 and estimated to grow from USD 28.59 billion in 2026 to reach USD 56.22 billion by 2031, at a CAGR of 14.48% during the forecast period (2026-2031). A rapid shift toward 48 V low-voltage architectures, exemplified by Tesla’s Low-Voltage Connector Standard that reduces connector SKUs to six while still covering more than 90% of signal and power needs, is compressing weight, cutting material usage, and accelerating harness automation. Terminal suppliers also benefit from ADAS proliferation, with retrofit programs in North America and Europe raising aftermarket demand for data-grade, shielded micro-connectors capable of multigigabit transmission. Meanwhile, copper-intensive battery systems require three times the conductor mass of internal-combustion platforms, pushing OEMs to lock multi-year supply contracts even as volatile spot prices pressure gross margins
Key Report Takeaways
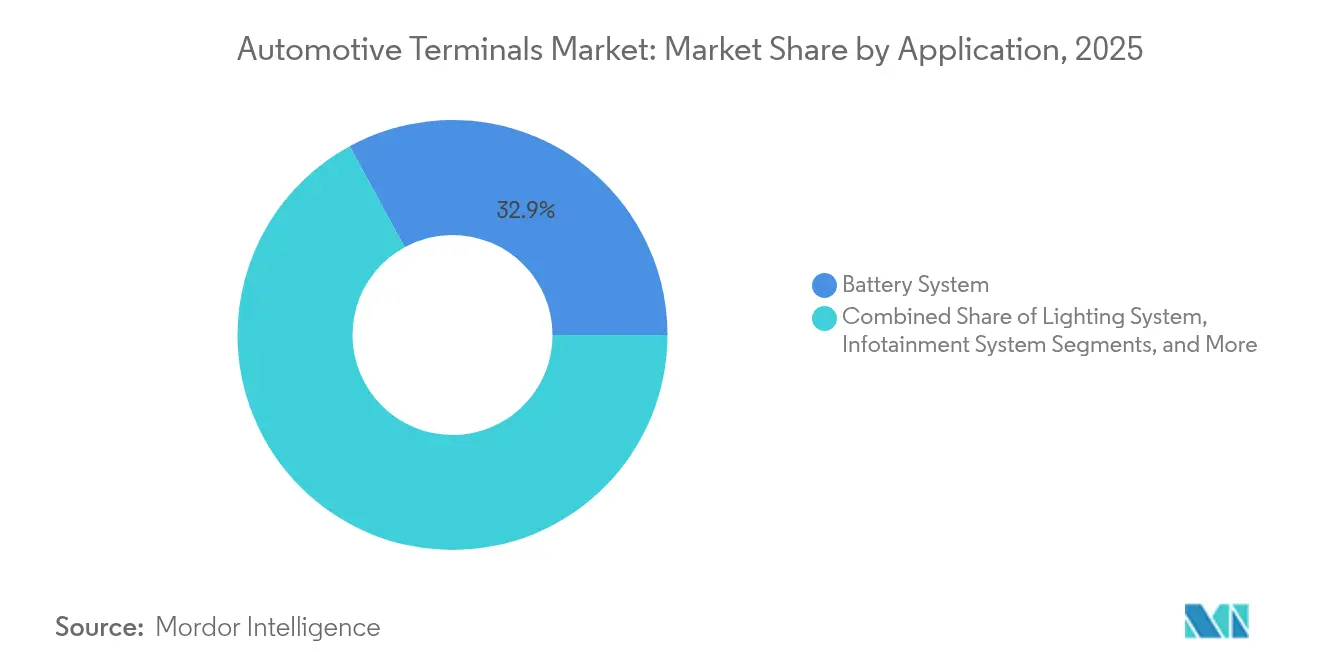
- By application, battery systems led with a 32.94% of the automotive terminals market share in 2025; safety and ADAS are projected to expand at a 14.62% CAGR through 2031.
- By vehicle type, passenger cars held 64.12% of the automotive terminals market share in 2025 and are expected to record the fastest growth at 15.29% through 2031.
- By terminal type, ring terminals commanded a 29.36% automotive terminals market share in 2025; micro ring variants are set to grow at a 15.27% CAGR through the forecast period.
- By material, copper captured 55.98% of the automotive terminals market size in 2025 and is forecast to rise at a 14.91% CAGR as EV platforms consume three times more copper per unit than ICE vehicles.
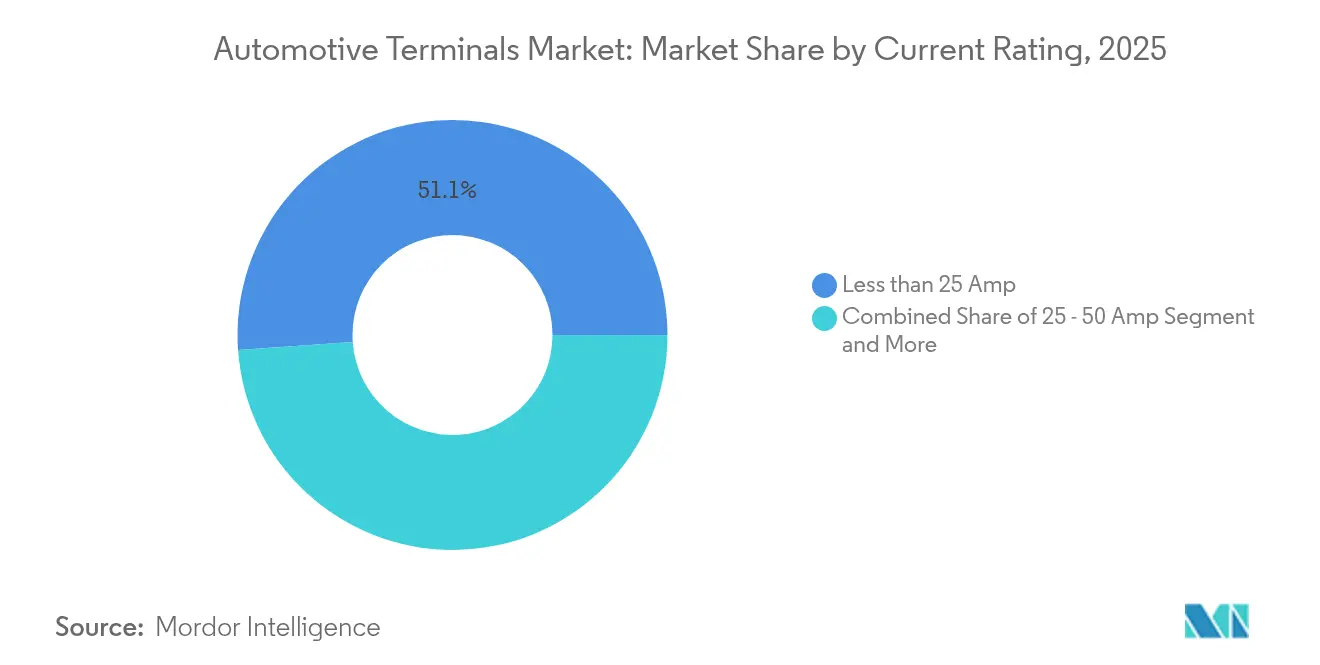
- By current rating, terminals rated below 25 amps led with 51.12% of the automotive terminals market share in 2025, while terminals handling more than 50 amps are forecast to expand at a 15.08% CAGR through 2031.
- By sales channel, the OEM segment dominated with 84.12% of the automotive terminals market share in 2025, whereas it is projected to register a 14.74% CAGR during the same period.
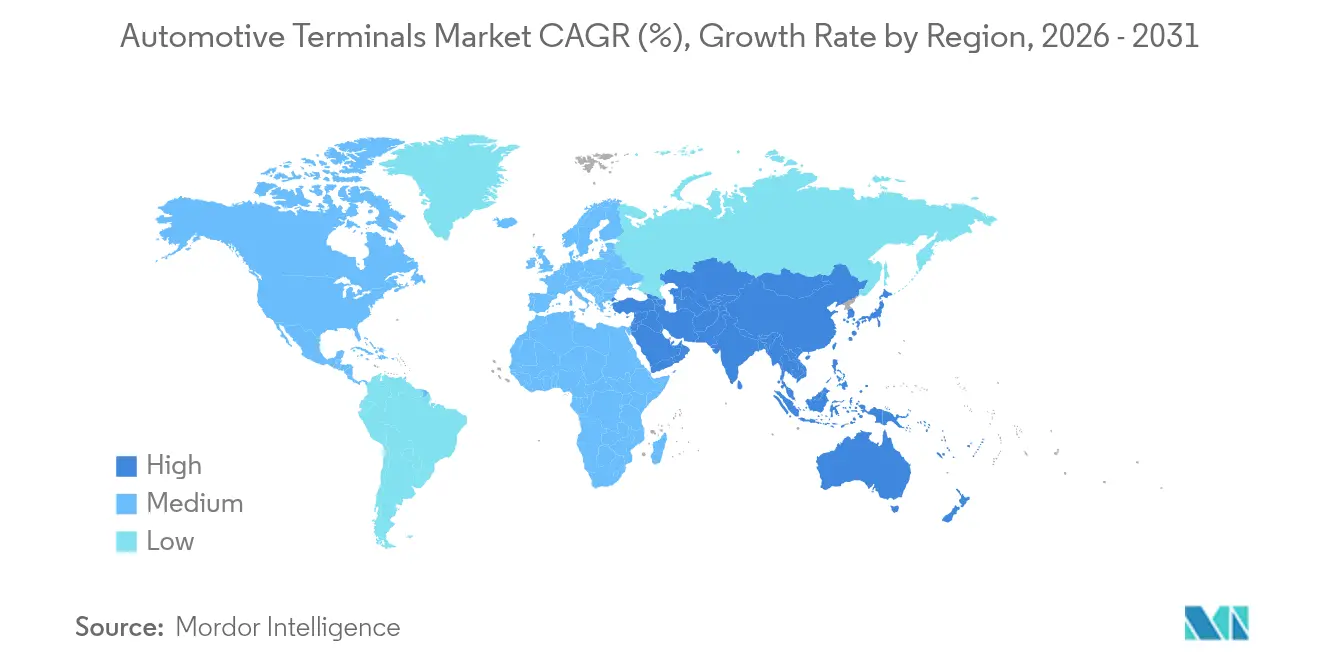
- By geography, Asia–Pacific captured 37.42% of the automotive terminals market share in 2025 and is expected to post the fastest 14.83% CAGR to 2031 on the back of integrated EV supply chains across China, Japan, and India.
Note: Market size and forecast figures in this report are generated using Mordor Intelligence’s proprietary estimation framework, updated with the latest available data and insights as of 2026.
Market Trends and Insights
Drivers Impact Analysis of Automotive Terminals Market*
| Driver | (~) % Impact on CAGR Forecast | Geographic Relevance | Impact Timeline |
|---|---|---|---|
| Electrification-Led Explosion | +4.2% | Global, Asia-Pacific leadership | Medium term (2-4 years) |
| Shift to 48 V Electrical Architectures | +3.1% | North America and EU luxury segments | Medium term (2-4 years) |
| ADAS Retrofit Kits Creating Aftermarket Demand | +2.8% | North America and EU | Short term (≤ 2 years) |
| Stringent ISO 19642 Harness Standards | +1.9% | Global, EU regulatory leadership | Long term (≥ 4 years) |
| Solid-State Battery BMS | +1.7% | Asia-Pacific core, spill-over global | Long term (≥ 4 years) |
| Automaker Pushes for Crimp-Less Laser-Weld Terminals | +1.2% | Global manufacturing hubs | Medium term (2-4 years) |
| Source: Mordor Intelligence | |||
Electrification-Led Explosion in Low-Voltage Connection Points
Vehicle electrification multiplies the number of low-voltage nodes: a contemporary battery electric platform integrates more than 200 distinct connection points against fewer than 100 in conventional 12 V cars.[1]“Global EV Outlook 2025,” International Energy Agency, iea.org Battery management systems is growing at a robust CAGR, demanding ultra-compact terminals that monitor cell voltage and temperature at millisecond intervals. The higher current density of 48 V distribution increases the thermal load on contact surfaces, prompting the adoption of new tin-silver plating recipes that sustain 100 A continuous loads without fretting corrosion. Commercial fleets extend this demand signal, retrofitting 48 V electric turbochargers and regenerative accessories that add four to six new harness branches per vehicle.
Shift to 48 V Electrical Architectures in Premium Vehicles
BMW, Mercedes-Benz, and Volvo now fit 48 V subsystems across all premium models launched since mid-2024, delivering power for active chassis, e-turbochargers, and zone controllers without oversizing wire gauges. Harness weight falls by up to 19 kg per vehicle, translating to 0.3 L/100 km fuel savings or extended EV range when paired with auxiliary electrics.[2]“48-Volt Mild Hybrid Architecture Whitepaper,” Mercedes-Benz Group AG, mercedes-benz.com Tesla’s LVCS proves that a 48 V backbone can coexist with legacy 12 V loads through DCDC nodes, allowing phased migration that protects aftermarket compatibility. Terminals must now guarantee 60 V DC dielectric strength while remaining backward-compatible with existing crimp tooling.
ADAS Retrofit Kits Creating Aftermarket Demand Spikes
Mandatory fitment of autonomous emergency braking and forward-collision warning in US and EU light vehicles by 2026 creates a retrofit boom for 2015-2022 model years. Older vehicles require in-line converters that bridge legacy CAN networks with new LVDS camera feeds, raising connector complexity and favoring professional installers over DIY solutions. Terminal suppliers can price a premium over OEM contract rates because retrofit kits bundle specialized brackets, seals, and calibration software.
Stringent ISO 19642 Harness Standards Accelerate Terminal Redesign Cycles
The ISO 19642 series upgrades EMC, vibration, and environmental benchmarks, pushing terminal designs toward higher-temperature insulators and stronger pull-out retention. Meeting Class E requirements means surviving 240 hours of salt-spray exposure without more than 5 mΩ resistance increase, driving adoption of nickel-phosphorus coatings first commercialized by TE Connectivity in 2024. The DIN 72036 automation guideline, ratified in June 2024, sets 60 best-practice clauses that reduce line-side SKU counts and enable 42% faster gripper change-overs on harness assembly cells.
Restraints Impact Analysis of Automotive Terminals Market*
| Restraint | (~) % Impact on CAGR Forecast | Geographic Relevance | Impact Timeline |
|---|---|---|---|
| Copper Price Volatility | –2.1% | Global, Asia-Pacific manufacturing impact | Short term (≤ 2 years) |
| OEM Migration to Consolidated Connector Blocks | –1.8% | Global, led by European efficiency drives | Medium term (2-4 years) |
| Reliability Issues in Aluminum-Alloy Ring Terminals for EV | –1.3% | North America and EU premium EV programs | Medium term (2-4 years) |
| Skills Gap in Automated Crimp-Force Monitoring | –1.0% | Asia-Pacific, especially emerging production hubs in ASEAN | Short term (≤ 2 years) |
| Source: Mordor Intelligence | |||
Copper Price Volatility is Squeezing Terminal BOM Margins
Copper averaged USD 10,800 per tonne in early 2024. Early 2025 saw rising copper prices due to U.S. tariffs and a weaker dollar, but fears of a global slowdown and China’s retaliatory tariffs have weighed heavily on prices and demand outlooks. Chinese smelters face tightening concentrate availability after the closure of Chilean open-pit pits with declining ore grades, forcing fabricators to negotiate quarterly price escalators. Recycling helps offset volatility: US brass-rod mills certified average recycled content more than four fifth of the amount in 2025, reducing primary copper exposure by 38 kt.
OEM Migration to Consolidated Connector Blocks Reduces Terminal Counts
Zonal architectures regroup sensors and actuators by physical region rather than function, allowing a single 96-pin header to replace up to 14 discrete connectors per vehicle corner.[3]“Zonal Architecture Integration Reference Design,” BMW Group, bmwgroup.com While consolidated blocks simplify assembly and quality control, they squeeze unit volumes for commodity ring and spade parts historically sold by the hundreds per vehicle. Suppliers respond by investing in hybrid power-signal modules where higher average selling prices offset lower counts. Automation also raises performance tolerances: connector blocks integrate over-molded seals and latch position assurance features that require new tooling and pull-test protocols.
*Our forecasts treat driver/restraint impacts as directional, not additive. The impact forecasts reflect baseline growth, mix effects, and variable interactions.
Automotive Terminals Market Segment Analysis
By Application:
Battery Systems Drive Electrification DemandBattery systems contributed 32.94% of the automotive terminals market share in 2025, underscoring their status as the most terminal-intensive sub-system across the automotive terminal market. Unit growth stems from cell-level sensing and rising pack voltages that push contact density beyond 1,400 pins in next-generation skateboard chassis. Safety & ADAS is growing at 14.62% CAGR through 2031 because each camera and radar module adds four to six shielded connections.
Emerging solid-state packs drive micro-terminal adoption, whose pitch falls below 0.35 mm, generating premium pricing. HVAC and comfort segments, despite their modest share, gain relevance as 48 V blowers, seat heaters, and heat pumps switch to brushless motors, lifting current draw and prompting copper busbar integration.



By Vehicle Type:
Passenger Cars Accelerate ElectrificationPassenger cars contributed to 64.12% of the automotive terminals market share in 2025, growing at 15.29% CAGR as stricter CO₂ targets favor zero-tailpipe solutions. Light commercial vehicles (LCV) also grow steadily as parcel operators electrify last-mile fleets to comply with urban low-emission zones. Motorcycles and scooters leverage swappable battery platforms that spur standardization of IP67 sealed DC terminals.
Fleet operators measure lifecycle economics rigorously: every unscheduled roadside repair on high-utilization LCVs costs fairly in delivery penalties, incentivizing premium high-cycle terminals. Aptiv’s CTCS heavy-duty connectors survive 30.6 G vibration and temperatures from –40 °C to +140 °C, offering uptime advantages that justify 14–18% price premiums in total-cost-of-ownership models.
By Terminal Type:
Miniaturization Drives InnovationRing terminals still lead with a 29.36% share of the automotive terminals market size in 2025, proving indispensable for chassis grounding and high-current battery lugs despite packaging pressures. Spade terminals remain a commodity staple for relay and fuse boxes, but now incorporate secondary lock features to meet ISO 19642 pull-out mandates. Quick-connect tabs gain favor in fully automated harness lines because tool-free mating supports shorter takt times.
Micro ring terminals register the strongest 15.27% CAGR by enabling board-to-cable interfaces inside BMS and inverter assemblies where millimeter clearances prevail. Average terminal pitch contracted from 1.5 mm in the 1980s to 0.50 mm in 2024 and will reach 0.35 mm by 2027, necessitating vision-guided crimp presses. Mini-coax automotive solutions from Aptiv provide up to 80% footprint savings while delivering 20 GHz bandwidth, supporting 8-MP camera streams essential for Level-3 automated driving.
By Material:
Copper Dominance Despite AlternativesCopper retained a 55.98% share of the automotive terminals market size in 2025, growing 14.91% CAGR as EVs triple the conductor mass per vehicle versus ICE counterparts. Brass holds a significant share and benefits from lead-free alloy innovation; Wieland’s eco SZ3 alloy retains more than four-fifths of copper’s conductivity while eliminating RoHS-restricted lead. Exotic alloys are growing rapidly because solid-state packs and high-temperature zones require specialty high-fatigue materials like beryllium copper.
US mills with over 90% recycled content now win sourcing preference in three leading OEM scorecards. Nonetheless, copper remains irreplaceable for high-current lugs and fast-charging interfaces where resistive losses equate directly to thermal derating and warranty liabilities.
By Current Rating:
High-Power Applications to Lead GrowthLess than 25 A parts constituted 51.12% of the automotive terminals market share in 2025, serving infotainment and body-control circuits. Terminals above 50 A grow the fastest at 15.08% CAGR, catalyzed by 800 V drivetrains and megawatt truck chargers. The 25–50 A bracket with a moderate share addresses e-compressors and on-board chargers in plug-in hybrids.
Next-gen blade terminals from TE Connectivity now manage 100 A continuous at 85 °C ambient with less than 35 °C temperature rise, a prerequisite for high-duty cycle urban buses that recharge multiple times daily. Solid-state battery packs need precision current sensing; premium terminals embed shunt elements that keep more or less than 1% measurement accuracy.
By Sales Channel:
OEM Integration DominatesOEM procurement channels accounted for 84.12% of the automotive terminals market share in 2025, reflecting in-house harness design and stringent PPAP quality flows requiring close supplier collaboration. Growth to 2031 runs at 14.74% CAGR as global light-vehicle output rebounds above 100 million units.
The aftermarket relies heavily on professional installers because modern vehicles integrate multiplexed networks that hinder DIY repairs. ADAS retrofits alone will inject significantly into aftermarket terminal spending between 2025 and 2030. Distributor alliances like Mouser–Yazaki widen access to vehicle-grade terminals with next-day fulfillment, accelerating this channel’s relevance.
Geography Analysis
APAC Automotive Terminals Market
Asia–Pacific dominated with a 37.42% automotive terminals market share in 2025 and is showcasing the fastest 14.83% CAGR through 2031, underpinned by China’s control of global new-energy vehicle production. Japan’s tier-one suppliers leverage decades of lean manufacturing to ship precision-stamped contacts with single-digit PPM defect rates to global OEMs. Southeast Asian nations such as Indonesia and Thailand recorded triple-digit EV registration growth in 2024, prompting OEMs to localize connector and wire-harness production.
Europe Automotive Terminals Market
Europe, even after regional automotive revenue fell short amid inflation and energy-cost headwinds. Strict fleet CO₂ rules lift EV sales to an expected figure in 2025, feeding demand for high-power charging terminals and data-grade board-to-board connectors, etc. Germany targets 873,000 new EV registrations, cementing local-content requirements for terminal suppliers. The region’s regulatory leadership through ISO 19642 and DIN 72036 gives compliant vendors a first-mover edge even as economic stagnation tempers near-term margins.
MEA and South America Automotive Terminals Market
An aging vehicle parc keeps the aftermarket vibrant and accelerates ADAS retrofit kit sales that rely on premium shielded connectors. General Motors’ USD 4 billion plant overhaul, Hyundai’s USD 21 billion multiyear expansion, and Clarios’ investment strategy guarantee a steady pull for advanced 48V and 800V terminals. Middle East & Africa and South America collectively contributed a affairly decent share in 2024, with South America portraying steady growth on the back of Brazil’s CO₂ mandates and Argentina’s lithium-mining incentives. Saudi Arabia and the United Arab Emirates use local-content policies within nascent EV assembly programs to stimulate regional cable and terminal manufacturing clusters.

Regulatory Landscape
Automotive terminals are governed by a combination of global harness and connector standards, along with region-specific vehicle safety and trade measures that affect terminal design validation, sourcing, and documentation. ISO 8092-2:2023 defines terminology, test methods, and performance requirements for road-vehicle on-board electrical wiring harness connections, while the ISO 19642 series tightens EMC, vibration, and environmental benchmarks that drive redesign cycles for plated contact surfaces and retention features. In North America, SAE/USCAR performance specifications such as USCAR2-6 (revised in December 2024) formalize performance testing for low-voltage automotive electrical connector systems and reinforce PPAP-style validation expectations for terminal families used across 12 V and emerging low-voltage subsystems.
Electrified powertrains add further compliance anchors for high-current and high-voltage terminals and inlets. In Europe, type-approval under the EU framework (Regulation (EU) 2018/858 and its Annex updates) increasingly references electric safety expectations aligned with newer regulatory acts, while UN Regulation No. 100 sets uniform provisions for electric power train safety, including requirements that affect electrical connectors and vehicle inlets used in EV architectures. Trade policy also influences cost and localization decisions: in the United States, Section 232 measures on automobile parts were updated via Proclamation 10908 (March 2025), and the Bureau of Industry and Security opened an inclusions window from April 1 to April 14, 2026, creating a recurring process for companies seeking tariff relief for specific covered auto parts, including electrical components in the terminals and connectors supply chain.
Competitive Landscape
The market is moderately concentrated, with the top five players holding a substantial share. TE Connectivity leads with extensive in-house stamping and plating, aiding rapid scale-up of 48 V and 800 V connectors for global platforms. Aptiv differentiates through its mini-coax and CTCS high-vibration portfolio, winning high-margin ADAS socket content on multiple luxury EVs. Yazaki leverages Japanese kaizen discipline and global production footprints, notably its 22-plant Indian network, to deliver cost-competitive yet high-quality standard terminals.
Competition now hinges on technology convergence. Laser-weld alternatives to traditional crimping, offered by newcomers such as Photon Weld, promise 35% lower scrap rates and are under assessment at two European OEMs. Semiconductor vendors like ROHM enter the domain by packaging SiC power stages with pre-mated high-current terminals, blurring lines between components and connectors.
Strategic collaborations proliferate. Rockwell Automation’s control stack will run NEO Battery Materials’ 240-ton silicon-anode facility, guaranteeing closed-loop quality records that terminal buyers increasingly demand for end-to-end traceability. Meanwhile, Chinese harness giants Wuling and Kuang-Chi partner with domestic machine-vision suppliers to automate inspection to 100% coverage, further compressing labor cost advantages of low-wage geographies.
Automotive Terminals Industry Leaders
TE Connectivity
Lear Corporation
Aptiv PLC
Yazaki Corporation
Sumitomo Electric Industries
- *Disclaimer: Major Players sorted in no particular order

Automotive Terminals Market Companies Covered in this Report
- TE Connectivity
- Lear Corporation
- Aptiv PLC
- Viney Corporation
- Furukawa Electric Co., Ltd.
- Grote Industries
- Keats Manufacturing Co.
- Sumitomo Electric Industries, Ltd.
- Yazaki Corporation
- Amphenol Corporation
- K.S. Terminals Inc.
- Hirose Electric Co., Ltd.
- Littelfuse, Inc.
- Samtec Inc.
- Würth Elektronik

Market Opportunities and Future Outlook
Electrification, 48 V migration, and higher data-rate ADAS and zone architectures are expanding the addressable whitespace for terminals that combine higher current capability with tighter packaging and automation-friendly assembly. Demand is concentrating in battery systems (32.94% share in 2025) and in higher-power nodes where terminals above 50 A are the fastest-growing current-rating bracket in the report context, pushing suppliers toward higher-temperature materials, improved plating stacks, and designs that fit automated crimp-force monitoring and DIN 72036-style harness automation practices. At the same time, OEM moves toward consolidated connector blocks and zonal architectures reduce the number of commodity terminals per vehicle corner, creating opportunity for hybrid power-signal modules, high-density multi-pin interconnects, and shielded micro-terminals for BMS, inverters, and software-defined vehicle ECU integration.
Investment and localization announcements provide evidence of where capacity is being placed for these terminal needs. In April 2026, JST announced a USD 500 million automated electronic connector manufacturing facility in Guntersville, Alabama, spanning injection molding, stamping, and assembly, which supports a North American build-out tied to supply-chain resilience. In June 2026, TE Connectivity opened a USD 150 million, 39,900 square meter automotive facility in Nantong, China, dedicated to high-voltage EV connectors and high-speed data connectivity components, reinforcing Asia-based scale for EV and ADAS interconnect content. In India, Hirose Electric signed an agreement in March 2026 to establish a new 1,700 square meter automotive connector manufacturing site in Chennai (production slated for summer 2027), while Sumitomo Electric Wiring Systems announced a USD 17 million expansion in Kentucky in July 2025 to add injection molding and automated assembly for electrical connectors. These moves point to near-term whitespace for terminal suppliers able to localize stamping and plating, support automated assembly, and deliver validated performance for 48 V, high-power charging, and high-speed data links.
Recent Industry Developments in Automotive Terminals Market
- April 2026: Sumitomo Electric Wiring Systems broke ground on a USD 17 million expansion of its Franklin, Kentucky, manufacturing facility to increase production capacity for terminals, connectors, and wiring harnesses. The added capacity supports higher terminal content per vehicle from electrification and ADAS wiring complexity. It also strengthens regional supply assurance for OEM harness programs in North America.
- February 2026: Lear Corporation reported securing multiple program awards across its wire and electronics and connection systems businesses, expanding its installed base of vehicle electrical distribution content. These awards reinforce demand for high-reliability terminals integrated into scalable connection architectures used by global automakers. The momentum aligns with OEM pushes toward zonal electrical architectures that increase the value of higher-density, automation-compatible interconnect solutions.
- October 2025: TE Connectivity launched its Inside Device Connectivity portfolio, including board-to-board and wire-to-wire connector solutions aimed at high-performance automotive electronic control units. The portfolio expansion targets software-defined vehicle architectures that require higher pin density and robust signal integrity, raising the need for advanced terminal designs and manufacturing precision. It also broadens TE Connectivitys offering for OEMs consolidating electronics into fewer, higher-content modules.


Automotive Terminals Market Report Scope and Research Methodology
Market Definition and Coverage
For this study, the automotive terminals market covers the metal terminal parts that create electrical connections inside vehicles, across low to high current needs. The sizing reflects demand from OEM fitment and replacement use, counted as revenue at the point of sale.
Scope exclusions: wire harness assemblies, complete connector housings, and standalone wiring cables are not treated as terminals in this sizing unless explicitly sold as terminal items.
Segments Covered in This Report
- By Application
- Battery System
- Lighting System
- Infotainment System
- Powertrain & Engine Management
- Safety and ADAS
- HVAC and Comfort
- By Vehicle Type
- Passenger Cars
- Light Commercial Vehicles
- Medium and Heavy Commercial Vehicles
- Two-Wheelers
- By Terminal Type
- Ring Terminals
- Spade Terminals
- Quick-Connect Terminals
- Butt Connectors
- Multi-Pin Connectors
- By Material
- Copper
- Brass
- Steel
- Other Alloys
- By Current Rating
- Less than 25 Amp
- 25 – 50 Amp
- More than 50 Amp
- By Sales Channel
- OEM
- Aftermarket
- By Geography
- North America
- United States
- Canada
- Rest of North America
- South America
- Brazil
- Argentina
- Rest of South America
- Europe
- Germany
- United Kingdom
- France
- Italy
- Russia
- Rest of Europe
- Asia-Pacific
- China
- India
- Japan
- South Korea
- Rest of Asia-Pacific
- Middle East and Africa
- Saudi Arabia
- United Arab Emirates
- Turkey
- South Africa
- Nigeria
- Rest of Middle East and Africa
- North America
Data Sources, Market Sizing, and Validation
Desk Research
Desk work starts by building the demand context for terminals, since they track vehicle production and the electrical content per vehicle. We referenced public sources such as OICA vehicle production tables, national transport and industry statistics, trade and tariff databases for import-export patterns, and regulatory or safety publications that influence electronics adoption. We also checked technical background through patent databases and peer-reviewed papers that describe higher current needs from electrified powertrains and 48V architectures.
In parallel, we reviewed company annual reports, investor presentations, and product catalogs to understand typical terminal materials, current ranges, and automotive application areas. A paid subscription for company financials and news was used selectively to monitor revenue signals, capacity changes, and plant expansions that can affect supply availability. These desk sources are illustrative only, and we used additional public references for cross checks and clarification during the work.
Primary Interviews and Surveys
Primary work was used to pressure test the desk assumptions on terminal content per vehicle, the share split across current ranges, and the pricing direction by material and plating type. We spoke with a mix of component suppliers, distributors, and automotive electrical system stakeholders across major producing regions, so gaps on EV penetration, sourcing shifts, and aftermarket demand could be filled with practical inputs.
Distribution of primary research fieldwork respondents
| Company type | Respondent position | Region |
|---|---|---|
| Top tier: 26% | CXOs: 15% | APAC: 43% |
| Mid tier: 59% | Functional/Unit leaders: 30% | EMEA: 36% |
| Smaller Players: 15% | Managers: 55% | Americas: 21% |
Market-Sizing & Forecasting
Sizing is built mainly from a top-down demand pool, where vehicle production by region is combined with the electrification mix and an estimated terminal content per vehicle across key electrical loads. To keep the logic grounded, the model is split by propulsion type and by application buckets that typically pull different current levels, and then rolled up to a global value.
To corroborate totals, selective bottom-up checks are done through supplier and channel sense checks, along with sampled price per terminal family multiplied by indicative volume ranges. Inputs that matter most include vehicle production trends, EV and hybrid penetration, adoption of safety and infotainment electronics, current rating mix shifts (for example, rising use of higher amp terminals in battery systems), and commodity-linked pricing signals for copper-based parts. For forecasting, scenario analysis is used around EV build rates and electrical content growth, and the base case is aligned to what industry experts describe as realistic for OEM programs and replacement cycles. Where bottom-up visibility is thin in smaller regions, the gap is handled through regional ratios tied back to production and trade intensity, and then rechecked in interviews.
Data Validation & Update Cycle
Validation is done by comparing the final outputs against independent signals like vehicle production series, electrified vehicle share, and the direction of terminal pricing linked to material movements. Large variances are flagged, the driver assumptions are reworked, and follow-up calls are triggered when the change cannot be explained by a clear market event.
Before sign-off, a separate analyst review is run to confirm the math flow, unit consistency, and currency conversions, and then the narrative is checked against the numbers. The report is refreshed annually, and interim updates are made when there are material shifts such as major capacity additions, regulatory changes, or sharp production swings. Right before delivery, we do a fresh data pass so the client receives the most current view available.
Mordor Intelligence's Automotive Terminals Market Estimate Compared With Other Published Estimates
Published market sizes for automotive terminals can look different even when the topic name is the same, since the product boundary and the vehicle electrical scope are not standardized. Differences also come from the year used for pricing, whether aftermarket demand is treated separately, and how fast EV-driven content growth is assumed to ramp.
By tracking vehicle production, EV penetration, and current rating mix shifts year by year, Mordor Intelligence keeps the estimate tied to terminal-level revenue rather than folding in adjacent connector housings or full harness assemblies, which are sometimes blended into broader electrical interconnect totals.
Benchmark comparison
| Source | Market Size | Gaps in Research Methodology |
|---|---|---|
| Mordor Intelligence | USD 24.97 B (2025) | |
| Industry Publisher A | USD 27.87 B (2024) | Uses an earlier base year and a wider vehicle and application cut, which can pull in adjacent electrical connection parts and inflate the starting value versus a terminal only boundary. |
| Global Consultancy B | USD 30.66 B (2025) | Applies a broader interpretation of the product scope and can embed more aggressive pricing assumptions for higher amp EV terminal demand, which lifts the 2025 level. |
The comparison shows that the main spread is driven by what gets counted as a terminal item, and by how pricing and EV content are carried forward from the base year. Our approach stays repeatable because each step links back to observable production volumes, propulsion mix, and application-level current needs, which makes the final value easier to audit and update.


Key Questions Answered in the Report
What is the current value of the automotive terminal market?
The automotive terminal market was valued at USD 28.59 billion in 2026 and is projected to rise to USD 56.22 billion by 2031 at a 14.48% CAGR during the forecast period (2026-2031).
Which application segment generates the most revenue for terminal suppliers?
Battery systems lead with a 32.94% revenue share in 2025, reflecting the high pin-count requirements of modern electric powertrains.
Why are 48 V architectures important for terminal demand?
48 V systems enable higher power delivery with thinner cables, cutting harness weight while expanding the number of low-voltage connection points, thereby boosting demand for specialized terminals.
Which region is expected to grow the fastest?
Asia–Pacific is forecast to post a 14.83% CAGR through 2031, driven by China’s dominance in new-energy vehicle production and integrated supply chains.
How is copper price volatility affecting terminal manufacturers?
Copper’s price swings, often exceeding USD 1,000 per tonne, can shave up to 180 basis points off gross margin because copper represents up to 70% of terminal material costs.
What technological trends are reshaping the competitive landscape?
Miniaturized micro-ring terminals, laser-weld contact technology, and integrated high-current terminals for megawatt charging are emerging as suppliers' key innovation battlegrounds.
Page last updated on:


 Your data is secure and never sold or shared.


