Quantum Dots (QD) Market Size and Share
Market Overview
| Study Period | 2020 - 2031 |
|---|---|
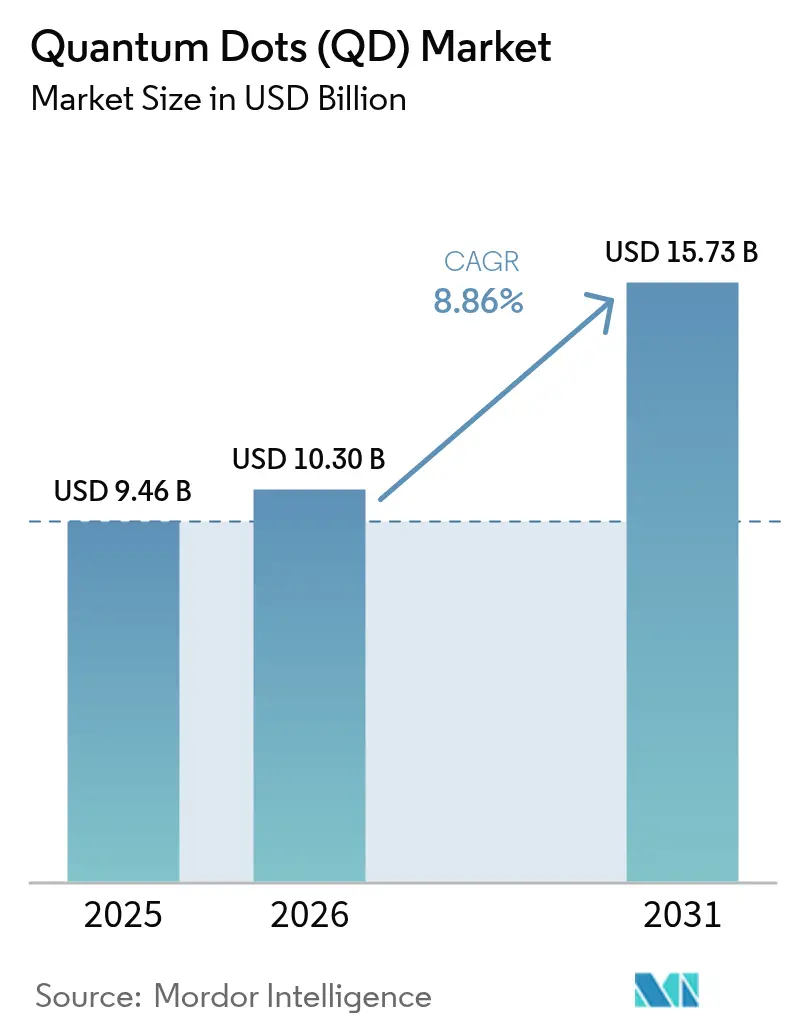
| Market Size (2026) | USD 10.3 Billion |
| Market Size (2031) | USD 15.73 Billion |
| Growth Rate (2026 - 2031) | 8.86% CAGR |
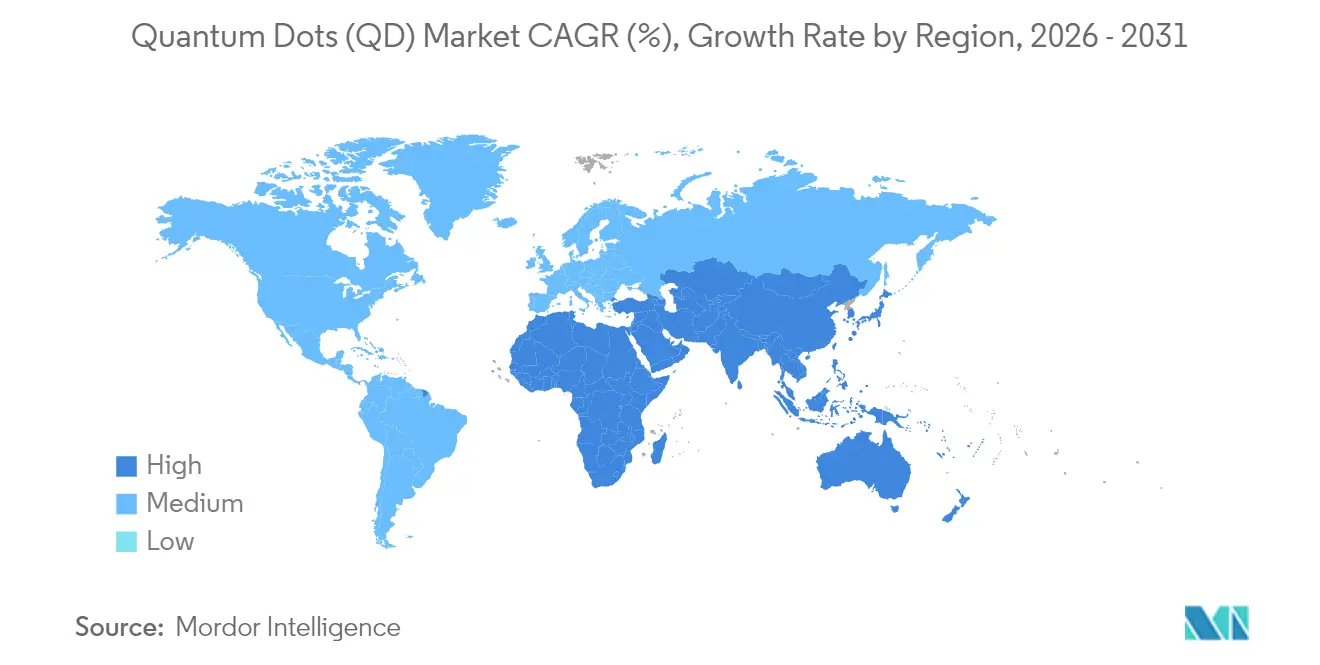
| Fastest Growing Market | Middle East and Africa |
| Largest Market | Asia |
| Market Concentration | Medium |
Major Players *Disclaimer: Major Players sorted in no particular order Image © Mordor Intelligence. Reuse requires attribution under CC BY 4.0. | |
Quantum Dots (QD) Market Analysis by Mordor Intelligence
The global quantum dots market size is expected to grow from USD 9.46 billion in 2025 to USD 10.3 billion in 2026 and is forecast to reach USD 15.73 billion by 2031 at 8.86% CAGR over 2026-2031. Commercial maturity is accelerating as the technology migrates from laboratory discovery to mass-produced components in ultra-high-definition displays, quantum‐secure communication nodes, and next-generation bio-imaging platforms. [1]Samsung Newsroom, “Real Quantum Dot Guide: Samsung's Innovations Redefine Picture Quality Standards,” news.samsung.com China’s rapid uptake of quantum-dot televisions, the emergence of cadmium-free chemistries that comply with EU RoHS limits, and sustained government funding in Asia and the Middle East are sustaining long-term demand. Manufacturing scale advantages in Asia-Pacific, combined with perovskite breakthroughs that lift efficiency and color purity, are lowering unit costs faster than legacy OLED alternatives, opening mainstream consumer price points. In parallel, quantum computing architectures based on semiconductor quantum dots, and five-fold sensitivity gains in cancer diagnostics, are expanding total addressable opportunities well beyond displays.
Key Report Takeaways
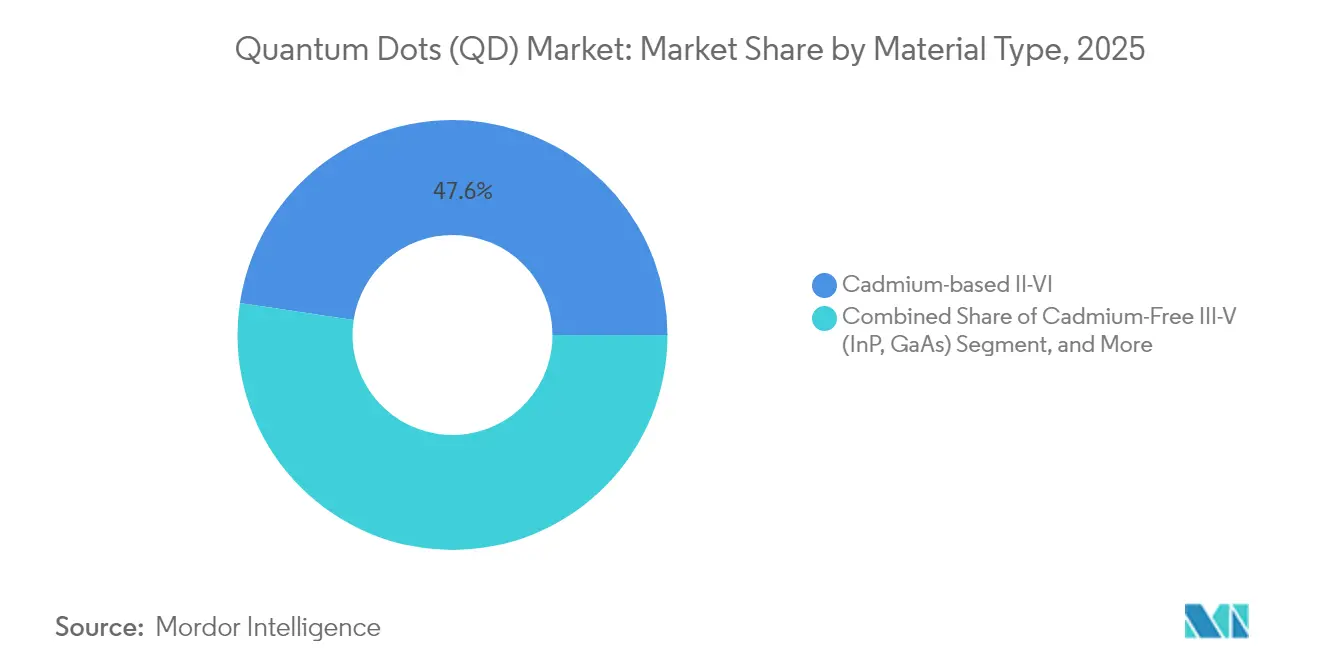
- By material type, cadmium-based II-VI compounds led with 47.62% of quantum dots market share in 2025, while perovskite quantum dots are projected to grow at an 11.28% CAGR through 2031.
- By device form factor, QD films dominated with 71.35% revenue share in 2025; on-chip quantum dots record the highest forecast CAGR at 12.15% to 2031.
- By application, display technologies held 65.48% share of the quantum dots market size in 2025, whereas quantum computing and security solutions advance at a 12.92% CAGR.
- By end-use industry, consumer electronics commanded 67.22% revenue in 2025, while healthcare and life sciences expand fastest at a 11.74% CAGR.
- By geography, Asia-Pacific accounted for 37.85% of 2025 revenue; the Middle East and Africa region is set to rise at a 10.18% CAGR, the quickest worldwide.
Note: Market size and forecast figures in this report are generated using Mordor Intelligence’s proprietary estimation framework, updated with the latest available data and insights as of 2026.
Global Quantum Dots (QD) Market Trends and Insights
Drivers Impact Analysis*
| Driver | (~) % Impact on CAGR Forecast | Geographic Relevance | Impact Timeline |
|---|---|---|---|
| Quantum-dot adoption in ultra-high-definition TV panels | +2.80% | China; broader Asia-Pacific | Medium term (2–4 years) |
| Regulatory push for cadmium-free quantum dots in EU consumer electronics | +1.90% | Europe; spill-over to North America | Long term (≥ 4 years) |
| Rapid commercialization of perovskite quantum dots in display back-lighting | +2.10% | South Korea, China, Japan | Short term (≤ 2 years) |
| Surge in quantum-dot bio-imaging agents for healthcare | +1.40% | North America, EU, Asia-Pacific | Medium term (2–4 years) |
| Government-funded quantum-materials R&D programs in South Korea | +1.10% | South Korea; allied export markets | Long term (≥ 4 years) |
| Source: Mordor Intelligence | |||


Quantum-dot adoption in ultra-high-definition television panels, led by China
Domestic panel makers have installed high-capacity quantum-dot film lines that deliver more than 100% NTSC color gamut, while TCL’s QM6K series achieves 98%+ DCI-P3 coverage and 53% higher brightness through Super High Energy LED back-lights. BOE’s USD 9 billion Gen-8.6 AMOLED facility, coming online in 2026, reinforces cost leadership and secures supply for regional brands. The shift from RGB OLED to QD-OLED architectures simplifies manufacturing, enhancing yield and lowering capex per square meter for 4K and 8K screens.
Regulatory push for cadmium-free quantum dots in EU consumer electronics
The EU’s 0.01 wt% cadmium cap under RoHS is driving early movers toward copper-indium and indium-phosphide formulations.[2]European Chemicals Agency, “Restricted substances referred under Article 4 of RoHS,” echa.europa.eu UbiQD’s USD 20 million Series B round will scale cadmium-free production, while Applied Materials has proven lead-free devices matching cadmium performance in color conversion layers. Universities are commercializing aqueous synthesis routes that remove organic solvents and cut process emissions, creating cost and compliance advantages for adopters.
Rapid commercialization of perovskite quantum dots in display back-lighting
Surface-engineered perovskite quantum dots have sustained 12-hour continuous photon emission with no decay and reached 98% single-photon purity, clearing previous stability hurdles. Microfluidic synthesis delivers batch-to-batch uniformity and lowers reagent usage, pushing perovskite costs toward parity with traditional phosphors. Core-shell architectures and phospholipid coatings mitigate moisture sensitivity, enabling qualification for QD-EL and microLED back-lights in commercial prototypes seen at CES 2025.
Surge in quantum-dot bio-imaging agents in healthcare applications
Carbon quantum dots derived from pharmaceutical precursors enhance drug solubility and reduce systemic toxicity, while silicon quantum dots offer non-toxic ocular imaging at sub-16 µg/mL concentrations. Cancer-detection assays using zinc-to-silver exchange quantum dots register five-fold sensitivity improvements, and quantum-dot hydrogels achieve 43% photothermal conversion, inhibiting 83% of tumor growth in pre-clinical models. These breakthroughs position quantum dots for next-generation multiplexed diagnostics and targeted therapies.
Restraints Impact Analysis*
| Restraint | (~) % Impact on CAGR Forecast | Geographic Relevance | Impact Timeline |
|---|---|---|---|
| Supply-Chain Bottlenecks for High-Purity Indium-Phosphide Precursors | -1.7% | Global, with acute impact on Asia-Pacific manufacturing | Medium term (2-4 years) |
| Performance Degradation of Perovskite QDs Under Moisture Exposure | -1.3% | Global, particularly humid climate regions | Short term (≤ 2 years) |
| Environmental-Compliance Costs of Cadmium Regulations in Europe | -0.9% | Europe, with regulatory spillover to North America | Long term (≥ 4 years) |
| Limited Mass-Manufacturing Infrastructure for QD Micro-LED Integration | -1.1% | Global, with concentration in Asia-Pacific manufacturing hubs | Medium term (2-4 years) |
| Source: Mordor Intelligence | |||
Supply-chain bottlenecks for high-purity indium-phosphide precursors
Indium demand from 6G infrastructure is projected to consume 4% of annual production, squeezing availability for indium-phosphide quantum dots and pushing prices higher. Soochow University’s ink-engineering route lowers photovoltaic costs to USD 0.06/Wp but relies on consistent indium purity, which remains scarce outside a handful of refiners. Microwave-assisted and ionic-liquid syntheses reduce hazardous reagents yet still require secure metal feedstocks, keeping supply risk elevated through at least 2028.
Performance degradation of perovskite quantum dots under moisture exposure
Ambient humidity promotes tin oxidation, methylammonium loss, and phase segregation in perovskite lattices, cutting device lifetimes. Protective PMMA coatings have extended operational integrity to 960 hours, and dynamic passivation with hindered urea bonds retains 94% efficiency after 1,500 hours at 85 °C, but mass-manufacturing lines must operate in low-dew-point environments to ensure repeatability. Climate-dependent degradation still limits adoption in hot, humid markets without robust encapsulation.
*Our forecasts treat driver/restraint impacts as directional, not additive. The impact forecasts reflect baseline growth, mix effects, and variable interactions.
Segment Analysis
By Material Type: Cadmium-free innovation accelerates despite legacy dominance
Cadmium-based II-VI compounds held 47.62% of 2025 revenues, anchoring the quantum dots market through well-established supply chains and high quantum yields. Regulatory exposure, however, compresses their outlook as EU and California policies converge on lighter-element chemistries. Perovskite variants, supported by 11.28% CAGR, move from lab novelty to production-ready emitters that match cadmium brightness and achieve room-temperature single-photon purity, broadening relevance for secure communications. Indium-phosphide platforms benefit from UbiQD’s scale-up funding and Applied Materials’ process optimization, yet precursor shortages temper near-term penetration. Silicon and carbon quantum dots are carving biomedical niches, showing negligible cytotoxicity at clinically relevant doses and enabling fluorescence-guided surgery. Historic data reveal cadmium alternatives growing 15–20% annually versus sub-5% for cadmium incumbents from 2020-2024, signaling a structural pivot in the quantum dots market.
Second-generation materials diversify end-use reach. Graphene quantum dots fused with silicon nanoshells achieve 71% aphid-population suppression, positioning nanomaterials for precision agriculture beyond displays. Perovskite glow layers are now printable at 140 PPI, easing integration into mid-sized monitors, while silicon dots deliver stable infrared photoluminescence critical for wearable biosensors. The quantum dots market size for cadmium-free segments is projected to rise at double-digit rates, reinforcing supplier pivots toward low-toxicity chemistries. Heightened corporate ESG targets, plus upcoming RoHS exemptions sunsets, cement the transition path.


By Device Form Factor: On-chip integration drives next-generation applications
QD films remain revenue mainstays with 71.35% share in 2025, favored by television OEMs seeking plug-and-play color converters that slip into existing LCD stacks. Yet on-chip quantum dots display the highest 12.15% CAGR as semiconductor fabs capture photonic emitters directly on foundry platforms. University of Cambridge’s 13,000-spin quantum register, achieving 69% fidelity at 130 µs coherence, underscores leapfrog potential for chip-scale quantum nodes. Core-shell nanopillars grown through microfluidic reactors now exhibit sub-5% size dispersion, crucial for coherent emission. Electrophoretic deposition on corrugated wafers yields crack-free near-infrared detectors, opening automotive LiDAR and medical endoscope markets. As line width reductions plateau, integrated photonics offers Moore-than-More scaling, with quantum dots supplying the single-photon sources missing from silicon photonics roadmaps.
Scaling pathways diverge. Inkjet printed QD-OLED panels already hit 31.5-inch diagonals at commercial yield, while electrohydrodynamic jetting produces micron-scale RGB pixels for microLED arrays. The quantum dots market size captured by on-chip formats is set to widen as performance gains in quantum computing justify higher ASPs. Investments in atomic-layer deposition and atomic-precision lithography will further align dot placement with transistor gateways, shrinking interconnect delays in quantum buses. Device OEMs are bundling intellectual property around packaging, thermal management, and lithographic alignment, creating new defensible moats.
By Application: Quantum computing emergence reshapes market dynamics
Display systems retained 65.48% of 2025 revenues, underpinned by Samsung’s shift to QD-OLED and mini-LED back-lighting that makes superior Rec. 2020 coverage affordable. However, quantum-secure communication links and register arrays record a 12.92% CAGR, propelled by IonQ’s USD 1.1 billion Oxford Ionics acquisition, which targets two-million-qubit hardware by 2030. Semiconductor-based quantum dots supply deterministic photon sources essential for error-corrected qubits and quantum key distribution. In bio-med, five-fold gains in oncology assay sensitivity reposition quantum dots as must-have contrast agents. Photovoltaic researchers at Los Alamos report 41% efficiency jumps using manganese-doped quantum dots, challenging perovskite tandem cells. Agriculture pilots that blend light-optimizing films with copper-indium dots improve greenhouse yields and cut pesticide loads, confirming multipronged upside.
Momentum is reinforced by diverse revenue pools. MicroLED fabs count on quantum dots for fine-pitch full-color conversion, offsetting slow yields in direct RGB chip processes. Security agencies fund quantum random-number generators for encrypted satellites, while oil & gas majors test quantum-dot tracers that map reservoir flow paths with single-ppm sensitivity. This broadening end-use scope cushions demand cyclicality in consumer displays and underlines the quantum dots market’s resilience.

By End-Use Industry: Healthcare disruption accelerates beyond consumer electronics
Consumer electronics held 67.22% of 2025 spend, but healthcare and life sciences clock the fastest 11.74% CAGR through breakthroughs in multiplexed imaging and targeted photothermal therapy. Carbon-based “quantum drugs” synthesized directly from APIs display enhanced bioavailability without added toxicity, while silicon dots visualize tear films in ophthalmology at nanogram doses. Hospitals deploy quantum-dot assays that isolate micro-RNA cancer markers at tenfold lower false-negative rates than ELISA. Defense users exploit quantum dots in quantum-secure radios and low-SWaP night-vision cameras. Energy firms integrate quantum-dot luminescent concentrators into building façades, harvesting diffuse sunlight to power IoT nodes. The quantum dots market has thus shifted from single-sector dependence to multi-industry diffusion, diluting price pressure risks typical of consumer cycles.
Regulation and sustainability reinforce diversification. EU ecodesign rules prioritize repairable TVs, nudging display OEMs to adopt quantum-dot films that withstand higher back-light temperatures and extend product lifetimes. Healthcare agencies favor cadmium-free probes, fast-tracking indium-phosphide and silicon dots into clinical trials. Agricultural quantum films secure green-house dispensations in sustainable-farming subsidies, aligning agritech with climate policy. Together these trends expand quantum dots market share for emerging verticals while stabilizing long-term demand.
Geography Analysis
Asia-Pacific maintains leadership with 37.85% of 2025 revenue due to vertically integrated panel makers and deliberate national R&D funding. Samsung Display’s USD 10.9 billion conversion to QD-OLED lines and South Korea’s KRW 491 billion quantum program cement the ecosystem, while China’s BOE invests USD 9 billion in Gen-8.6 capacity that anchors local supply chains. Japan complements manufacturing heft with process innovation, hosting seminars to solve toxicity and durability bottlenecks. The quantum dots market size in Asia remains underpinned by domestic demand for premium TVs and by export flows into North America and Europe.
North America follows with deep research assets at University of Cambridge (Cambridge-US collaborations), MIT Lincoln Laboratory, and Los Alamos National Laboratory driving quantum-secure links and high-efficiency photovoltaics. Venture capital traction is robust, proven by UbiQD’s USD 20 million raise and IonQ’s headline acquisitions. Strong IP protection and federal funding ensure commercialization pipelines, and US export-control scrutiny over cadmium compounds nudges suppliers toward indium-phosphide builds. Europe leverages regulatory influence: RoHS compliance sparks cadmium-free adoption, while University of Liège’s aqueous syntheses cut hazardous waste. Government green-deal funds deploy quantum-dot window films for energy-positive buildings.
The Middle East and Africa record the fastest 10.18% CAGR. UAE’s Norma Center, Qatar’s USD 10 million program, and Saudi R&D funds foster quantum-dot computing clusters, aiming to diversify oil economies. Import substitution policies encourage local assembly of QD-enhanced solar panels and medical devices. Latin America sees nascent demand in agrotechnology, where quantum-dot greenhouse sheets improve fruit yield in high-altitude farms, yet market penetration remains under 3%. Overall, geographic revenue dispersion reduces concentration risk: Asia’s share inches lower toward 35% by 2030 as Middle East and Africa capture investment flows and as Western regions on-shore critical materials processing.

Competitive Landscape
Top Companies in Quantum Dots Market
Moderate concentration typifies the quantum dots market. Samsung, LG Display, and BOE exploit scale and captive fabs to supply television OEMs at competitive cost, yet specialized players such as Nanosys and UbiQD differentiate through patented cadmium-free chemistries. Applied Materials leverages process tooling expertise to deliver turnkey quantum-dot encapsulation lines, embedding itself across multiple customer roadmaps. IonQ’s USD 1.1 billion Oxford Ionics deal signals convergence between display heritage and quantum computing ambitions, while Quantinuum’s planned USD 10 billion IPO validates investor belief in non-display upside. [3] Laser Focus World, “Quantinuum eyes $10B IPO,” laserfocusworld.com
Strategic moves sharpen competitive contours. Samsung partners with the Institute for Basic Science to co-develop environmentally benign quantum‐dot interfaces, preserving lead times as RoHS deadlines loom. BOE’s Gen-8.6 plant includes vertically integrated perovskite pilot lines, hedging against future cadmium bans. UbiQD channels Series B proceeds into agricultural and solar films, opening revenue beyond electronics and reducing exposure to panel cycles. Intellectual-property friction is rising: over 4,300 quantum-dot patents were filed worldwide in 2024, and cross-licensing deals increasingly dictate supply permissions.
White-space opportunities attract newcomers. Start-ups bundle quantum-dot single-photon sources with photonic integrated circuits for telecom, while biotech firms license bright, narrow-band emitters for point-of-care diagnostics. Microfluidics vendors supply additively manufactured reactors that slash batch variation, winning contracts from healthcare and defense primes. As the quantum dots industry scales, downstream integrators (television brands, medical device OEMs, cloud service providers) shape demand signals, forcing upstream suppliers to diversify chemistries and geography. Pricing remains resilient because high-value performance gains outweigh material input inflation.
Quantum Dots (QD) Industry Leaders
Samsung Electronics Co., Ltd.
Nanosys Inc.
LG Display Co., Ltd.
BOE Technology Group Co., Ltd.
Nanoco Group PLC
- *Disclaimer: Major Players sorted in no particular order

Recent Industry Developments
- June 2025: IonQ agreed to acquire Oxford Ionics for USD 1.1 billion to accelerate two-million-qubit systems by 2030, fusing trapped-ion strengths with semiconductor engineering.
- May 2025: IonQ unveiled plans for a space-based quantum key distribution network after acquiring Capella Space, aiming at global quantum-secure links.
- April 2025: UbiQD secured USD 20 million Series B funding to scale cadmium-free copper-indium quantum dots for agriculture and solar uses.
- January 2025: University of Cambridge demonstrated a quantum register of 13,000 entangled nuclear spins with 69% storage fidelity, guiding chip-scale network design.


Research Methodology Framework and Report Scope
Market Definitions and Key Coverage
Our study defines the quantum dots market as the value generated from the commercial sale of semiconductor nanocrystals (2-10 nm), whether cadmium-based or cadmium-free, that are engineered, packaged, and supplied for integration into displays, lighting, photovoltaics, medical imaging, sensors, and emerging quantum technologies. The definition covers both discrete powders and pre-formatted films or inks that ship to device makers.
Scope exclusion: laboratory research reagents, low-volume prototypes, and revenues from finished TVs, monitors, or solar panels that simply embed quantum dots are not counted.
Segmentation Overview
- By Material Type
- Cadmium-based II-VI (CdSe, CdS, CdTe)
- Cadmium-Free III-V (InP, GaAs)
- Perovskite Quantum Dots
- Silicon Quantum Dots
- Graphene and Carbon Quantum Dots
- By Device Form Factor
- QD Films
- On-Chip Quantum Dots
- Core-Shell and In-Shell Architectures
- By Application
- Displays
- QD-LCD
- QD-OLED
- Micro-LED Integration
- Lighting
- General Illumination
- Specialty Lighting
- Solar Cells and Photovoltaics
- Medical Imaging and Diagnostics
- Drug Delivery and Theranostics
- Sensors and Instruments
- Quantum Computing and Security
- Agriculture and Food
- Others
- Displays
- By End-Use Industry
- Consumer Electronics
- Healthcare and Life Sciences
- Energy and Power
- Defense and Security
- Agriculture
- Others
- By Geography
- North America
- United States
- Canada
- Mexico
- Europe
- Germany
- United Kingdom
- France
- Nordics
- Rest of Europe
- South America
- Brazil
- Rest of South America
- Asia-Pacific
- China
- Japan
- India
- South-East Asia
- Rest of Asia-Pacific
- Middle East and Africa
- Middle East
- Gulf Cooperation Council Countries
- Turkey
- Rest of Middle East
- Africa
- South Africa
- Rest of Africa
- Middle East
- North America
Detailed Research Methodology and Data Validation
Primary Research
Mordor analysts interviewed quantum-dot synthesizer executives, display OEM procurement leads across Asia and North America, photovoltaic R&D managers, and healthcare imaging specialists. Their insights validated volume-per-device assumptions, acceptable ASP ranges, and regional regulatory timelines, helping us refine forecast inflection points.
Desk Research
We mapped supply chains and baseline volumes using open sources such as UN Comtrade trade codes for II-VI compounds, the Consumer Technology Association's annual display shipment tracker, the U.S. Department of Energy solid-state lighting program notes, and European Chemicals Agency REACH registers that flag cadmium restrictions. Company financials and capacity disclosures were screened through D&B Hoovers, while patent intensity by material class was reviewed in Questel to gauge innovation run-rate. Industry journals and conference proceedings from SID Display Week and IEEE PVSC supplied device efficiency benchmarks that feed the adoption curve. These examples are illustrative; many additional databases, investor filings, and trade bulletins informed our desk analysis.
Market-Sizing & Forecasting
A top-down model begins with end-application production, television and monitor panel shipments, LED package volumes, projected square meters of solar modules, and installed base of in-vivo imaging systems, which are then multiplied by material penetration rates and average quantum-dot grams-per-unit. Select bottom-up checks, such as roll-ups of six leading material suppliers' revenue disclosures, confirm totals and highlight data gaps. Key variables tracked include cadmium-free conversion rate, grams per display trend, average selling price erosion, photovoltaic efficiency gains, regional display capacity additions, and healthcare imaging procedure growth. Multivariate regression supported by scenario analysis projects these drivers to 2030, and missing supplier data are bridged using three-year moving averages aligned to patent issuance momentum.
Data Validation & Update Cycle
Outputs pass anomaly checks against historical price-volume elasticity, with senior reviewers challenging variances before sign-off. Reports refresh each year, and interim updates are triggered when regulatory shifts or major capacity announcements alter any core variable. A final analyst sweep ensures clients receive the latest view before release.
Why Mordor's Quantum Dots Baseline Inspires Confidence
Published estimates often diverge because firms mix finished device revenues with material sales, apply differing cadmium-free adoption curves, or refresh models on irregular cadences.
Key gap drivers include scope creep into downstream devices, optimistic ASP decline paths, or the use of static penetration ratios that overlook fast policy shifts favoring cadmium-free alternatives. Mordor's disciplined scope and annual refresh keep our baseline tightly aligned with real material flows.
Benchmark comparison
| Market Size | Anonymized source | Primary gap driver |
|---|---|---|
| USD 9.46 B | Mordor Intelligence | - |
| USD 10.60 B (2024) | Global Consultancy A | Includes finished TV revenues, single-factor growth rate |
| USD 8.21 B | Industry Tracker B | Uses conservative display shipment scenario, limited primary checks |
| USD 11.92 B | Analyst Network C | Counts prototype sales, five-year update cycle |
In sum, Mordor's stepwise scope setting, dual-source validation, and frequent refresh cadence deliver a balanced, transparent baseline that decision-makers can trace back to concrete variables and reproducible steps.


Key Questions Answered in the Report
What is the current size of the quantum dots market?
The quantum dots market reached USD 10.3 billion in 2026 and is projected to climb to USD 15.73 billion by 2031.
Which material segment is growing fastest?
Perovskite quantum dots are expanding at an 11.28% CAGR through 2031, outpacing cadmium and indium-based alternatives.
Why are cadmium-free quantum dots gaining momentum?
EU RoHS restrictions limit cadmium to 0.01 wt%, pressuring manufacturers to shift toward copper-indium and indium-phosphide chemistries that satisfy environmental rules.
Which region shows the highest growth potential?
The Middle East and Africa region posts the fastest 10.18% CAGR, driven by national quantum R&D programs in the UAE, Qatar, and Saudi Arabia.
How are quantum dots impacting healthcare?
Advanced bio-imaging agents using carbon and silicon quantum dots deliver five-fold cancer-detection sensitivity and enable photothermal therapies with 83% tumor inhibition in pre-clinical tests.
What is driving on-chip quantum dot adoption?
Semiconductor integration offers deterministic single-photon sources crucial for scalable quantum computing networks, fueling a 12.15% CAGR in on-chip formats.
Page last updated on:


