Qatar Solid Waste Management Market Size and Share
Market Overview
| Study Period | 2020 - 2031 |
|---|---|
| Forecast Data Period | 2026 - 2031 |
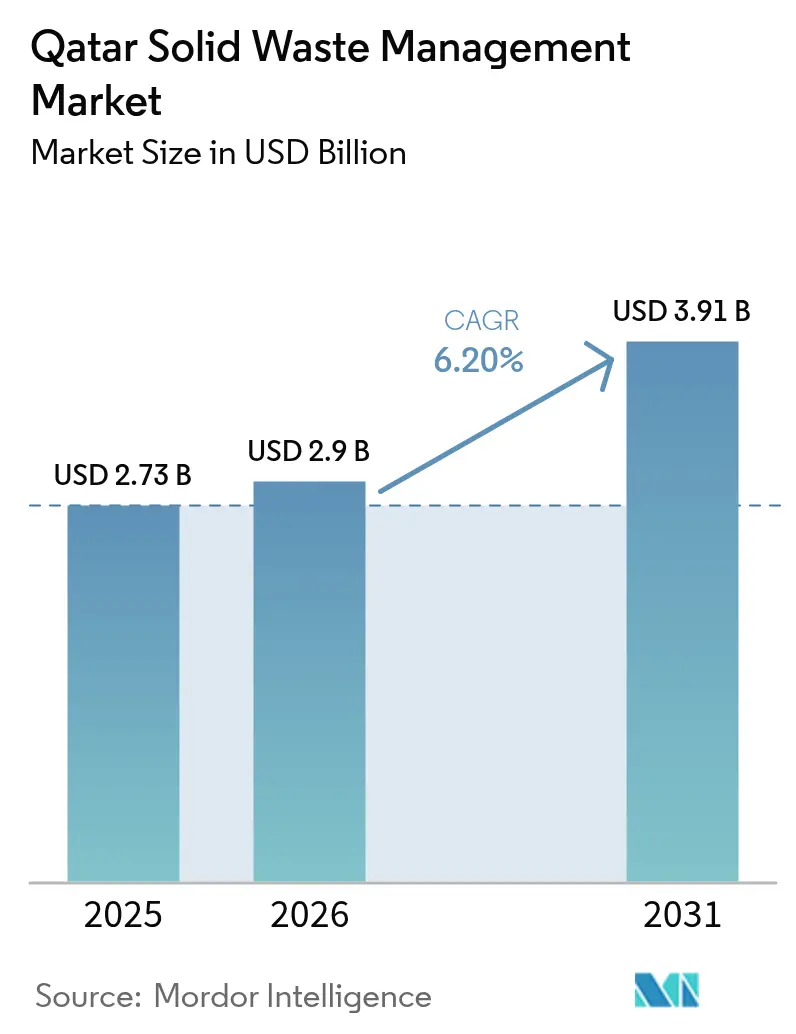
| Base Year Market Size (2025) | USD 2.73 Billion |
| Market Size (2026) | USD 2.9 Billion |
| Market Size (2031) | USD 3.91 Billion |
| Growth Rate (2026 - 2031) | 6.20% CAGR |
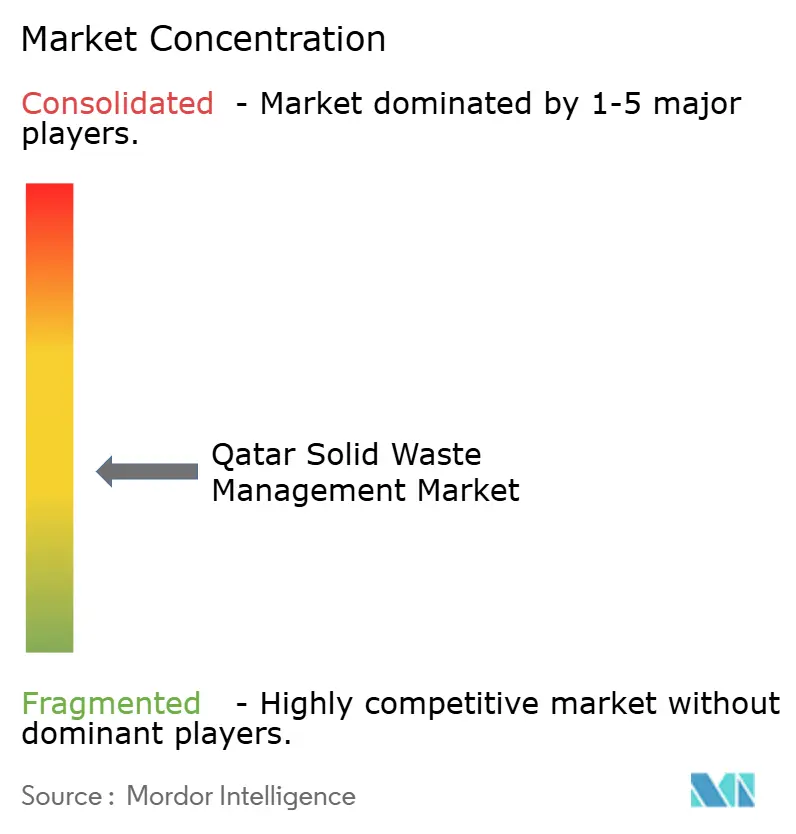
| Market Concentration | Medium |
Major Players
*Disclaimer: Major Players sorted in no particular order Image © Mordor Intelligence. Reuse requires attribution under CC BY 4.0. |
|
Qatar Solid Waste Management Market Analysis by Mordor Intelligence
The Qatar Solid Waste Management Market size is expected to grow from USD 2.73 billion in 2025 to USD 2.9 billion in 2026 and is forecast to reach USD 3.91 billion by 2031 at 6.20% CAGR over 2026-2031.
Robust population gains, post-International Federation of Association Football (FIFA) zero-waste commitments, and rising industrial activity are placing fresh demands on collection fleets, treatment capacity, and material-recovery infrastructure. Organic refuse continues to dominate total tonnage, yet an accelerating inflow of discarded electronics is reshaping processing priorities. Capital is increasingly flowing toward waste-to-energy (WtE) projects and smart-waste technologies as operators seek higher margins and compliance with the 85% landfill-diversion target embedded in Qatar National Vision 2030. Competitive intensity is rising as international firms use balance-sheet strength and digital know-how to secure multi-year municipal contracts, while local players leverage logistics networks to court commercial and industrial clients.
Key Report Takeaways
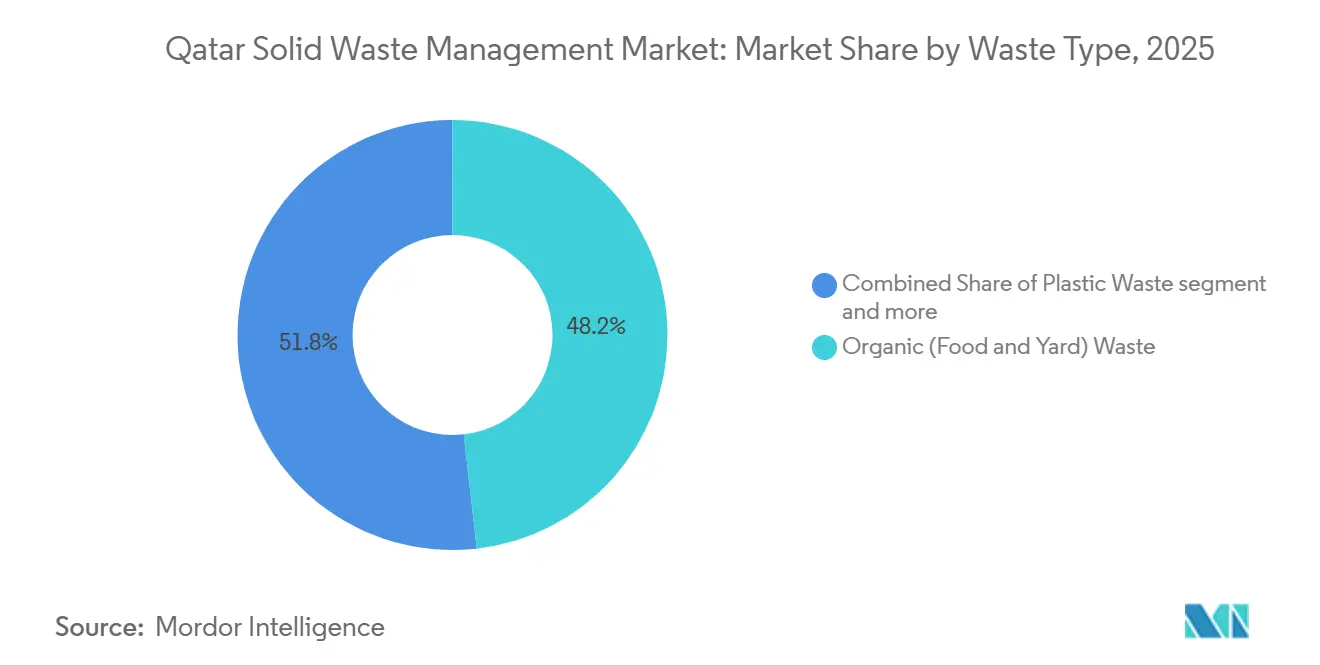
- By waste type, organic refuse commanded 48.2% of the Qatar solid waste management market share in 2025, whereas electronic waste is expected to register an 8.51% CAGR through 2031.
- By source, residential generators commanded 47.25% of the Qatar solid waste management market share in 2025, while industrial waste streams are set to grow at a 6.95% CAGR through 2031.
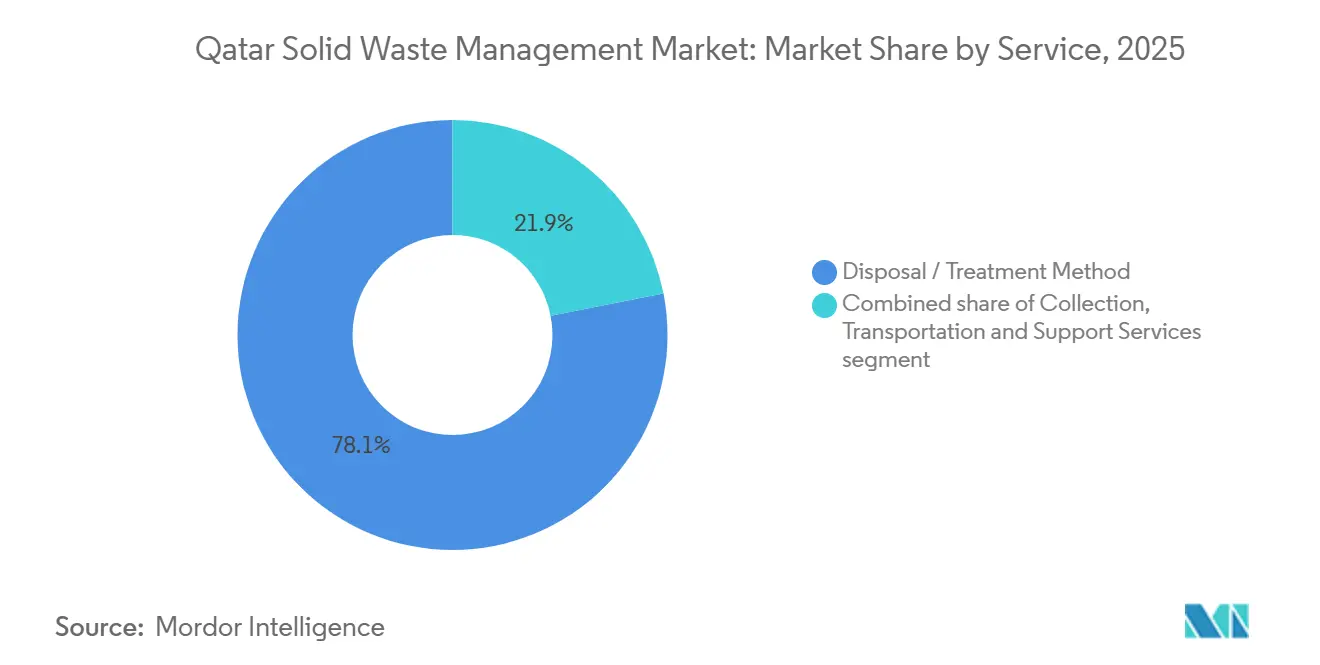
- By service, disposal and treatment methods commanded 78.10% of the 2025 value within the Qatar solid waste management market size, while recycling and material recovery are forecast to record an 8.05% CAGR through 2031.
- By city, Doha commanded 50.10% of the 2025 value within the Qatar solid waste management market size, while the Rest of Qatar, including Al Khor, Dukhan, and Mesaieed, is anticipated to register the fastest growth at a 7.35% CAGR through 2031.
Note: Market size and forecast figures in this report are generated using Mordor Intelligence’s proprietary estimation framework, updated with the latest available data and insights as of 2026.
Qatar Solid Waste Management Market Trends and Insights
Drivers Impact Analysis*
| Drivers | (~) % Impact on CAGR Forecast | Geographic Relevance | Impact Timeline |
|---|---|---|---|
| Implementation of mandatory source-segregation targets under Qatar National Vision 2030 | +1.5% | National, phased rollout starting Doha, Al Rayyan, Al Wakrah | Medium term (2-4 years) |
| Expansion of waste-to-energy project pipeline supported by sovereign wealth investments | +1.3% | National, anchor facilities in Mesaieed and Doha | Long term (≥ 4 years) |
| Rapid population growth increases municipal solid waste generation volumes | +1.2% | National, with concentration in Doha and Al Rayyan | Short term (≤ 2 years) |
| Post-FIFA mega-event sustainability commitments promoting zero-waste-to-landfill initiatives | +0.9% | National, legacy infrastructure in Doha and Al Wakrah | Medium term (2-4 years) |
| Adoption of AI-enabled robotic sorting technologies improving material recovery efficiency | +0.7% | National, early deployment in Doha MRFs | Medium term (2-4 years) |
| Industrial symbiosis initiatives utilizing by-products from LNG and desalination facilities | +0.6% | Regional, concentrated in Ras Laffan, Mesaieed industrial zones | Long term (≥ 4 years) |
| Source: Mordor Intelligence | |||
Implementation of Mandatory Source-Segregation Targets Under Qatar National Vision 2030
Ministerial Decision 143 compels every premise to separate organics, recyclables, and residuals by December 2027, with fines that escalate to USD 13,700 for repeat offenses. Pilot audits in Doha revealed contamination rates above 40%, so multilingual engagement campaigns and utility-rebate incentives are being piloted. Smart bins carrying weight sensors and radio-frequency tags underpin this behavioral shift, but require an estimated USD 49 million for full rollout. As penalties tighten, producers and service providers are jointly trialing take-back schemes to elevate compliance and lower re-sorting labor at material-recovery facilities (MRFs).
Expansion of Waste-to-Energy Project Pipeline Supported by Sovereign Wealth Investments
The Domestic Solid Waste Management Centre (DSWMC) is developing a 640,000-tonne-per-year WtE plant in Mesaieed at a capital cost near USD 700 million. Qatar Investment Authority has already earmarked USD 200 million in equity, anchoring a public-private partnership that will generate up to 80 MW of electricity for industrial users. Continuous-emission monitoring, aligned with European Union standards, has been specified to address air-quality concerns. Once operational in 2028, the facility can push the Qatar solid waste management market toward its landfill-diversion target by absorbing mixed residuals now destined for Umm Al Afai landfill.[1]"Qatar Population Statistics." Planning and Statistics Authority, State of Qatar. Accessed March 2026. https://www.psa.gov.qa/en/statistics/pages/population.aspx
Rapid Population Growth Increases Municipal Solid Waste Generation Volumes
Headcount rose from 2.69 million in 2020 to roughly 2.98 million in 2025, pushing per-capita waste creation toward 1.6 kilograms daily. Fleet workloads climbed in tandem, forcing operators to lengthen collection routes into new suburbs and raise maintenance budgets. High-density residential nodes such as West Bay and Lusail recorded compliance with segregation below one-quarter of households, limiting upstream diversion. Public authorities now monitor fill-level data in real time to redeploy trucks and cut overtime, a practice that trims diesel use yet adds telematics costs. Population-driven volume pressure, therefore, remains the most immediate catalyst for fleet expansion and route-optimization investments.[2]"Qatar Population Statistics." Planning and Statistics Authority, State of Qatar. Accessed March 2026
Post-FIFA Mega-Event Sustainability Commitments Promoting Zero-Waste‐to-Landfill Initiatives
The 2022 World Cup diverted 87% of event waste through on-site sorting and dedicated offtake partners. Government is now embedding similar diversion clauses minimum of 60% into municipal tenders, advantaging firms with established recovery capacity. Yet replicating event conditions in everyday settings is harder; scaling diversion to 85% nationally would triple current MRF throughput needs. Procurement frameworks now favor bidders able to deliver both collection and downstream processing to bridge that supply-demand gap.
Restraints Impact Analysis*
| Restraints | (~) % Impact on CAGR Forecast | Geographic Relevance | Impact Timeline |
|---|---|---|---|
| High capital expenditure and operational costs of advanced waste treatment facilities | -0.8% | National, acute in Doha and Al Rayyan where land costs are elevated | Short term (≤ 2 years) |
| Limited public participation and awareness in recycling and waste segregation programs | -0.6% | National, most pronounced in transient expatriate communities | Medium term (2-4 years) |
| Lack of granular waste-generation data affecting long-term infrastructure planning | -0.4% | National, planning gaps in Rest of Qatar municipalities | Medium term (2-4 years) |
| Odour control and leachate management challenges under Qatar's arid climatic conditions | -0.3% | National, critical at Umm Al Afai landfill and transfer stations | Short term (≤ 2 years) |
| Source: Mordor Intelligence | |||
High capital expenditure and operational costs of advanced waste treatment facilities
Optical-sorting MRFs and mechanical-biological treatment lines demand outlays that range from USD 40 million up to USD 150 million for fully integrated plants. Regulated tipping fees, presently about USD 16.50 per tonne, cover barely half of the cost needed to earn double-digit internal returns. Land in Doha’s industrial zones carries premium prices, inflating project budgets by as much as 20%. Without viability-gap funding, many local firms postpone upgrades or cross-subsidize from logistics operations, limiting technology diffusion and reinforcing reliance on landfill space.
Limited public participation and awareness in recycling and waste segregation programs
Despite distribution of color-coded bins to more than 200,000 homes, average contamination in recyclables still hovers near 40%. Qatar’s workforce is 88% expatriate, with diverse disposal habits and high turnover that breaks continuity in outreach. Surveys in 2025 showed only 22% of residents could correctly sort five common items. High contamination doubles manual re-sorting labor and depresses throughput, raising cost per recovered tonne. Gamified mobile apps that reward correct segregation are gaining traction but have yet to reach critical mass among low-wage workers who often lack smartphones.
*Our forecasts treat driver/restraint impacts as directional, not additive. The impact forecasts reflect baseline growth, mix effects, and variable interactions.
Segment Analysis
By Waste Type: Organic Dominance Masks Electronic Surge
Organic refuse delivered 48.2% of total tonnage in 2025, underscoring its role as the largest slice of the Qatar solid waste management market. Doha’s pilot anaerobic-digestion plant accepts 15,000 tonnes per year, selling biogas for combined heat and power; however, processing the nation’s 1.1 million-tonne organic stream would demand USD 900 million in further digestion capacity. Moisture-rich loads drive costly leachate control, yet they also present quick-win diversion potential if household segregation improves.
Electronic waste remains a relatively small waste stream but is on track to be the fastest-growing segment, expanding at an 8.51% CAGR through 2031. Extended producer responsibility rules adopted in 2024 force electronics retailers to host take-back kiosks, and major chains such as Lulu Hypermarket have already installed collection points in Doha malls. High recovery values for copper, gold, and palladium help offset processing costs, making e-waste a lucrative niche as compliance rises across the Qatar solid waste management market.


By Source: Residential Volumes Meet Industrial Complexity
Residential households supplied 47.25% of waste in 2025, reflecting per-capita outputs of 1.6 kg per day in tower districts and villa compounds. Route-planning software now cuts idle time and diesel use, but gated-community access still saps productivity. As segregation fines stiffen, operators integrate QR-tagged smart bins to reward households that keep contamination under 10%.
Industrial generators are expanding at a 6.95% CAGR as North Field liquefied natural gas (LNG) works and desalination plants boost hazardous-stream volumes. Ras Laffan’s spent catalysts and contaminated absorbents demand licensed transport and secure storage. Specialized handling elevates margins compared with residential contracts, tempting global firms to carve deeper footholds in the Qatar solid waste management market.
By Service: Treatment Dominance Yields to Recovery Momentum
Disposal and treatment functions represented 78.1% of 2025 revenue, anchored in Umm Al Afai landfill and limited mechanical-biological treatment pilots. The ministry’s directive banning direct landfilling of untreated waste after 2030 is already redirecting capital toward WtE, refuse-derived fuel co-firing, and advanced sorting lines.
Recycling and material-recovery activities are expected to record the fastest growth, registering an 8.05% CAGR. Al Afjah industrial zone awarded 51 plots strictly for recycling, spurring Averda’s PET washing line and Elite Paper’s baling facility. Digital manifests and blockchain-backed tracking assure corporate clients of traceability, encouraging more producers to finance closed-loop programs within the Qatar solid waste management market size conversation.
Geography Analysis
Doha held 50.1% of the market share in 2025, with its dominance stemming from dense population and high-value recyclable streams; however, its MRF is already operating at around 85% capacity, creating urgency for expansion or the development of satellite facilities. The municipality’s 2025 enforcement of USD 1,370 segregation fines nudged pilot-zone compliance upward, but scaling enforcement to every district hinges on digital monitoring and court capacity.
Education City in Al Rayyan earned zero-waste certification in 2024, showcasing institutional leadership that the ministry now promotes to campuses and hospitals countrywide. Hamad Port in Al Wakrah handles damaged cargo and packaging that operators bale for export, illustrating how logistics assets can monetize recyclables even when domestic offtake is weak.
The Rest of Qatar leads market expansion, with waste management activities projected to grow at a 7.35% CAGR through 2031. Peripheral municipalities such as Al Khor, Dukhan, and Mesaieed build momentum from hydrocarbons and heavy industry.[3]Msheireb Properties, “Vacuum Waste Collection Pilot Results 2025,” msheireb.com Al Khor’s incoming workforce will push residential demand; Dukhan focuses on contaminated-soil remediation; Mesaieed pioneers circular synergies using industrial by-products. The ministry has earmarked subsidies to bridge viability gaps for new MRFs and transfer stations, recognizing that infrastructure must chase shifting waste volumes across the Qatar solid waste management market.
Competitive Landscape
Qatar Solid Waste Management Market is moderately concentrated, with international majors Veolia, Averda, and Urbaser holding a significant share of municipal contracts, leveraging global operational expertise, integrated service capabilities, and strong financial resources. Local rivals such as Seashore Group and Milaha Logistics counter with last-mile reach and bundled logistics packages that integrate collection with port handling and industrial services.[4]Veolia, “Qatar Operations Fact Sheet 2025,” veolia.com
Strategic positioning revolves around vertical integration. Averda’s 2024 takeover of an Al Afjah recycler secures feedstock for its new PET wash line, while Urbaser partners with a European engineering firm to bid for the Mesaieed WtE build-operate contract. Veolia extends IoT bin networks across Education City, using real-time fill data to improve route efficiency and satisfy diversion incentives.
Technology is the new battleground. Seashore’s robotic sorting trial improved purity to 95%, unlocking higher export prices for plastics. Milaha’s fleet upgrade to compressed natural gas aligns with national energy goals and slices fuel costs by 15%. As capital requirements climb for WtE and smart infrastructure, the field will likely consolidate around 5-7 integrated operators that can finance end-to-end solutions within the Qatar solid waste management market.
Qatar Solid Waste Management Industry Leaders
-
Seashore Group
-
Averda Environmental Services
-
Veolia Qatar
-
Urbaser Qatar
-
Milaha Logistics (Waste Unit)
- *Disclaimer: Major Players sorted in no particular order

Recent Industry Developments
- May 2025: Veolia Qatar and Qatar Foundation partnered on a USD 18 million contract to install 500 IoT-enabled smart bins across Education City, optimizing routes to cut emissions by 35%. This initiative sets a new institutional standard for circular economy practices, targeting a 70% waste diversion rate by 2026.
- March 2025: Qatar's Ministry of Municipality launched a digital waste-segregation program across 250,000 premises, featuring a gamified tracking app and fines up to QAR 50,000 (USD 13,735) for non-compliance. This strict enforcement aims to drive the country toward its National Vision 2030 goal of 85% landfill diversion.
- February 2025: DSWMC awarded a USD 123 million design-build-operate contract to an Urbaser-led consortium for a 640,000-tonne WtE plant in Mesaieed, slated for 2028 grid connection.
- January 2025: Milaha Logistics added 15 compressed-natural-gas compactor trucks to service Ras Laffan and Mesaieed.


Qatar Solid Waste Management Market Report Scope
| Organic (Food & Yard) Waste |
| Paper & Cardboard |
| Plastic Waste |
| Metal Waste |
| Glass Waste |
| E-Waste |
| Textiles & Leather |
| Others (Rubber, Wood, etc.) |
| Residential |
| Commercial (Office, Retail, etc.) |
| Industrial |
| Institutional |
| Municipal Services (Street Cleaning, Parks, etc.) |
| Construction & Demolition |
| Collection, Transportation, Segregation & Pre-Processing | |
| Disposal/Treatment Method | Recycling & Material Recovery |
| Composting | |
| Anaerobic Digestion | |
| Energy Recovery (WtE / RDF / Biogas) | |
| Landfilling | |
| Others (Incineration w/o Energy Recovery, MBT) | |
| Ancillary & Support Services (Auditing, Consulting, Smart Waste) |
| Doha |
| Al Rayyan |
| Al Wakrah |
| Rest of Qatar |
| By Waste Type | Organic (Food & Yard) Waste | |
| Paper & Cardboard | ||
| Plastic Waste | ||
| Metal Waste | ||
| Glass Waste | ||
| E-Waste | ||
| Textiles & Leather | ||
| Others (Rubber, Wood, etc.) | ||
| By Source | Residential | |
| Commercial (Office, Retail, etc.) | ||
| Industrial | ||
| Institutional | ||
| Municipal Services (Street Cleaning, Parks, etc.) | ||
| Construction & Demolition | ||
| By Service | Collection, Transportation, Segregation & Pre-Processing | |
| Disposal/Treatment Method | Recycling & Material Recovery | |
| Composting | ||
| Anaerobic Digestion | ||
| Energy Recovery (WtE / RDF / Biogas) | ||
| Landfilling | ||
| Others (Incineration w/o Energy Recovery, MBT) | ||
| Ancillary & Support Services (Auditing, Consulting, Smart Waste) | ||
| By City | Doha | |
| Al Rayyan | ||
| Al Wakrah | ||
| Rest of Qatar | ||


Key Questions Answered in the Report
How large is the Qatar solid waste management market in 2026?
It is estimated at USD 2.90 billion in 2026, on its way to USD 3.91 billion by 2031.
Which waste type leads current tonnage?
Organic refuse mainly food and yard trimmings held 48.2% of total volume in 2025.
What segment is growing fastest?
Electronic waste is projected to rise at an 8.51% CAGR from 2026 to 2031 as gadget turnover accelerates.
Why are waste-to-energy projects increasing?
Landfill space is limited and National Vision 2030 targets 85% diversion; WtE plants offer thermal treatment and electricity generation that align with these goals.
Who are the main service providers?
Veolia, Averda, and Urbaser dominate municipal contracts, while Seashore Group and Milaha Logistics focus on commercial and industrial clients.
What is the biggest regulatory deadline ahead?
By December 2027, every premise must segregate waste into organic, recyclable, and residual streams or face escalating fines.
Page last updated on:


