Prosthetic Liners Market Size and Share
Market Overview
| Study Period | 2020 - 2031 |
|---|---|
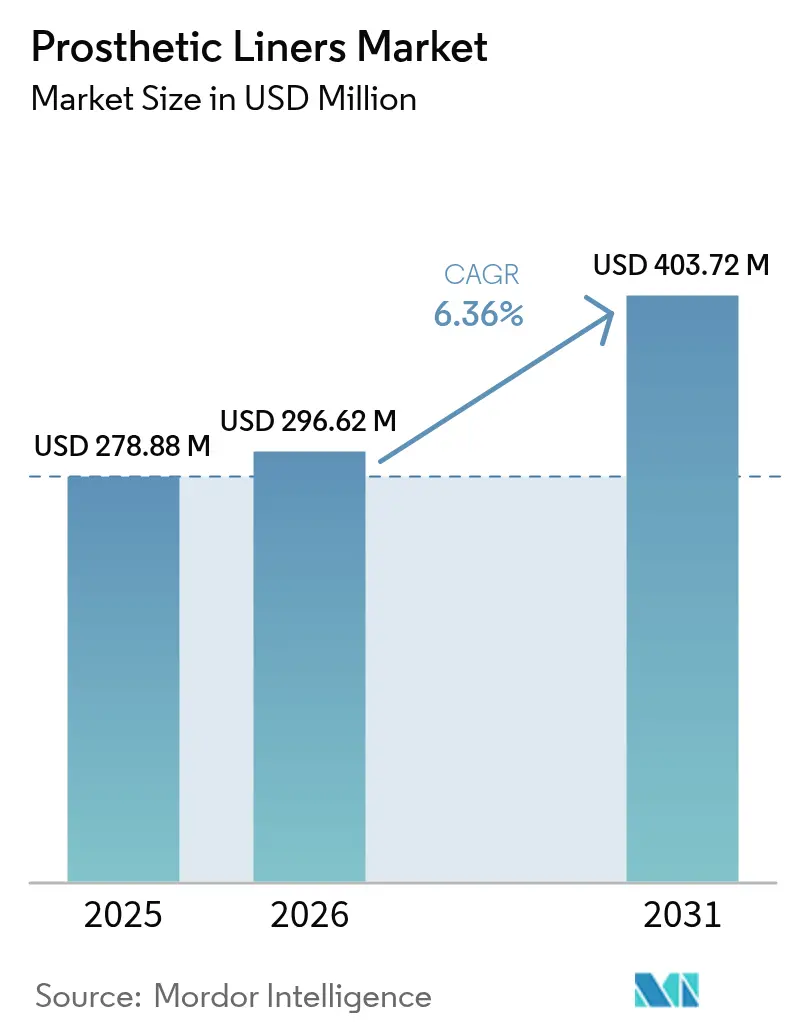
| Market Size (2026) | USD 296.62 Million |
| Market Size (2031) | USD 403.72 Million |
| Growth Rate (2026 - 2031) | 6.36% CAGR |
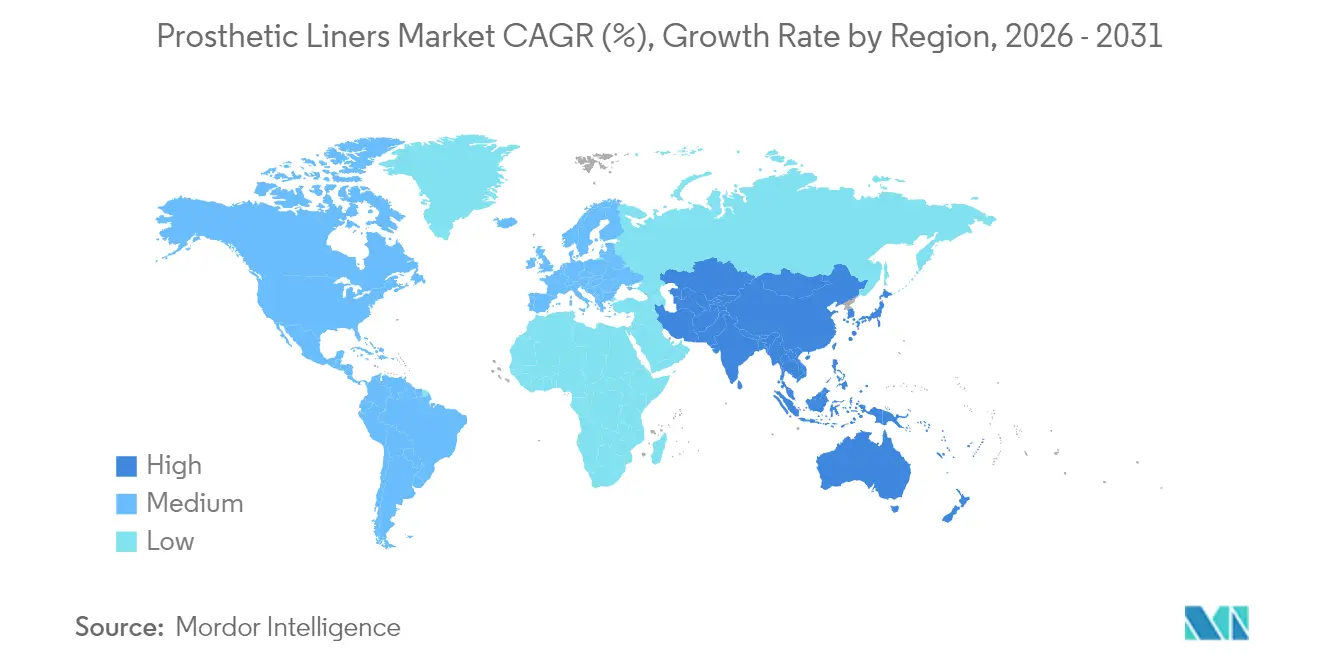
| Fastest Growing Market | Asia Pacific |
| Largest Market | North America |
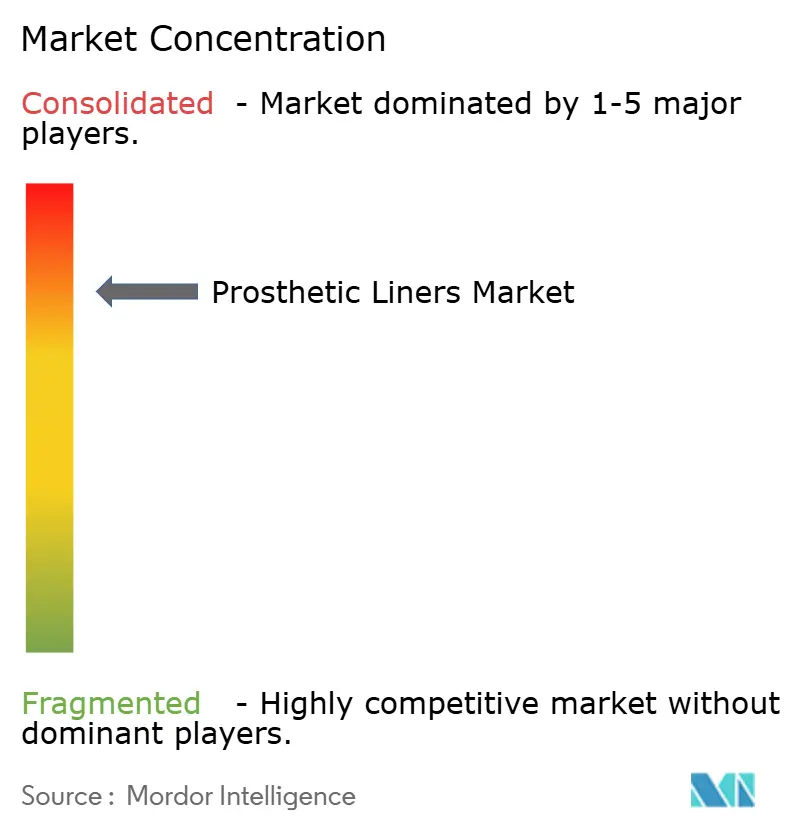
| Market Concentration | High |
Major Players *Disclaimer: Major Players sorted in no particular order Image © Mordor Intelligence. Reuse requires attribution under CC BY 4.0. | |
Prosthetic Liners Market Analysis by Mordor Intelligence
The Prosthetic Liners Market size was valued at USD 278.88 million in 2025 and estimated to grow from USD 296.62 million in 2026 to reach USD 403.72 million by 2031, at a CAGR of 6.36% during the forecast period (2026-2031). This expansion stems from the combined weight of diabetes-related amputations, rapid advances in medical-grade silicones, and payer policies that favor early investment in premium liners to avoid downstream complications. Clinical demand is also lifted by 3-D scanning workflows that compress chair time, raise first-fit success, and strengthen patient adherence [1]Julio A. Rivera, “Estimating Recent US Limb Loss Prevalence and Updating Future Projections,” Archives of Rehabilitation Research and Clinical Translation, sciencedirect.com . Manufacturers that once leaned on conventional molding are racing to pair digital customization with lighter supply chains, even as a tighter ISO 10993 chemical-characterization regime reshapes R&D roadmaps. Institutional buyers now budget more for supply-chain resilience, mirroring a wider med-tech shift toward diversified raw-material sources. Within this climate the prosthetic liners market benefits from a steady inflow of diabetic and trauma patients who require frequent liner replacement cycles, anchoring multi-year revenue visibility for incumbents and entrants.
Key Report Takeaways
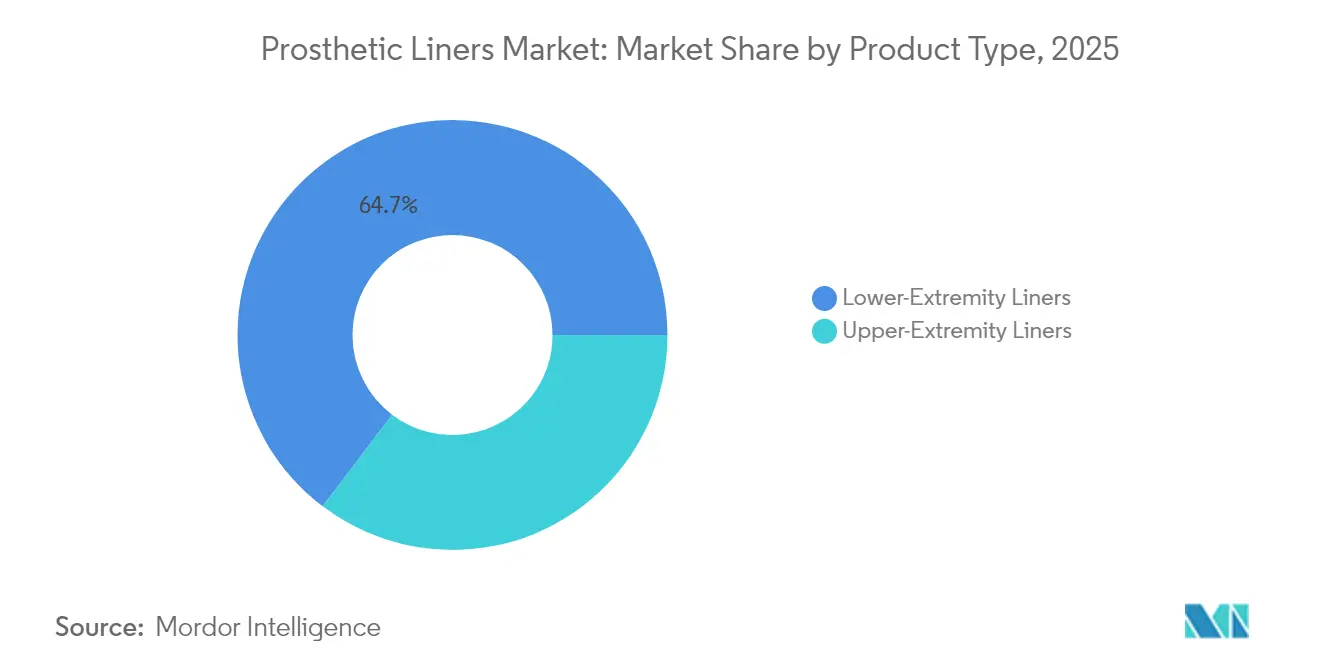
- By product type, lower-extremity liners held 64.68% of prosthetic liners market share in 2025, while upper-extremity units are set to register a 7.12% CAGR to 2031.
- By material, silicone captured 55.67% revenue in 2025; thermoplastic elastomers are the fastest riser at a 6.97% CAGR through 2031.
- By suspension style, pin-lock systems led with 55.35% share in 2025, whereas cushion designs are tracking a 7.03% CAGR to 2031.
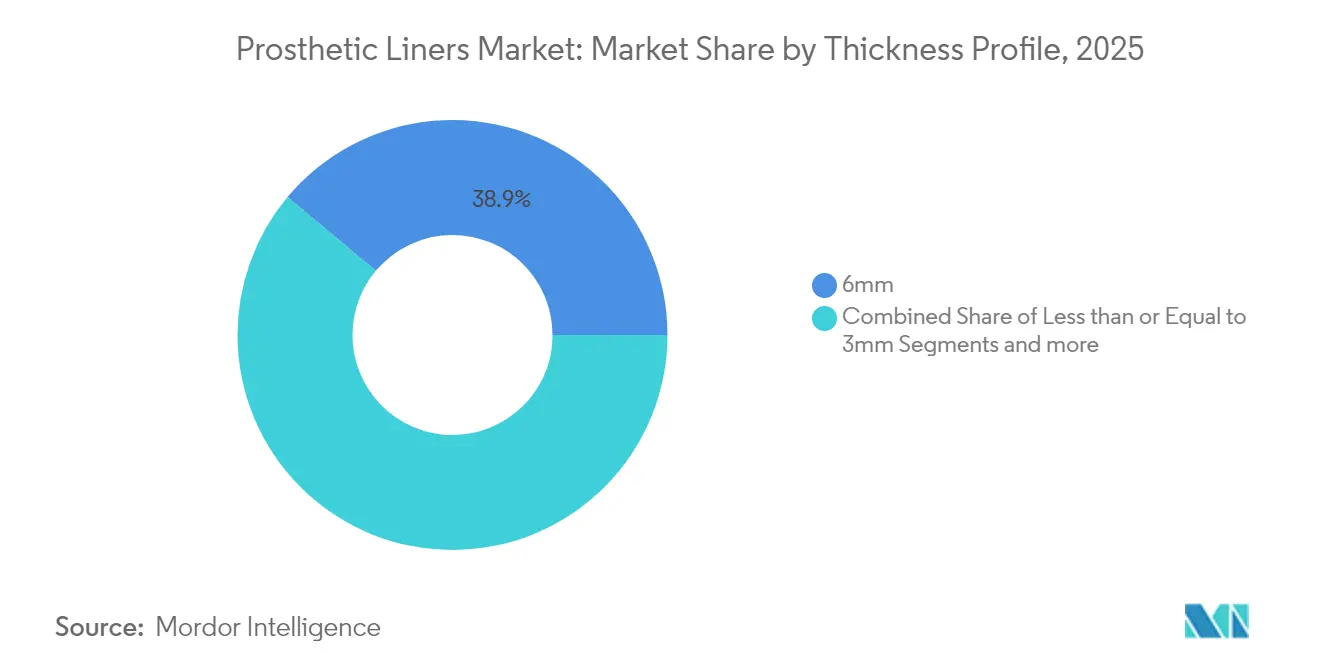
- By thickness, 6 mm liners commanded 38.92% share in 2025; ≤ 3 mm profiles are expanding at a 7.01% CAGR until 2031.
- By end user, hospitals and clinics accounted for 64.83% demand in 2025, while ambulatory surgical centers show a 6.93% growth path to 2031.
- By geography, North America contributed 42.02% of 2025 revenue; Asia-Pacific is projected to advance at a 7.15% CAGR through 2031.
Note: Market size and forecast figures in this report are generated using Mordor Intelligence’s proprietary estimation framework, updated with the latest available data and insights as of 2026.
Global Prosthetic Liners Market Trends and Insights
Drivers Impact Analysis*
| Driver | (~) % Impact on CAGR Forecast | Geographic Relevance | Impact Timeline |
|---|---|---|---|
| Rising incidence of diabetes-related amputations | +1.8% | North America, Europe, Global | Long term (≥ 4 years) |
| Growing number of road-traffic & industrial accidents | +1.2% | Asia-Pacific, MEA, South America | Medium term (2–4 years) |
| Expanding reimbursement coverage for advanced liners | +1.1% | North America, EU, Asia-Pacific | Medium term (2–4 years) |
| Rapid material innovation in medical-grade silicones | +0.9% | Global | Short term (≤ 2 years) |
| Mass-customized 3-D-scanned liners lowering refit rates | +0.7% | North America, EU → Global | Medium term (2–4 years) |
| Multi-patient sterilizable compression liners for clinics | +0.4% | Emerging markets, Global | Long term (≥ 4 years) |
| Source: Mordor Intelligence | |||
Rising incidence of diabetes-related amputations
Diabetes is reshaping global limb-loss epidemiology by pushing vascular disease ahead of trauma as the leading cause of lower-limb amputation. Peer-reviewed projections indicate limb-loss prevalence could jump 145% by 2060 if metabolic trends hold. The shift swells the addressable base for premium liners because diabetic amputees present fluctuating limb volumes and elevated infection risk, prompting prosthetists to specify breathable silicones with embedded antimicrobials. Payers now view such upgrades as cost-avoidance tools that lower readmission rates and ulcer-care outlays. Device makers that bundle diabetes-specific clinical education with liners gain a competitive foothold among hospital purchasing teams and value-based insurance networks.
Growing number of road-traffic & industrial accidents
Trauma remains a sizeable, demographically younger cohort that demands rugged liners capable of supporting high-activity lifestyles. A global prevalence study recorded 57.7 million traumatic amputees in 2017, with road injuries making up 15.7% and mechanical forces 10.4% of cases. Asia-Pacific registers the heaviest burden as urbanization and industrialization progress faster than occupational-safety frameworks. These patients seek durable liners with sensor-ready interfaces for activity tracking, which in turn nudges OEMs toward multi-material composites that can dissipate shear without adding bulk. Economic analyses tie fast return-to-work rates to higher-grade liner adoption, reinforcing payer willingness to reimburse performance-oriented models in trauma centers.
Expanding reimbursement coverage for advanced liners
Regulators continue to adjust fee schedules to reflect functional benefits rather than device class alone. In 2024 the US Medicare contractor network introduced discrete HCPCS modifiers that shorten claims cycles for advanced liner codes. Commercial insurers followed by amending policy language to cover microprocessor-compatible liners contingent on functional-level scoring. Parallel developments in Europe under value-based procurement models now reward demonstrable pressure-distribution gains or moisture-management metrics. These moves reduce out-of-pocket barriers, enabling prosthetic clinics to present premium liners as cost-neutral relative to conventional options when lifetime maintenance is factored.
Rapid material innovation in medical-grade silicones
Silicone suppliers have delivered new chemistries that meet USP Class VI and ISO 10993 while improving tear resistance and water-vapor transmission. Producers such as Elkem deploy proprietary cross-linking that raises tensile strength yet preserves elasticity, thereby mitigating the 90.9% dermatological-issue prevalence documented among liner users. Pilot studies with perforated silicone sleeves record a 4% skin-temperature drop alongside lower humidity levels, directly answering patient comfort pain points. The result is a value proposition rooted in outcome data rather than generic softness claims, helping justify premium pricing in tender bids.
Restraints Impact Analysis*
| Restraint | (~) % Impact on CAGR Forecast | Geographic Relevance | Impact Timeline |
|---|---|---|---|
| High average selling price of premium liners | −1.3% | Emerging markets, Global | Medium term (2–4 years) |
| Dermatological complications & heat-rash issues | −0.8% | Humid climates, Global | Short term (≤ 2 years) |
| Lack of liner-specific biocompatibility test standards | −0.6% | North America, EU | Long term (≥ 4 years) |
| Volatile medical-grade silicone supply chain | −0.5% | Asia-Pacific manufacturing hubs, Global | Medium term (2–4 years) |
| Source: Mordor Intelligence | |||
High average selling price of premium liners
Price remains the primary adoption hurdle when payer caps lag behind material-cost inflation. Advanced liners can retail at triple the price of entry models, and amputees typically need multiple replacements during the socket-life cycle. Economists note that a transtibial patient fitted at age 40 could face liner expenses across a 30-year horizon that rival household income levels in emerging economies. Multinational vendors have responded with tiered catalogues yet still confront sticker shock in self-pay markets, slowing penetration despite clear clinical benefits. Until reimbursement catch-up or cost-down innovation closes the gap, value offerings will dominate rural and low-income geographies.
Dermatological complications & heat-rash issues
Occlusive liners create a micro-environment prone to moisture build-up, bacterial colonization, and skin maceration. A frequently cited clinical audit found 90.9% of transtibial prosthesis users reporting at least one skin complaint tied to roll-on liners. Episodes of infection extend rehabilitation downtime and often necessitate costly wound care, directly eroding payer savings projected from premium products. Though perforated liners and antimicrobial coatings show promise, perfect equilibrium between airtight suspension and breathable comfort continues to elude designers, and clinical outcomes vary widely with climate and activity level.
*Our forecasts treat driver/restraint impacts as directional, not additive. The impact forecasts reflect baseline growth, mix effects, and variable interactions.
Segment Analysis
By Product Type: Lower-Extremity Dominance Drives Volume
Lower-extremity devices generated 64.68% of prosthetic liners market revenue in 2025 on the back of high diabetes-linked transtibial and transfemoral caseloads. Hospitals value the stability that premium lower-limb liners bring to gait rehabilitation, and the category benefits from proven reimbursement codes that shorten the claim cycle. The prosthetic liners market size attributable to lower limbs is forecast to widen steadily through 2031 as vascular-disease prevalence rises. In contrast, upper-extremity liners are gaining momentum with a 7.12% CAGR tied to myoelectric hand adoption and growing clinical interest in partial-hand reconstruction.
Upper-extremity amputees skew younger and prioritize dexterity, which allows suppliers to position smart liners with embedded electrodes despite higher unit prices. Developers are also leveraging 3-D silicone printing to create anatomically contoured finger sheaths that marry cosmetic appearance with reliable suspension. As these niche breakthroughs scale, upper-limb penetration will expand overall prosthetic liners market addressability, reducing dependence on lower-limb volumes for topline growth.


By Material: Silicone Leadership Faces TPE Challenge
Silicone maintained 55.67% dominance in 2025, benefitting from decades of clinical data proving hypoallergenic performance and long-wear durability. The material’s cross-link density preserves elasticity across temperature swings, a feature valued in both temperate and tropical regions. Despite this commanding position, thermoplastic elastomers are advancing at 6.97% CAGR to become the most disruptive rival. The prosthetic liners market size tied to TPE products remains modest but gains disproportionate mindshare because extrusion and injection-molding lines already installed for consumer goods can transition to medical output with minimal re-tooling.
TPE also supports rapid-cycle color matching and is compatible with fused-deposition 3-D printers, allowing localized production near clinics that lack silicone-curing ovens. Hybrid composite formulas that layer silicone interior surfaces with TPE exteriors are emerging to bridge comfort and cost norms. As payers in developing economies push for price-aligned outcomes, mid-tier TPE offerings will absorb volume from entry silicones, moving market dynamics toward a dual-material equilibrium.
By Suspension Mechanism: Pin-Lock Maturity Versus Cushion Innovation
Pin-lock liners delivered 55.35% revenue in 2025 because prosthetists trust their mechanical latch to resist axial displacement during high-impact activity. This segment’s entrenched protocols and training manuals ensure predictable outcomes, fostering prescriber confidence that offsets its heavier don-and-doff sequence. The prosthetic liners market share could erode gradually as cushion designs refine compression-gradient mapping and easy roll-on usability.
Cushion mechanisms, tracking a 7.03% CAGR, appeal to older and neuropathic cohorts who prioritize comfort and simple handling over maximum retention. Ventilated cushion models now channel perspiration through micro-valves, reducing epidermal stress in hot climates. Some developers integrate passive vacuum cups with cushion interfaces, blending the best of two paradigms without adding external pumps. If ongoing clinical trials confirm reduced pistoning under variable load, cushion uptake may accelerate in long-term care settings, redefining suspension best practice by decade close.
By Thickness Profile: Clinical Preferences Drive 6 mm Dominance
A 6 mm standard thickness controlled 38.92% of the segment in 2025 and remains the default prescription in most prosthetic centers. The prosthetic liners market size for this profile benefits from the balance it strikes between impact cushioning and socket clearance, simplifying inventory management for clinics. Thinner ≤ 3 mm liners, although only a subset today, are advancing at 7.01% CAGR, propelled by high-strength silicone blends that preserve protective function despite lower bulk.
Thinner walls boost proprioception and support minimalist socket designs that mimic the contralateral limb, an aesthetic edge welcomed by active users. Research from controlled case reports shows wound-closure timelines improve when liners supply uniform pressure with less distal bunching. Greater-than-9 mm formats still serve hypersensitive residual limbs but face constraints in modern low-profile hardware systems that prioritize range of motion. Over time, success of high-performance thin liners will depend on demonstrable reductions in volume fluctuation rather than lab tensile tests alone.
By End User: Hospital Dominance Faces ASC Disruption
Hospitals and integrated rehabilitation centers controlled 64.83% share in 2025, drawing on multidisciplinary care teams, insurer relationships, and complex-case throughput. Teaching hospitals in North America and Europe act as early evaluation sites for next-generation liners, giving manufacturers KOL endorsements that ripple through private practice networks. The prosthetic liners market size linked to hospital channels will rise more modestly than the broader market as case mix shifts out of inpatient pathways.
Ambulatory surgical centers, predicted to climb at 6.93% CAGR, leverage lower overhead and appointment agility to lure uncomplicated residual-limb cases. Cloud-based scanning kiosks have trimmed in-clinic time, making ASCs viable for socket plus liner delivery within a compressed timeline. Pay-for-performance insurance models also incentivize same-day mobilization milestones, a metric ASCs can hit using pre-configured liner libraries. Home-care and boutique prosthetic studios remain niche for now, constrained by reimbursement and logistics rather than consumer interest.
Geography Analysis
North America accounted for 42.02% of 2025 global revenue, supported by Medicare Part B rules that reimburse 80% of medically necessary prosthetic supplies once deductibles clear. The region’s dense prosthetist network and extensive diabetes-management programs ensure a steady inflow of candidates, while private insurers mirror federal coding, further smoothing advanced-liner uptake . FDA guidance updates that accept chemical-equivalency data in lieu of full animal testing have shortened time-to-market for incremental material tweaks, encouraging continuous portfolio refresh.
Asia-Pacific stands out as the fastest-growing territory with a 7.15% CAGR thanks to rising household incomes, stimulative public-insurance pilots, and domestic manufacturing clusters that whittle logistics cost. China and India together recorded a sizable increase in amputation procedures, reflecting both urban trauma incidence and expanding chronic-disease screening. Regulators are harmonizing device rules with global ISO standards, enabling regional OEMs to submit single dossier sets for multiple ASEAN markets. That convergence will help the prosthetic liners market capture latent demand among the estimated tens of thousands of amputees who still rely on outdated suction socks.
Europe posts stable yet slower growth, supported by public health systems that guarantee prosthetic access but impose rigorous post-market surveillance under the Medical Device Regulation framework. Germany, France, and the United Kingdom remain procurement strongholds where tender boards weigh real-world performance data heavily, pushing suppliers to generate multi-center outcome studies . Southern and Eastern European states show incremental volume expansion as EU structural funds improve rehabilitation infrastructure. Elsewhere, selected Middle Eastern and Latin American nations demonstrate nascent demand, although lower reimbursement ceilings and clinician shortages moderate adoption of premium liners.

Competitive Landscape
Market leadership is shared among a handful of multinational firms with vertically integrated silicone molding, direct-to-clinic sales teams, and regulatory science units that navigate cross-border submissions. These players lock in hospital accounts through continuing-education programs and loaner-inventory schemes that reduce downtime when refits are needed. Competitive churn now pivots on digital customization; the first mover to supply a seamless app-to-print workflow for replacement liners can capture recurring consumable revenue while raising switching costs for clinics.
Smaller innovators target white spaces such as pediatric sizes, upper-extremity specialty shapes, and sensorized liners that stream data to gait-analysis dashboards. Partnerships between liner manufacturers and bionic-hand producers are becoming common, allowing bundled reimbursement claims for integrated systems. In February 2024 Hanger deepened its prosthetic component portfolio by acquiring Fillauer, giving it an expanded distribution footprint and additional silicone expertise. Consolidation of this type squeezes mid-tier competitors that lack either scale or unique IP, nudging them toward contract manufacturing or niche therapeutic areas.
Regulatory policy continues to influence rivalry. The FDA’s 2024 refinement of ISO 10993 adherence for intact-skin devices reduced redundant test spending, freeing cash for R&D aimed at moisture-management breakthroughs. European Union vigilance audits meanwhile elevate post-market evidence thresholds, creating compliance drag for smaller entrants yet offering larger firms a differentiator through robust clinical-outcomes databases. Supply-chain risk mitigation has become a board-level theme, with some OEMs relocating a share of silicone compounding to secondary continents to hedge geopolitical shocks and raw-material spikes.
Prosthetic Liners Industry Leaders
Ossur
Ottobock
WillowWood Global LLC
Blatchford Limited
ALPS South, LLC
- *Disclaimer: Major Players sorted in no particular order

Recent Industry Developments
- January 2025: TG0, a United Kingdom health-tech start-up, unveiled a wireless-sensor prosthetic liner that continuously maps pressure spots to pre-empt skin breakdown, aiming to curb the 22% device-abandonment rate reported in NHS studies.
- April 2024: Ossur hf received grant funding to engineer an adjustable seal system that merges a textile sleeve with a vacuum skirt, targeting leakage issues common in elderly transtibial users.
- April 2024: Ossur hf secured a second grant to develop a ventilated liner with built-in moisture channels and a distal cup, promising enhanced thermoregulation for high-activity patients.


Research Methodology Framework and Report Scope
Market Definitions and Key Coverage
Our study defines the prosthetic liners market as the annual value of soft interface sleeves, principally silicone, thermoplastic elastomer, or polyurethane, that are fitted over an amputee's residual limb to cushion and suspend upper or lower extremity prosthetic sockets. Values capture both first-fit and replacement liners supplied through clinical, hospital, and specialized retail channels across 17 major countries.
Scope Exclusion: Adhesive sprays, socks, full prosthetic sockets, and orthotic liners are outside this assessment.
Segmentation Overview
- By Product Type
- Upper-Extremity Liners
- Lower-Extremity Liners
- By Material
- Silicone
- Thermoplastic Elastomer (TPE)
- Others
- By Suspension Mechanism
- Pin-Lock Liners
- Cushion Liners
- Others
- By Thickness Profile
- Less than or Equal to 3mm
- 6mm
- Greater than or equal to 9mm
- By End User
- Hospitals and Clinics
- Ambulatory Surgical Centers
- Others
- By Geography
- North America
- United States
- Canada
- Mexico
- Europe
- Germany
- United Kingdom
- France
- Italy
- Spain
- Rest of Europe
- Asia-Pacific
- China
- Japan
- India
- Australia
- South Korea
- Rest of Asia-Pacific
- Middle East and Africa
- GCC
- South Africa
- Rest of Middle East and Africa
- South America
- Brazil
- Argentina
- Rest of South America
- North America
Detailed Research Methodology and Data Validation
Primary Research
Interviews with orthopedic surgeons, prosthetists, liner R&D managers, and payers in North America, Europe, and Asia-Pacific clarified real-world replacement cycles, silicone versus TPE adoption, and country-level reimbursement ceilings. Feedback allowed us to stress test secondary assumptions and calibrate penetration ramps in emerging markets.
Desk Research
Mordor analysts began with publicly available datasets from bodies such as the World Health Organization, the International Diabetes Federation, and the Global Burden of Disease Study, which quantify amputation incidence and prevalence. We then pulled shipment statistics from customs portals, reimbursement fee schedules posted by CMS and comparable European payers, and patent filings retrieved via Questel to track material innovations. Company 10-K filings and regulatory approvals in FDA 510(k) and CE databases provided average selling price (ASP) cues. Select paywalled inputs, D&B Hoovers for company financial splits and Dow Jones Factiva for volume-weighted price news, helped refine regional shares. This listing is illustrative; many additional sources supported data collection and validation.
Market-Sizing & Forecasting
A top-down prevalence to treated cohort build reconstructed demand pools from annual new amputations and installed prosthetic bases, which are then multiplied by liner replacement frequency and localized ASPs. Bottom-up supplier roll-ups and channel checks validated totals. Key model drivers include lower limb amputation rates, average liner life in months, material mix shifts toward silicone, reimbursement coverage ceilings, diabetic adult population growth, and ASP deflation from competitive bids. Multivariate regression, supplemented by scenario analysis around insurance policy shifts, projected 2026 to 2030 values; gaps in bottom-up inputs were bridged through regional weighting derived from customs data.
Data Validation & Update Cycle
Outputs pass variance checks against independent prosthetic component imports, mortality statistics, and prior year sales signals before senior analyst sign-off. Reports refresh annually, with mid-cycle updates triggered by material events, ensuring clients receive the latest vetted outlook.
Why Our Prosthetic Liners Baseline Commands Reliability
Published figures often differ because firms vary device scope, apply unmatched ASP assumptions, and refresh on dissimilar cadences. By anchoring on treated patient pools and verifying frequency of liner replacement through clinician interviews, Mordor delivers a balanced, transparent baseline.
Key drivers of divergence include whether pediatric liners are counted, if private label ASP discounts are modeled, currency conversion year, and the aggressiveness of CAGR assumptions when trauma-related amputations plateau.
Benchmark comparison
| Market Size | Anonymized source | Primary gap driver |
|---|---|---|
| USD 278.9 M (2025) | Mordor Intelligence | - |
| USD 204.1 M (2024) | Global Consultancy A | Excludes replacement liners sold via online portals |
| USD 194.9 M (2024) | Industry Association B | Uses uniform ASP without material differentiation |
| USD 580.2 M (2024) | Trade Journal C | Counts socket adhesives and general orthotic sleeves |
In sum, the disciplined scope, prevalence based modeling, and annual refresh cycle adopted by Mordor Intelligence provide decision makers with a dependable, reproducible market baseline that avoids overstated totals and hidden exclusions.


Key Questions Answered in the Report
What is the current value of the prosthetic liners market?
The prosthetic liners market stands at USD 296.62 million in 2026 and is projected to reach USD 403.72 million by 2031.
Which region generates the highest revenue for prosthetic liners?
North America leads with 42.02% of 2025 global revenue, driven by comprehensive reimbursement and an extensive prosthetist network.
Which segment is expanding fastest within the prosthetic liners market?
Upper-extremity liners exhibit the fastest growth at a 7.12% CAGR thanks to rising adoption of advanced myoelectric prosthetics.
Why are thermoplastic elastomer liners gaining attention?
TPE liners grow at 6.97% CAGR because they combine lower production costs with compatibility for rapid 3-D printing customization.
How does reimbursement affect liner adoption?
Policy updates that recognize the long-term cost savings of premium liners reduce patient out-of-pocket expenses and accelerate uptake, especially in North America and Europe.
What is the main challenge to wider use of premium liners?
High selling prices, sometimes triple that of entry-level models, limit accessibility in emerging markets even when clinical benefits are clear.
Page last updated on:


