
Technology, Media and Telecom
5th MayPricing Strategy for Semiconductor Components
3 Min Read
Professional Service Robots Market is Segmented by Robot Type (Field Robots, Professional Cleaning Robots, and More), Mobility (Autonomous Mobile Robots, Stationary Service Robots, and More), Application (Transportation and Logistics, Healthcare and Medical Services, and More), End-User Industry (Warehousing and 3PL, and More), and Geography (North America, South America, Europe, Asia-Pacific, and Middle East and Africa).
Market Overview
| Study Period | 2020 - 2031 |
|---|---|
| Market Size (2026) | USD 91.61 Billion |
| Market Size (2031) | USD 277.13 Billion |
| Growth Rate (2026 - 2031) | 24.78 % CAGR |
| Fastest Growing Market | Middle East and Africa |
| Largest Market | Asia Pacific |
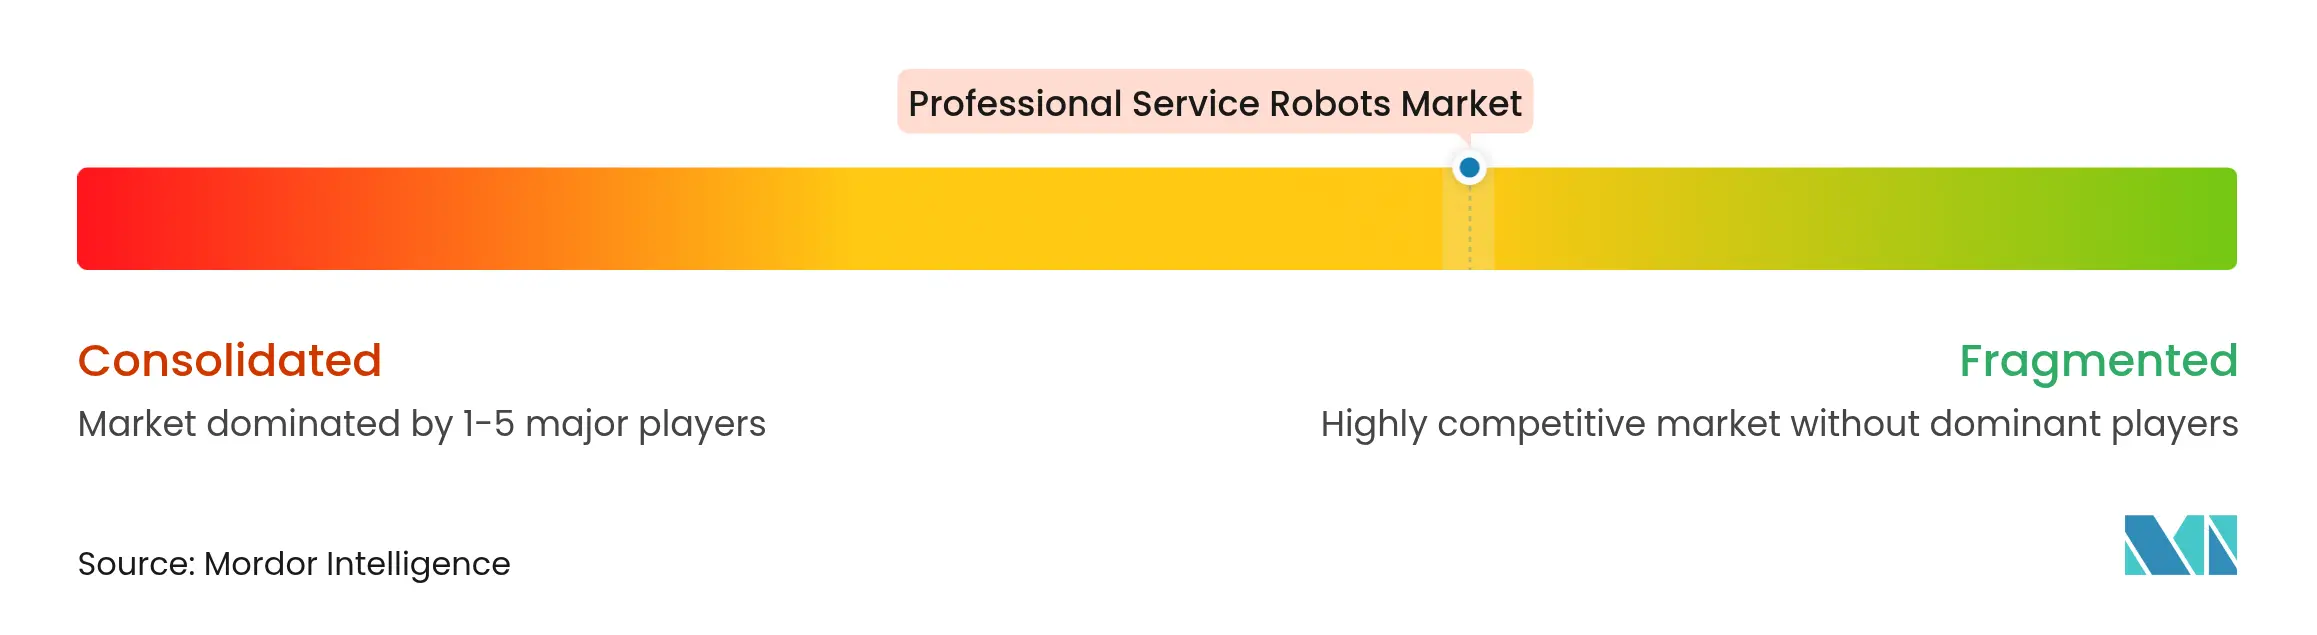
| Market Concentration | Medium |
Major Players *Disclaimer: Major Players sorted in no particular order. Image © Mordor Intelligence. Reuse requires attribution under CC BY 4.0. |
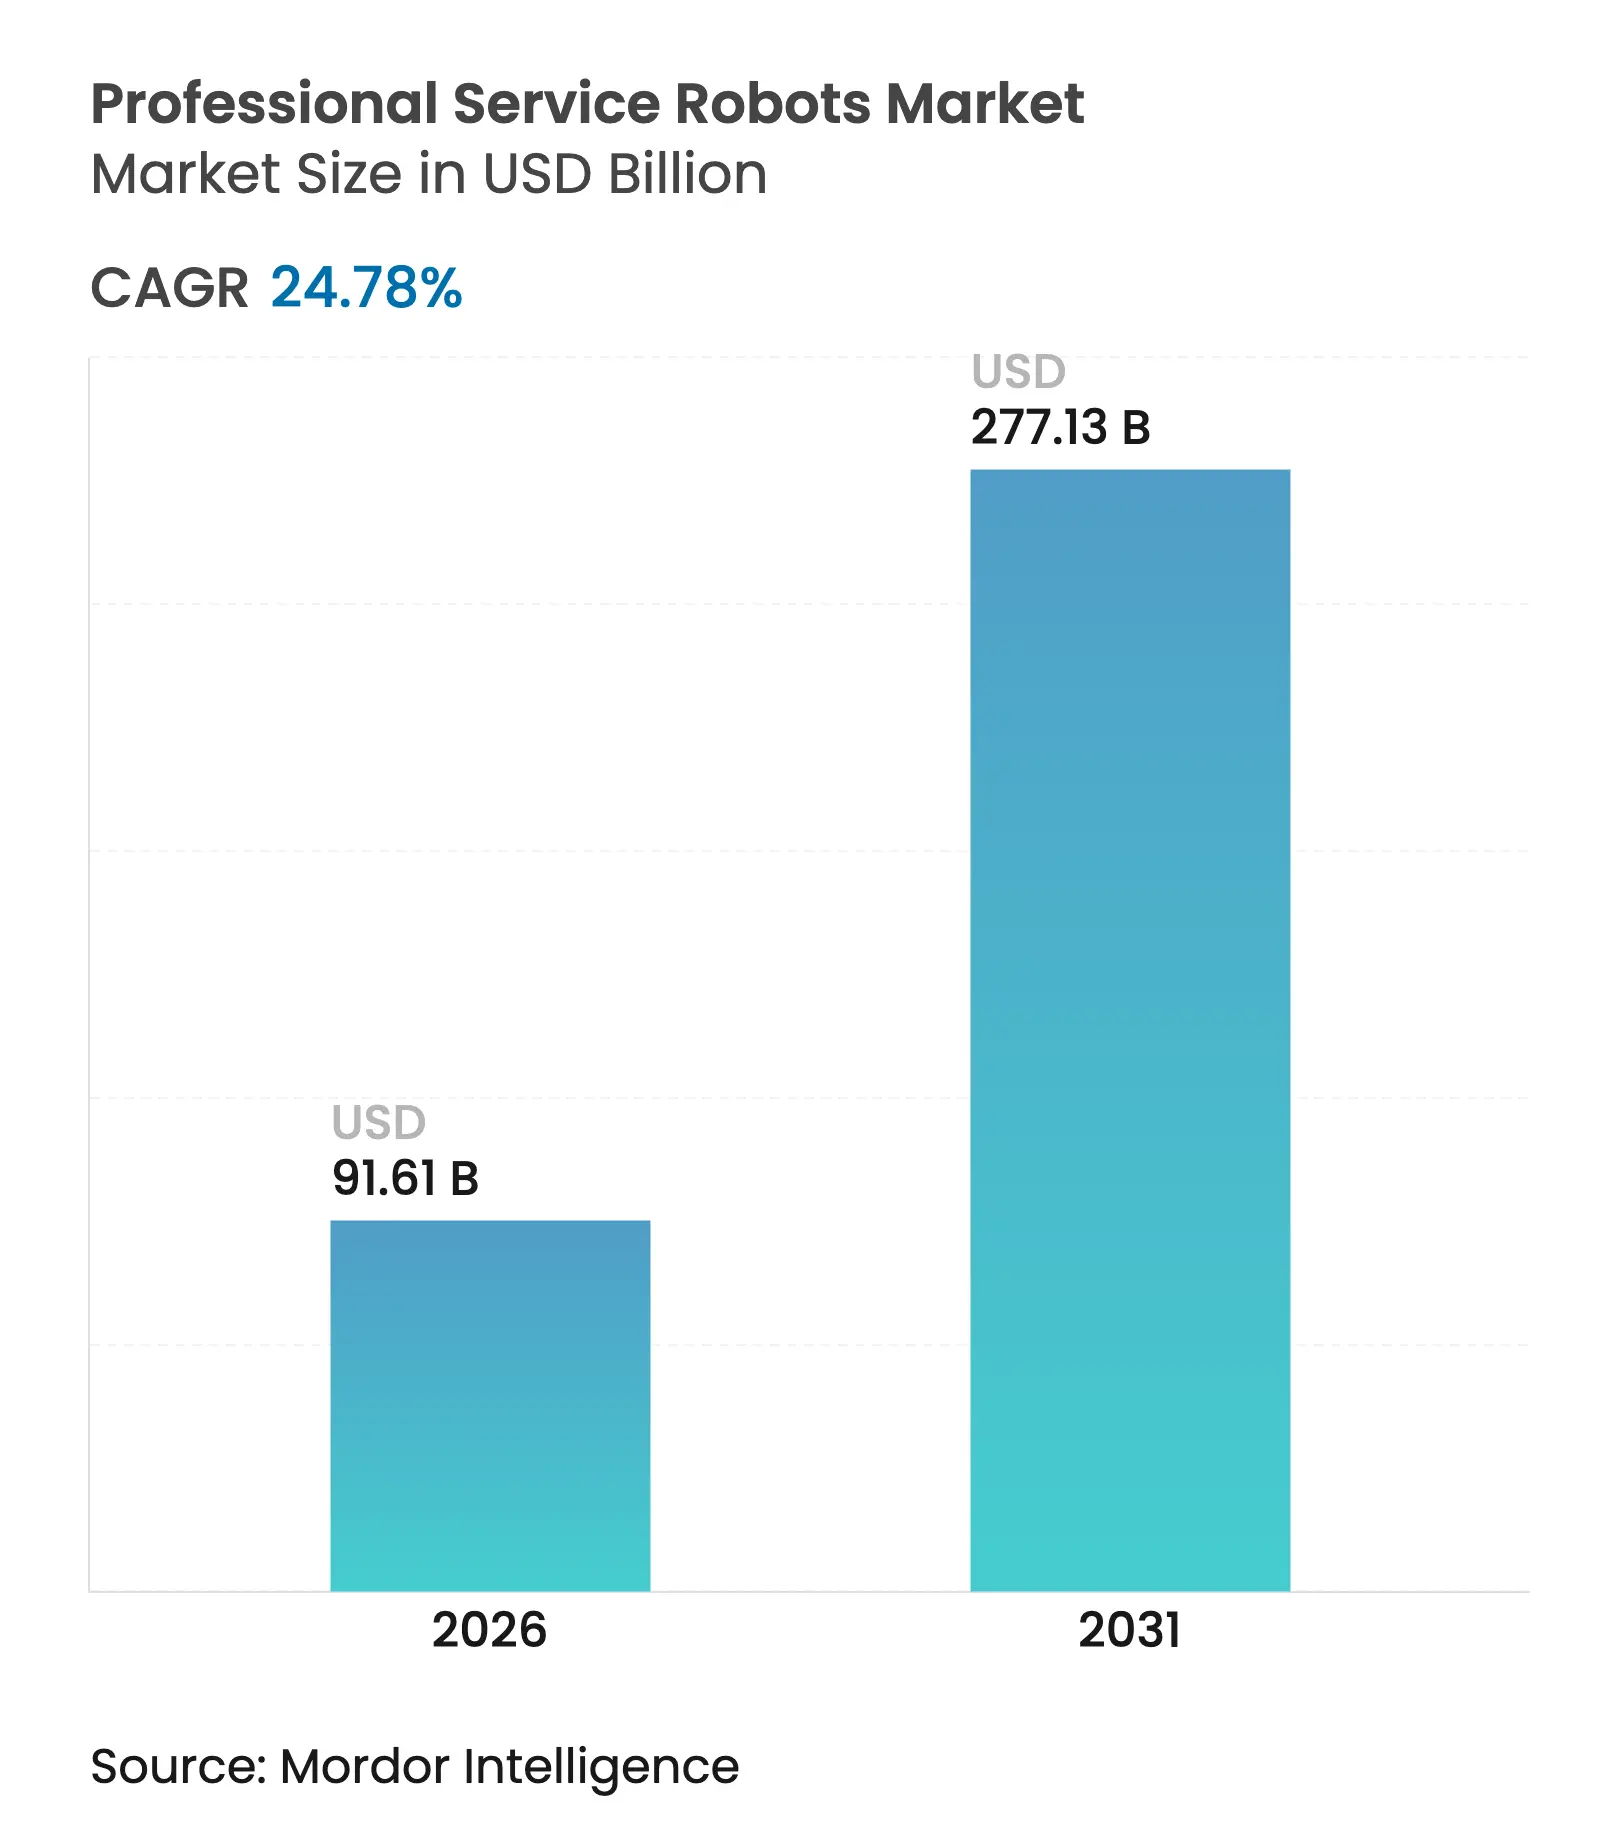
The professional service robots market size was valued at USD 73.42 billion in 2025 and estimated to grow from USD 91.61 billion in 2026 to reach USD 277.13 billion by 2031, at a CAGR of 24.78% during the forecast period (2026-2031). Market momentum stemmed from breakthroughs in artificial intelligence, the rollout of private 5G networks, and acute labor shortages that pushed enterprises toward automation-as-a-service. Organizations adopted robotics-as-a-service subscriptions to convert large capital outlays into ongoing operating expenses, improving payback periods and accelerating project approvals.
Asia-Pacific retained 79.1% of global revenue in 2024, propelled by China’s factory automation boom and Japan’s demographic pressures.[1]International Federation of Robotics, “World Robotics 2023 Report: Asia Ahead of Europe and the Americas,” ifr.org The Middle East and Africa were the fastest-growing regions, posting a 28.2% CAGR on the back of multi-billion-dollar national technology programs in Saudi Arabia and the UAE. Logistics systems led robot-type adoption with 41.4% revenue share, while public relations and hospitality robots delivered the highest‐segment growth at 34.3% CAGR. Autonomous mobile robots (AMRs) held 68.6% of the mobility segment, yet tethered and tele-operated units recorded a 30.2% CAGR as private 5G networks enabled ultra-low latency remote control. Transportation and logistics applications accounted for 38.3% of spending, whereas hospitality and retail services grew 35.3% per year as businesses sought contact-free customer engagement.
Key Report Takeaways
Note: Market size and forecast figures in this report are generated using Mordor Intelligence's proprietary estimation framework, updated with the latest available data and insights as of 2026.
Drivers Impact Analysis
| Driver | (~) % Impact on CAGR Forecast | Geographic Relevance | Impact Timeline | |||
|---|---|---|---|---|---|---|
Aging-workforce pressure in OECD and China
Aging-workforce pressure in OECD and China
| +4.2% | OECD countries, China, Japan | Long term (≥ 4 years) |
(~) % Impact on CAGR Forecast
:
+4.2%
|
Geographic Relevance
:
OECD countries, China, Japan
|
Impact Timeline
:
Long term (≥ 4 years)
|
E-commerce fulfilment automation boom
E-commerce fulfilment automation boom
| +5.8% | Global, strong in North America and APAC | Medium term (2-4 years) | |||
AI-enabled multi-sensor fusion improvements
AI-enabled multi-sensor fusion improvements
| +3.7% | Global, led by tech hubs | Short term (≤ 2 years) | |||
5G private networks for tele-operations
5G private networks for tele-operations
| +2.9% | North America, Europe, select APAC markets | Medium term (2-4 years) | |||
RaaS models lowering capex barriers
RaaS models lowering capex barriers
| +4.1% | Global, strongest in developed economies | Short term (≤ 2 years) | |||
Mandatory healthcare and hospitality disinfection
Mandatory healthcare and hospitality disinfection
| +2.6% | Global, developed healthcare systems | Short term (≤ 2 years) | |||
| Source: Mordor Intelligence | ||||||
E-commerce fulfilment automation boom
Surging online orders overextended traditional warehouses, leading operators to scale robotic fleets. Amazon deployed more than 750,000 robots that processed 4,200 orders per hour at 99.9% pick accuracy, while Cainiao quadrupled output after integrating Quicktron AMRs. AI vision paired with robotic arms reduced reliance on uniform packaging, letting facilities handle mixed items without downtime. Retailers observed 98-99% robot uptime during peak events, surpassing human performance and cementing automation as a core fulfilment strategy.
AI-enabled multi-sensor fusion cuts navigation errors
Multi-sensor fusion combined LiDAR, cameras, and IMUs through extended Kalman filters, shrinking navigation errors by 85% versus single-sensor robots. The advance allowed service robots to coexist safely with humans in hospitals and hotels. POSTECH trials proved that dual-mode disinfection robots could autonomously navigate crowded wards while performing wiping and UV-C sterilization, ensuring consistent sanitation despite staff shortages.
RaaS business models lower capex barriers
Robotics-as-a-service turned one-time hardware purchases into pay-per-use subscriptions, trimming payback periods to 1.5-3 years. Locus Robotics’ program lets customers add or remove capacity seasonally while accessing software upgrades with no hidden fees. Medium-payload robots operated at USD 0.75 per hour against USD 15-20 for human labour, yielding up to USD 1.5 million cumulative cash flow over a 15-year life from a USD 250,000 outlay.
5G private networks unlock low-latency tele-operations
Private 5G infrastructure delivered sub-40 ms round-trip latency, enabling precise remote control of heavy machinery and AMR swarms. Verizon and NVIDIA demonstrated real-time AI inference on edge servers that guided autonomous robots inside factories. Sarcos integrated 5G into its Guardian XT, allowing technicians to manipulate tools from safe distances during aerospace assembly tasks.
Restraints Impact Analysis
| Restraint | (~) % Impact on CAGR Forecast | Geographic Relevance | Impact Timeline | |||
|---|---|---|---|---|---|---|
High upfront cost and integration complexity
High upfront cost and integration complexity
| -3.4% | Global, strongest in emerging markets | Medium term (2-4 years) |
(~) % Impact on CAGR Forecast
:
-3.4%
|
Geographic Relevance
:
Global, strongest in emerging markets
|
Impact Timeline
:
Medium term (2-4 years)
|
Limited safety and liability standards
Limited safety and liability standards
| -2.1% | Global, fragmented landscape | Long term (≥ 4 years) | |||
Scarcity of application-specific datasets
Scarcity of application-specific datasets
| -1.8% | Global, niche domains | Short term (≤ 2 years) | |||
Cyber-physical risk of swarm attacks on AMRs
Cyber-physical risk of swarm attacks on AMRs
| -1.2% | Developed, high-connectivity markets | Medium term (2-4 years) | |||
| Source: Mordor Intelligence | ||||||
High upfront cost and integration complexity
Although unit prices dropped toward USD 10,856, full deployments often tripled that figure after software, facility redesign, and training costs were included. Brownfield sites required conveyor rerouting and legacy IT upgrades, stretching timelines and budgets for small enterprises. Standardized modular platforms and cloud fleet managers began easing integration pain, yet budget constraints in emerging markets still slowed new installations.
Cyber-physical risk of swarm attacks on AMRs
The SESAME project revealed GPS spoofing, signal jamming, and network intrusion threats that could seize fleets of ROS-based robots simultaneously.[2]Dimitrios Papoutsakis, “SESAME: Automated Security Assessment of Robots and Modern Multi-Robot Systems,” Electronics, clok.uclan.ac.uk A coordinated warehouse attack could halt fulfilment across multiple sites, while compromised hospital robots might endanger patients. Companies responded by deploying encrypted links, network segmentation, and real-time anomaly detection, but rising fleet sizes left security teams in a continuing race against attackers.
By Robot Type: Logistics Dominance Meets Hospitality Innovation
Logistics systems held 41.02% of 2025 revenue, securing the largest professional service robots market share as e-commerce giants scaled automated fulfilment. Public relations and hospitality robots delivered a 33.45% CAGR, reflecting post-pandemic demand for contactless guest engagement in restaurants and hotels. Medical robots advanced steadily in surgical precision gains, whereas construction and demolition units, such as Brokk’s battery-powered solutions, grew as safety rules tightened around hazardous work sites.
Pudu Robotics’ BellaBot Pro illustrated cross-segment convergence by blending service and entertainment functions through personalized greetings and gesture recognition. Inspection and maintenance robots secured major energy contracts—Gecko Robotics won a USD 100 million deal with NAES—to scale predictive maintenance on power infrastructure. Defense, underwater, and exoskeleton niches retained specialist growth trajectories where ruggedization and operator safety mattered more than cost metrics.
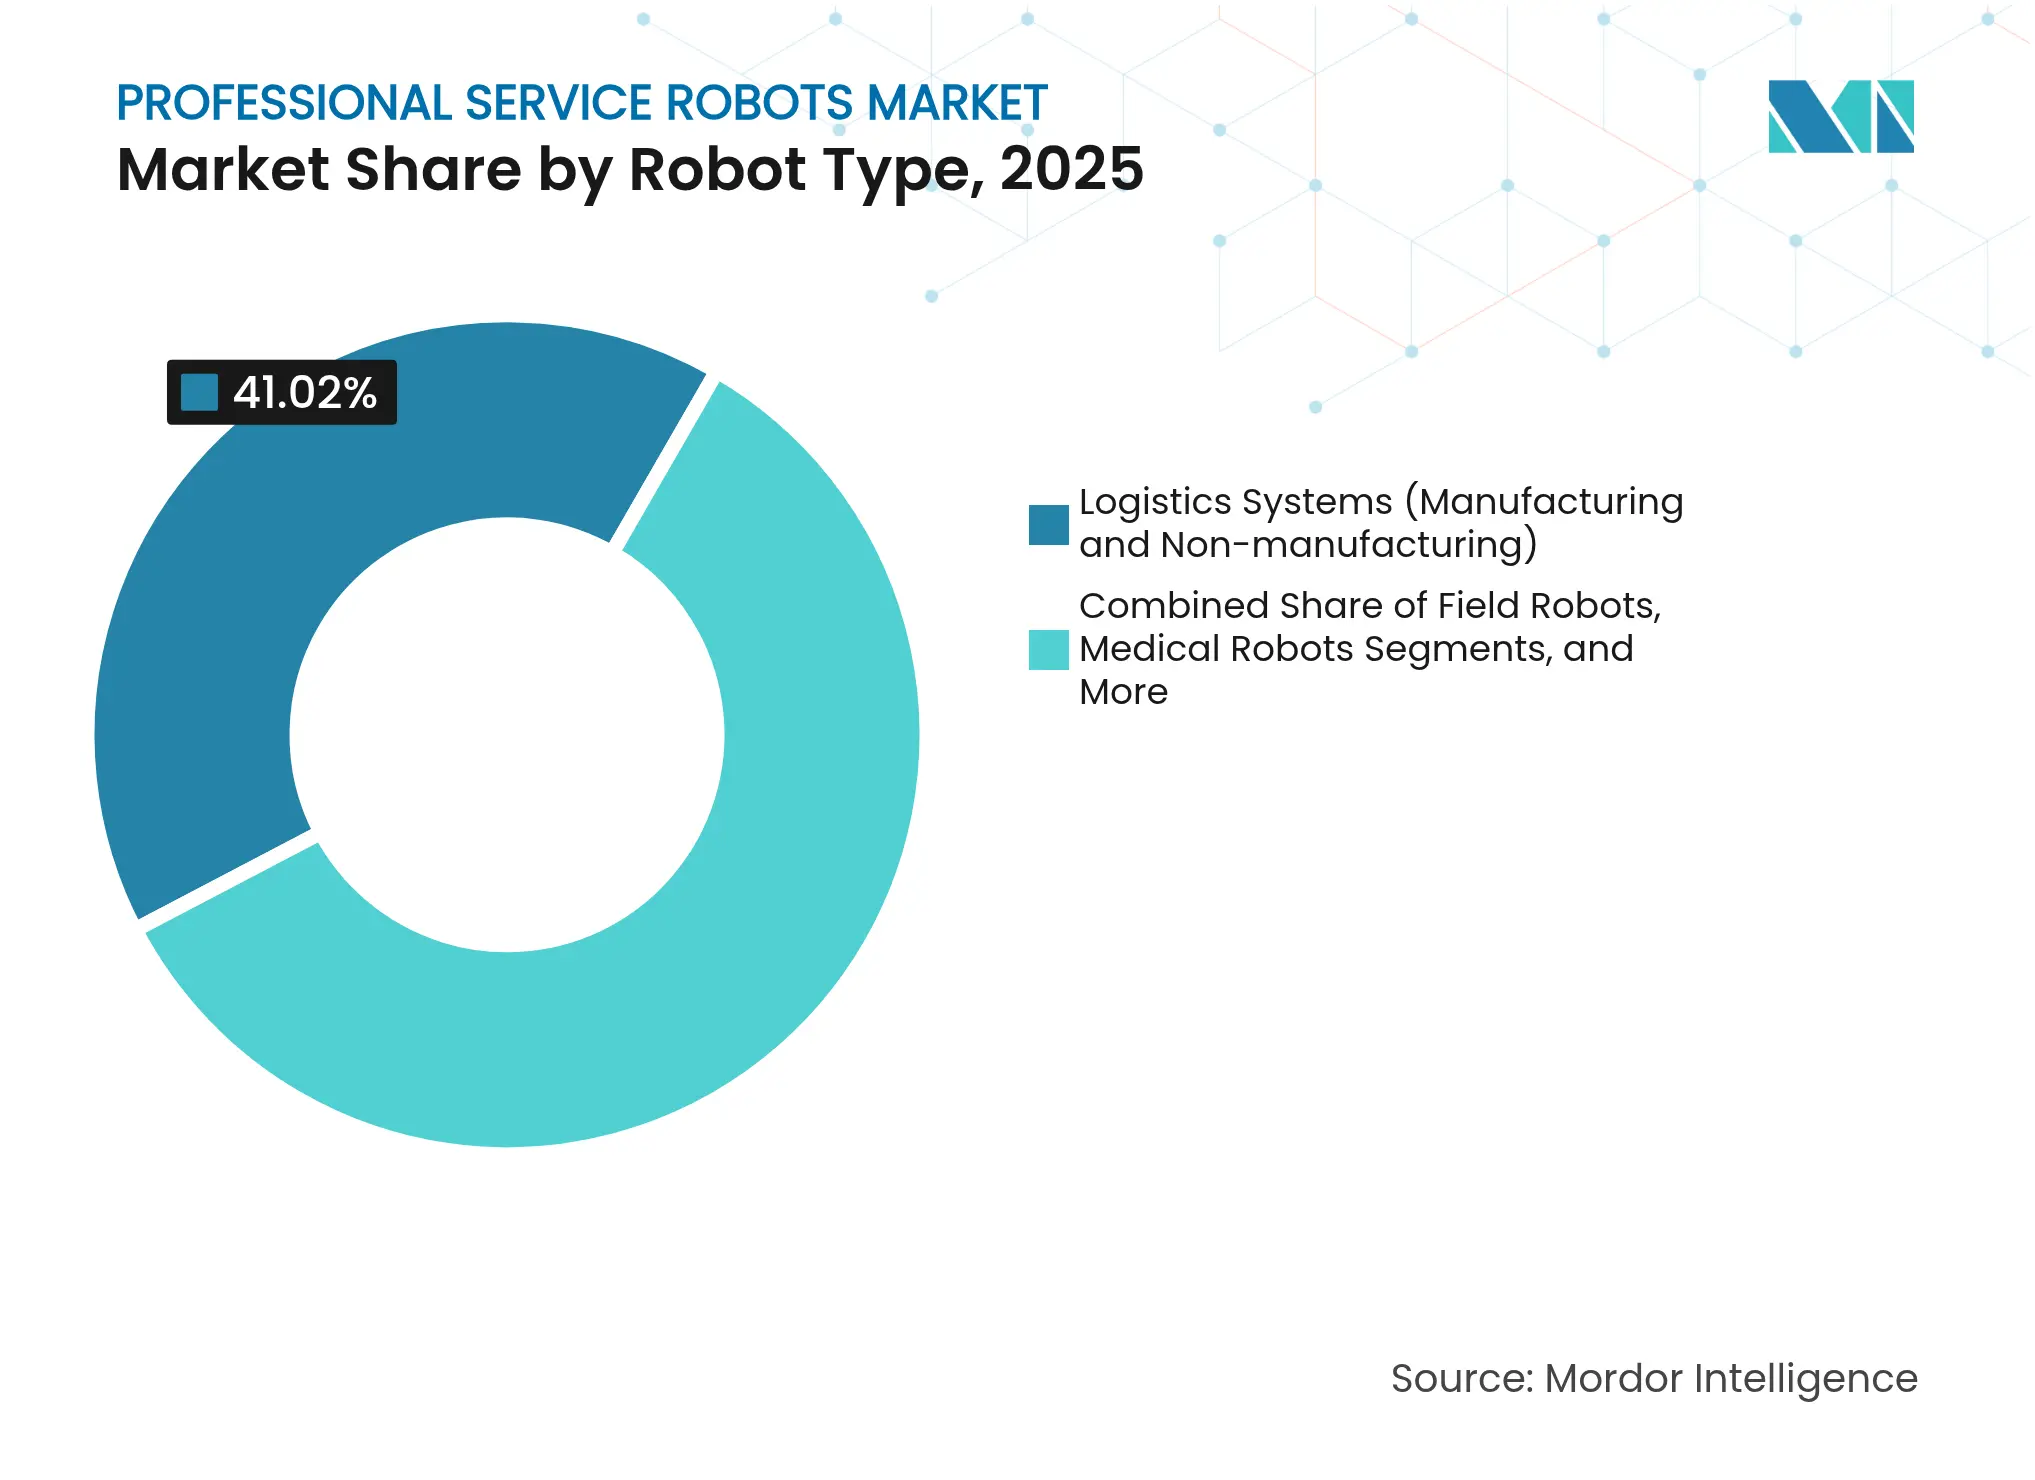
Note: Segment shares of all individual segments available upon report purchase
By Mobility: AMR Leadership Challenged by Tethered Innovation
AMRs accounted for 67.95% of 2025 revenue, anchoring the professional service robots market. Robust SLAM algorithms let them adapt to changing floor plans in warehouses, hospitals, and airports without fixed infrastructure. Stationary systems maintained stable demand in high-precision tasks, notably surgical robotics. Tethered and tele-operated robots posted the fastest growth at 29.45% CAGR as private 5G networks ensured low-latency control in hazardous settings.
Sarcos demonstrated 5G-enabled tele-operation where aerospace technicians manipulated heavy tools from safe control rooms. The OROS framework showed that edge compute and network slicing extended battery life for outdoor robots, aligning mobility choices to application risk and energy budgets.
By Application: Transportation Leadership Yields to Hospitality Growth
Transportation and logistics retained 37.88% of 2025 spending, underpinned by proven AMR ROI in fulfillment centres. Healthcare applications advanced on surgical robot uptake and hospital logistics automation. Agriculture adopted field robots for precision weeding using YOLOv8 models that achieved 93.8% detection accuracy.
Hospitality and retail robots expanded at a 34.25% CAGR as eateries faced staffing gaps. Rental fees of USD 750-1,500 per month or purchase costs below USD 20,000 made waiter robots financially viable. Richtech Robotics’ franchise agreement with Ghost Kitchens America to run robotic restaurants inside Walmart illustrates scalability beyond traditional dining spaces.
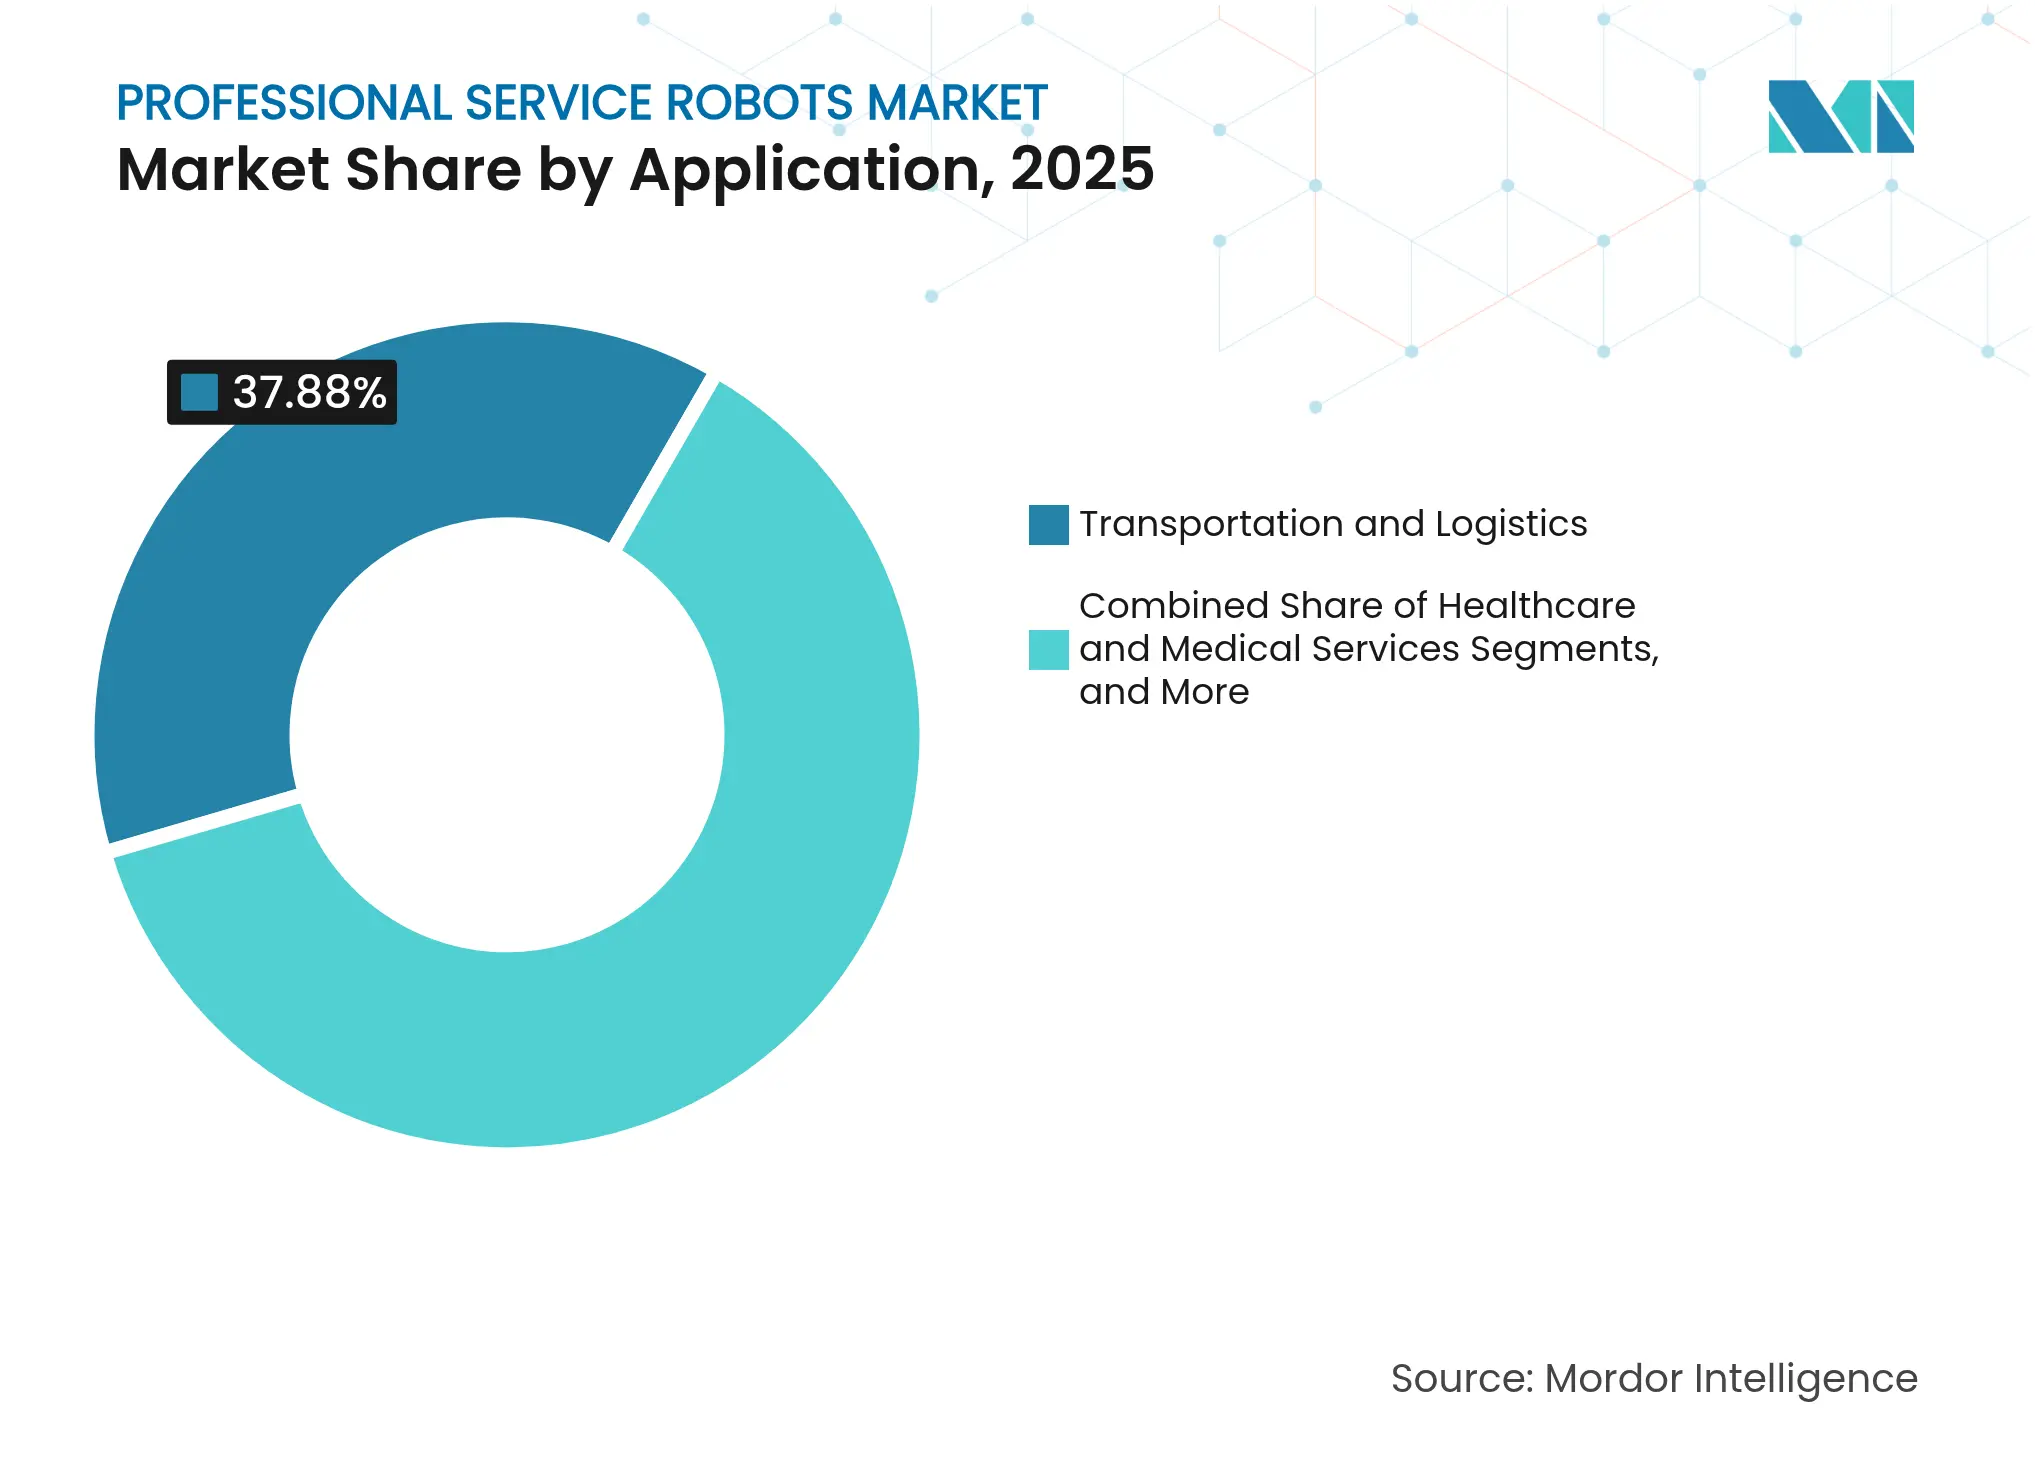
Note: Segment shares of all individual segments available upon report purchase
By End-user Industry: Warehousing Foundation Supports Hotel Innovation
Warehousing and 3PL firms captured 33.94% revenue in 2025, using AMRs to raise picking productivity 4X and cut labour costs up to 60%. Hospitals adopted robots for medication delivery and disinfection, while agriculture deployed autonomous sprayers and harvesters to counter rural labour shortages. Energy utilities embraced climbing inspection robots to limit downtime at critical assets.
Hotels and food-service venues posted a 32.4% CAGR as cleaning robots ran continuously to meet stricter hygiene rules and cut operating costs. Construction and mining operators introduced tele-operated units for demolition and drilling jobs too dangerous for people. Government and defense agencies maintained spending on unmanned ground and underwater vehicles for surveillance and logistics.
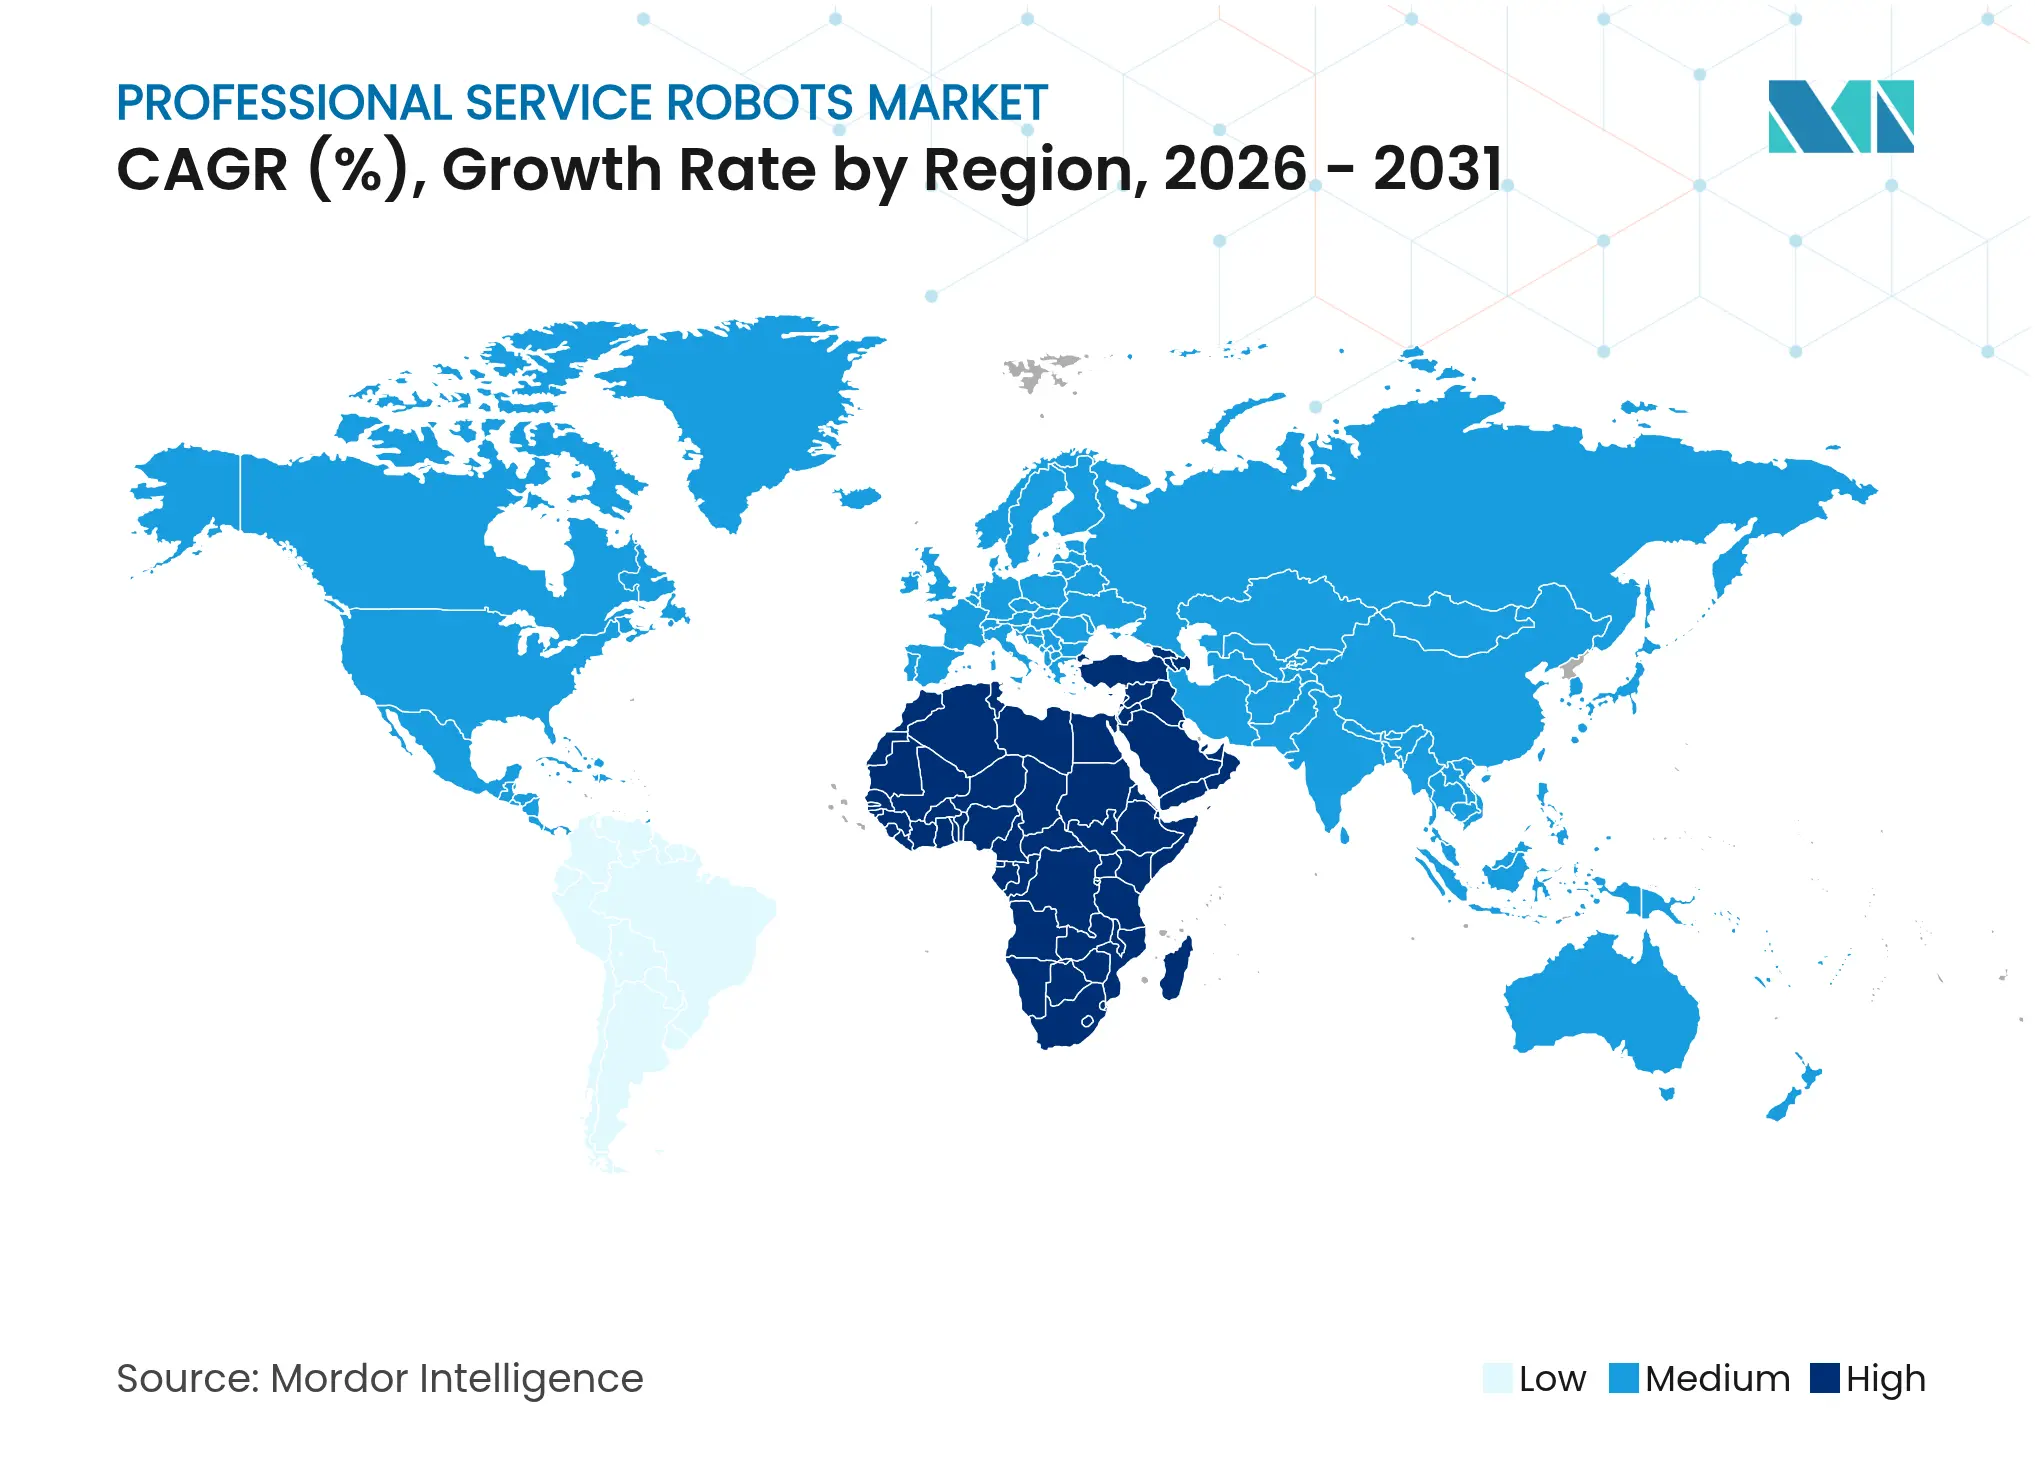
Asia-Pacific led the professional service robots market with 78.65% revenue in 2025. China installed 276,288 industrial robots in 2023—51% of global volume—and set national targets to mass-produce humanoid units by 2025. Japan’s service-robot sector tripled to 400 billion yen over five years, and its logistics segment alone grew 13.1% in 2024 to reach 404.3 billion yen (USD 2.77 billion). South Korea sustained the world’s highest robot density, while India’s installations jumped 59% on automotive expansion.
The Middle East and Africa recorded a 27.55% CAGR from 2026-2031. Saudi Arabia committed USD 14.9 billion to AI-driven infrastructure, including a USD 1.5 billion data center and a USD 2 billion advanced manufacturing hub. The UAE earmarked USD 24.7 billion for generative AI and robotics, while AFI Robotics scaled local talent programs to accelerate industrial adoption.
Europe and North America maintained steady, mid-teens growth. The EU AI Act formalized safety and transparency rules, raising compliance costs for small firms but offering regulatory certainty for premium applications. North American enterprises lifted automation budgets to 25-30% of total capital expenditure, focusing on surgical robotics and energy infrastructure inspection.
Market Concentration
The professional service robots market showed moderate fragmentation. Legacy automation leaders—ABB, Boston Dynamics, and Intuitive Surgical—leveraged deep patent portfolios and global service networks, yet nimble software-first entrants captured share with cloud-native deployments. LG’s 51% acquisition of Bear Robotics combined manufacturing scale with AI software acumen to accelerate hospitality and logistics penetration.
Generative AI patent families climbed from 733 in 2014 to more than 14,000 in 2023, led by Tencent, Ping An, and Baidu.[4]World Intellectual Property Organization, “Patent Landscape Report: Generative Artificial Intelligence,” WIPO, wipo.int This surge shifted competitive advantage toward perception and decision-making software rather than mechanical design. Gecko Robotics secured a USD 100 million NAES contract to deploy wall-climbing inspectors across power plants, illustrating niche opportunities where hardware specialization and predictive analytics intersect.
Start-ups explored white-space such as construction exoskeletons and underwater inspection drones. Venture funds like Chang Robotics’ USD 50 million vehicle supported early-stage firms, bridging the gap between research and commercialization. Success increasingly hinged on proving ROI under stringent safety rules, especially in healthcare and hospitality, where liability and service continuity dominated buyer criteria.

*Disclaimer: Major Players sorted in no particular order
1. INTRODUCTION
2. RESEARCH METHODOLOGY
3. EXECUTIVE SUMMARY
4. MARKET LANDSCAPE
5. MARKET SIZE AND GROWTH FORECASTS (VALUE)
6. COMPETITIVE LANDSCAPE
7. MARKET OPPORTUNITIES AND FUTURE OUTLOOK
Market Definitions and Key Coverage
Our study defines the professional service robots market as all autonomous or semi-autonomous machines sold for non-industrial tasks, logistics, healthcare, defense, construction, inspection, hospitality, and similar applications, where the robot performs the primary service while humans supervise or benefit from the output. Systems may be mobile or stationary and always integrate a drive train, sensor suite, control unit, and application-specific tooling.
Scope exclusion: Toys, consumer vacuum robots, and purely software process automation tools are not counted.
Segmentation Overview
Detailed Research Methodology and Data Validation
Primary Research
Our analysts hold structured calls and pulse surveys with warehouse automation managers, perioperative robot program leads, field robot integrators, and component suppliers across North America, Europe, and Asia Pacific. Conversations validate duty cycle assumptions, average selling prices, and fleet replacement rhythms that secondary data alone cannot capture.
Desk Research
We begin by mapping the universe of platforms through public sources such as International Federation of Robotics shipment statistics, United Nations Comtrade trade codes for HS-classified robotic systems, and OECD R&D spend trackers that flag technology adoption trends. Policy and safety insights flow from documents issued by bodies like the US FDA (medical devices) and the European Commission's Machinery Regulation, which set installation thresholds. Company 10-Ks, investor decks, and patent analytics drawn from Questel provide unit prices, portfolio depth, and pipeline signals. Dow Jones Factiva and D&B Hoovers enrich revenue splits and channel footprints. These sources illustrate the baseline; many other publications supplement the picture throughout the project.
Market-Sizing & Forecasting
A top-down model converts IFR shipment volumes and ASP ranges into global revenue pools, which are then reconciled with bottom-up samples from distributor roll-ups and hospital purchase data to refine totals. Key variables like unit ASP deflation, AMR fleet utilization hours, surgical robot procedure counts, CAPEX allocation per square foot of warehouse, and defense procurement cycles drive each yearly data point. Multivariate regression links those drivers to macro indicators such as e-commerce GMV and elective surgery volumes, before ARIMA smoothing projects the 2025-2030 trajectory. Where supplier data are sparse, we bridge gaps with scenario bands anchored to confirmed installation bases.
Data Validation & Update Cycle
Outputs pass variance checks against independent metrics, with anomalies escalated for senior review. Reports refresh every twelve months and are reopened sooner if material events, regulatory shifts, multi-billion-dollar tenders, alter the market landscape. A final analyst pass ensures clients receive the most current baseline.
Why Mordor's Professional Service Robots Baseline Stands Reliable
Benchmark comparison
Published estimates often diverge because firms select different product baskets, base years, and currency conversions. Buyers therefore need clarity on why one figure can safely guide planning while another cannot.
Key gap drivers include whether domestic robot units are mixed with professional fleets, if refurbishment revenue is bundled into sales, and how quickly ASP erosion is baked into forecasts. Our study reports the full professional cohort only, applies transaction-weighted 2024 USD exchange averages, and updates ASP curves annually; other publishers may assume flat prices for five years or exclude mobile platforms outside warehouses.
| Market Size | Anonymized source | Primary gap driver | ||
|---|---|---|---|---|
USD 51.8 B (2025) | Mordor Intelligence | - | Anonymized source:Mordor Intelligence | Primary gap driver:- |
USD 38.2 B (2024) | Global Consultancy A | Omits defense and construction robots; uses static 2021 ASPs | ||
USD 19.4 B (2025) | Industry Association B | Counts only mobile platforms; excludes service contracts | ||
USD 13.4 B (2024) | Trade Journal C | Regional scope limited to North America and Europe |
Pricing Strategy for Semiconductor Components
3 Min Read
Accelerating Additive Manufacturing Adoption in India
3 Min Read
Wealth Management Intelligence for the Middle East
4 Min Read
When decisions matter, industry leaders turn to our analysts. Let’s talk.