
Private Jet Charter Services Market Size and Share
Market Overview
| Study Period | 2020 - 2031 |
|---|---|
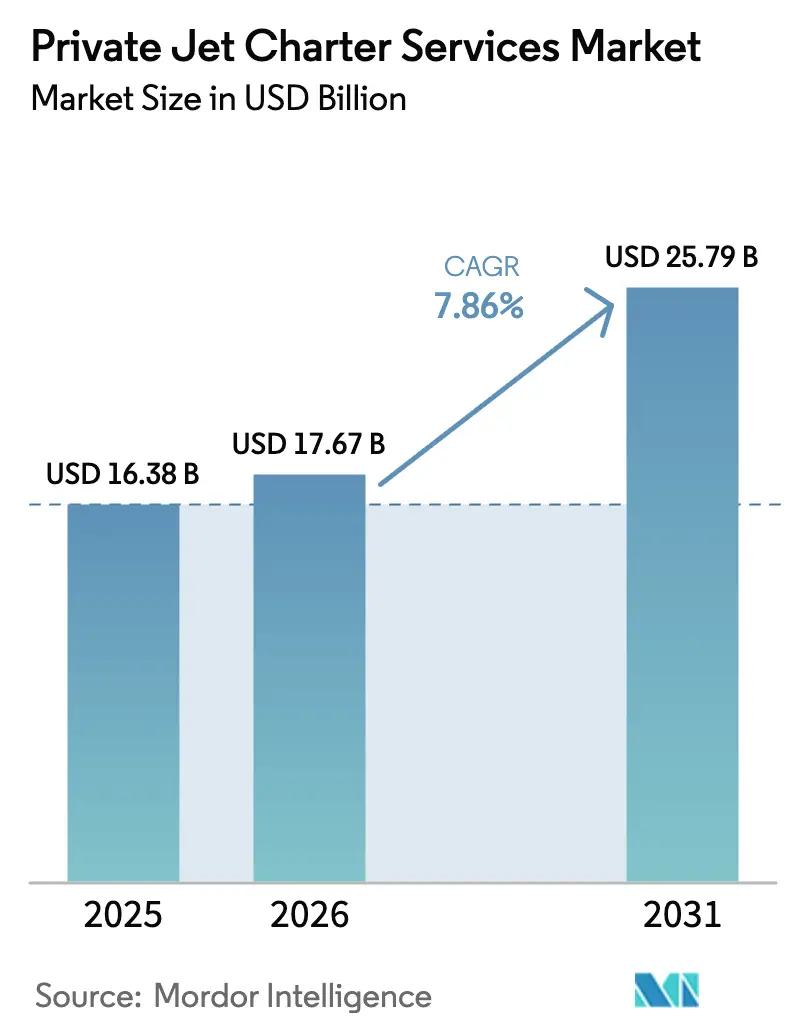
| Market Size (2026) | USD 17.67 Billion |
| Market Size (2031) | USD 25.79 Billion |
| Growth Rate (2026 - 2031) | 7.86 % |
| Fastest Growing Market | South America |
| Largest Market | North America |
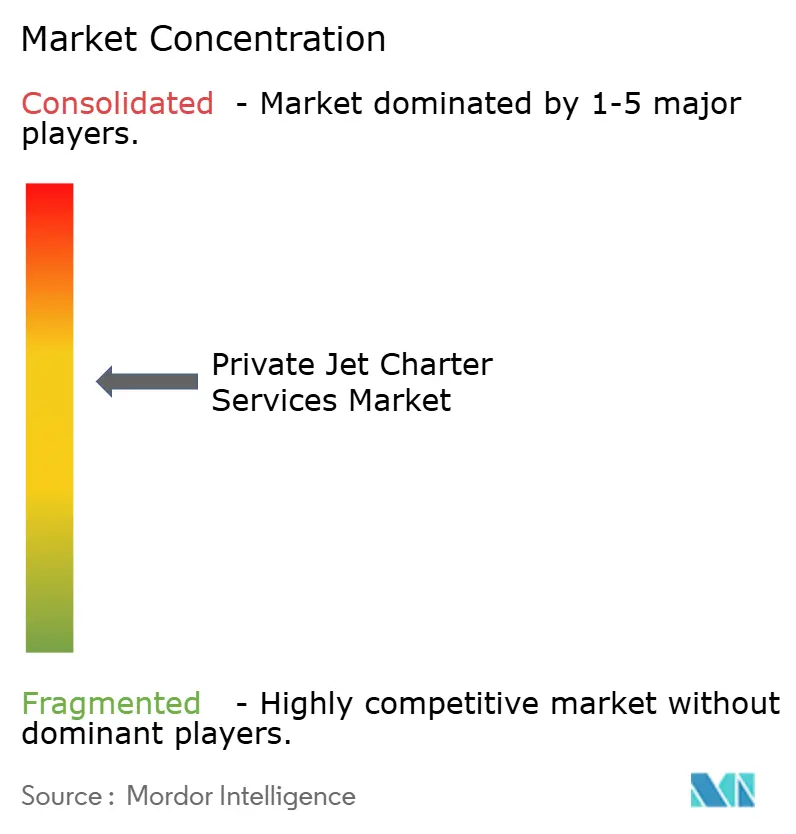
| Market Concentration | Medium |
Major Players *Disclaimer: Major Players sorted in no particular order Image © Mordor Intelligence. Reuse requires attribution under CC BY 4.0. | |
Private Jet Charter Services Market Analysis by Mordor Intelligence
The private jet charter services market size was valued at USD 16.38 billion in 2025 and estimated to grow from USD 17.67 billion in 2026 to reach USD 25.79 billion by 2031, at a CAGR of 7.86% during the forecast period (2026-2031). Growing ultra-high-net-worth wealth, accelerating corporate globalization, and technology-driven booking solutions foster sustained tailwinds for the private jet charter services market. Operators widen fleets to meet long-range requirements, while the light-aircraft category provides cost-efficient regional connectivity. North America remains the revenue stronghold on the back of mature infrastructure and concentrated wealth. Yet, South America shows the steepest trajectory as airport upgrades and economic diversification fuel regional demand. Competitive intensity rises as incumbents pursue fleet renewal, subscription pricing, and sustainable aviation fuel initiatives to protect their private jet charter services market share.
Key Report Takeaways
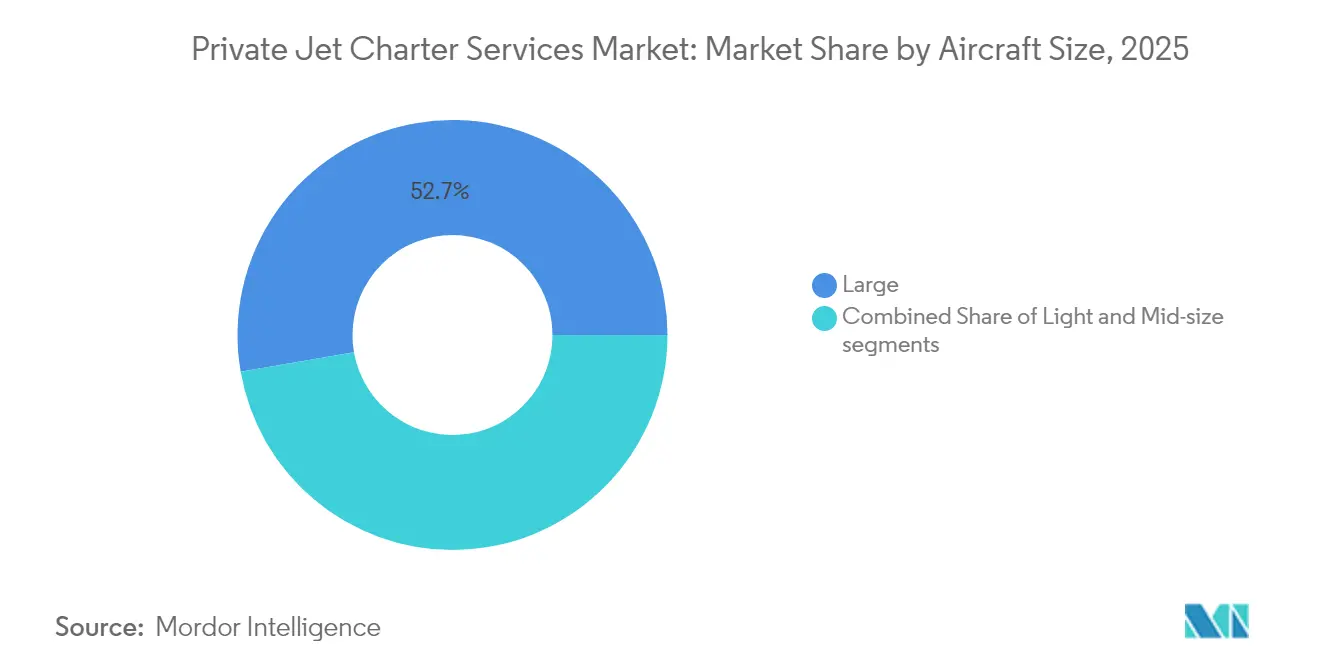
- By aircraft size, large jets led with 52.74% of the private jet charter services market share in 2025, while the light-aircraft segment is projected to expand at a 7.92% CAGR to 2031.
- By service model, on-demand charter held 51.62% revenue share of the private jet charter services market in 2025, whereas subscription-based solutions are forecasted to advance at a 9.63% CAGR through 2031.
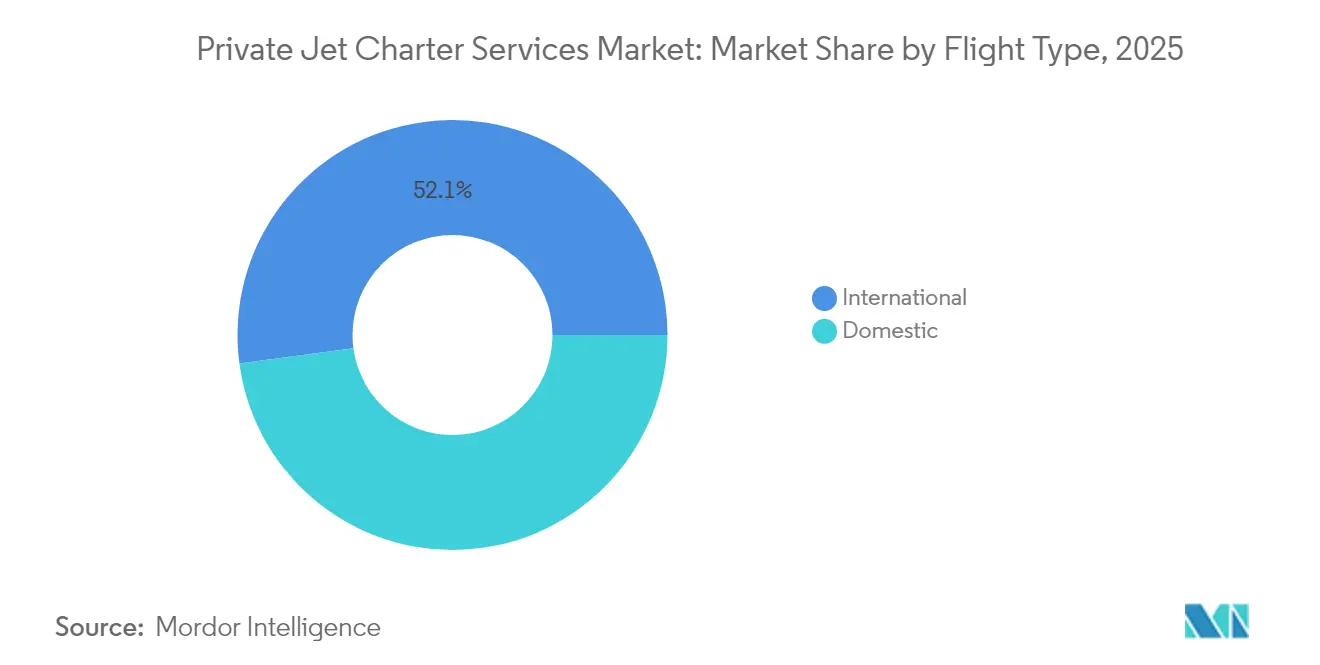
- By flight type, domestic operations accounted for 47.88% share of the private jet charter services market size in 2025, and international routes are advancing at a 9.56% CAGR through 2031.
- By end user, corporates and SMEs secured 45.02% of demand in 2025, while sports and entertainment use is set to grow at a 9.05% CAGR to 2031.
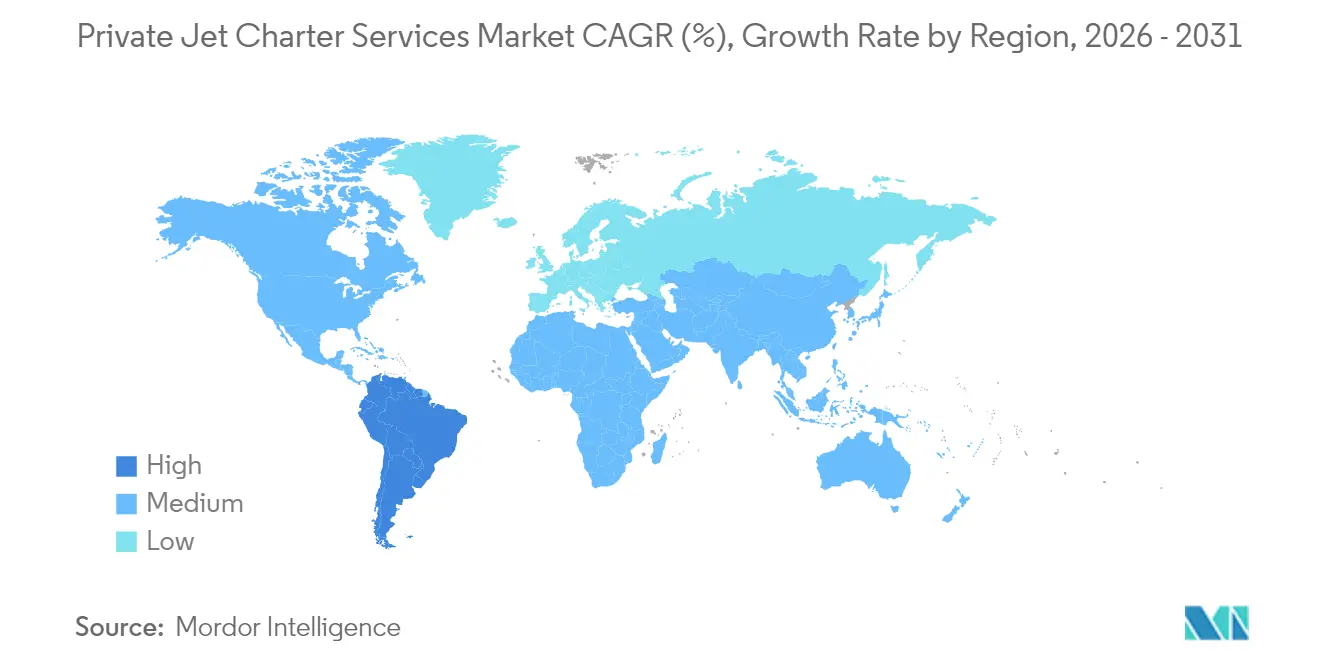
- By geography, North America captured 81.93% revenue share in 2025, yet South America is projected to record the fastest 9.78% CAGR through 2031.
Note: Market size and forecast figures in this report are generated using Mordor Intelligence’s proprietary estimation framework, updated with the latest available data and insights as of 2026.
Market Trends and Insights
Drivers Impact Analysis of Private Jet Charter Services Market*
| Driver | ( ~ )% Impact on CAGR Forecast | Geographic Relevance | Impact Timeline |
|---|---|---|---|
| Accelerating growth in global ultra-high-net-worth individuals (UHNWIs) | +2.1% | Global with focus on North America and Asia-Pacific | Long term (≥ 4 years) |
| Heightened demand for flexible, post-pandemic travel alternatives | +1.8% | Global, especially North America and Europe | Medium term (2-4 years) |
| Proliferation of jet-card, subscription, and membership models | +1.4% | North America, spreading to Europe and Asia-Pacific | Medium term (2-4 years) |
| Adoption of AI-enabled real-time pricing and booking algorithms | +0.9% | Global, led by North America and Europe | Short term (≤ 2 years) |
| Increasing client preference for sustainable aviation fuel (SAF)-compatible charters | +0.7% | Europe and North America, widening globally | Long term (≥ 4 years) |
| Expansion of secondary airports and FBO infrastructure across emerging markets | +1.2% | Asia-Pacific, South America, Middle East and Africa | Long term (≥ 4 years) |
| Source: Mordor Intelligence | |||


Accelerating growth in global ultra-high-net-worth individuals (UHNWIs)
The wealthy population surpassed 625,000 people worldwide in 2025, controlling assets of USD 30 trillion and expanding 4% yearly. Rising affluence in China and India strengthens Asia’s contribution to the private jet charter services market as younger high-net-worth travelers prioritize immersive experiences over material goods. Corporate executives use point-to-point connectivity to reconcile intense schedules with lifestyle choices, turning private aviation into a productivity tool. The demographic shift toward diversified wealth centers supports fresh demand in Southeast Asia and the Middle East. Consequently, fleet strategies now balance long-range jets for transcontinental journeys with light jets aimed at domestic connectivity, helping operators capture incremental share in the private jet charter services market.
Heightened demand for flexible, post-pandemic travel alternatives
Business jet activity re mained 10% above 2019 levels through mid-2025, despite commercial aviation’s full recovery. The pandemic introduced thousands of first-time users to private flying, and retention has proven strong as travelers value minimal exposure to congested hubs and tailored itineraries. North American leisure itineraries, such as Caribbean resort hops, noticeably increased. European charter patterns blend corporate and leisure segments, often on light or mid-size aircraft that can land at secondary airports. In the Middle East, business jet traffic has more than doubled from 2019, reflecting the region’s status as a connector between Europe, Africa, and Asia. These shifts sustain utilization rates and underpin optimism among operators expanding fleets inside the private jet charter services market.
Proliferation of jet-card, subscription, and membership models
Recurring-revenue programs simplify budgeting and guarantee aircraft access for customers unwilling to commit to ownership. Jet-card pricing climbed 28% between 2020 and 2025, yet adoption continued to rise as flight activity among members gained 1% year on year in early 2025. Subscription platforms provide fixed hourly rates, no ferry fees in core zones, and transparent upgrades, addressing prior cost-uncertainty concerns. Empty-leg and per-seat offerings yield 20-75% savings for travelers with flexible dates, broadening the private jet charter services market beyond ultra-affluent core clientele. Operators view these schemes as tools to smooth demand and maximize fleet utilization during shoulder periods, reinforcing financial resilience.
Adoption of AI-enabled real-time pricing and booking algorithms
Artificial intelligence (AI) applications now power dynamic pricing, customer service, and maintenance scheduling for charter providers. Jet.AI’s conversational interface allows travelers to quote and secure flights through voice or text within seconds, cutting traditional broker back-and-forth cycles.[1]Jet.AI, “Ava Conversational Booking Platform Launch,” globalair.com Vista Global uses predictive analytics to allocate aircraft across time zones, lifting fleet availability while reducing repositioning costs. Fixed Base Operators deploy machine-learning models to tailor concierge services, anticipate peak flows, and optimize fuel purchasing. Facial recognition and biometric boarding accelerate terminal processing, strengthening the convenience advantage over commercial rivals. These advancements enhance transparency, compress operating costs, and enrich client experience, reinforcing loyalty in the private jet charter services market.
Restraints Impact Analysis of Private Jet Charter Services Market*
| Restraint | ( ~ )% Impact on CAGR Forecast | Geographic Relevance | Impact Timeline |
|---|---|---|---|
| Escalating operating expenses and charter pricing pressures | -1.9% | Global with peak impact in Europe and North America | Short term (≤ 2 years) |
| Stricter environmental compliance mandates and expanding carbon levies | -1.2% | Europe spreading to North America and Asia-Pacific | Medium term (2-4 years) |
| Growing shortage of qualified business-aviation flight crews | -1.5% | Global, most severe in North America and Europe | Medium term (2-4 years) |
| Upward spiral in aviation-insurance premiums following safety incidents | -0.8% | Global, concentrated in mature markets | Short term (≤ 2 years) |
| Source: Mordor Intelligence | |||
Escalating operating expenses and charter pricing pressures
Insurance, crew, and maintenance outlays continue to rise, squeezing margins for operators with smaller balanced sheets. Annual hull and liability premiums range from USD 10,000 to USD 500,000, depending on aircraft value and pilot experience, and weather-related claims drive further pricing volatility. Supply chain disruptions extend aircraft downtime, increasing charter-substitution costs. Jet fuel prices remain sensitive to geopolitical events, limiting operators’ ability to lock long-term rates. To remain competitive, market leaders negotiate volume discounts and retrofit older aircraft with predictive-maintenance systems that reduce unscheduled repairs, yet elevated cost structures still restrain near-term pricing flexibility in the private jet charter services market.
Stricter environmental compliance mandates and expanding carbon levies
The EU Emissions Trading System, CORSIA requirements, and France’s new private-jet passenger tax increase operating costs for European routes. California’s climate-risk disclosure laws affect US-based operators that report Scope 3 emissions for corporate clients. Sustainable aviation fuel availability is improving but still carries a 1.5-to-2.5-fold premium over conventional Jet-A, imposing a green markup on charter rates.[2]4AIR, “SAF Market Update 2025,” 4air.aero Operators face capital commitments for carbon offset programs and reporting platforms. These added expenses heighten ticket prices and could divert price-sensitive travelers toward first-class commercial cabins, moderating growth in the private jet charter services market.
*Our forecasts treat driver/restraint impacts as directional, not additive. The impact forecasts reflect baseline growth, mix effects, and variable interactions.
Private Jet Charter Services Market Segment Analysis
By Aircraft Size:
Large-jet leadership coexists with light-jet momentumLarge jets contributed 52.74% of the private jet charter services market revenue in 2025, favored for intercontinental range and spacious cabins that match corporate protocols. Fleet data confirms that heavy-cabin models capture roughly two-thirds of capital expenditure in new deliveries, as owners seek speed, comfort, and nonstop reach from New York to Tokyo. The private jet charter services market size for light-jets, however, is projected to grow at a 7.92% CAGR between 2026 and 2031 as cost-efficient airframes like the Phenom 300 and Citation CJ3 Gen2 open private aviation to regional executives and medical-evacuation providers.
Fleet modernization programs underscore a shift toward performance and sustainability. Honeywell forecasts 8,500 new business jet deliveries worth USD 280 billion by 2035, with North America absorbing 66% of shipments. Operators such as Wheels Up trimmed fleet complexity by retiring older turboprops and standardizing on two jet families to lower maintenance expenses and simplify crew scheduling. Light-jet models entering service in 2025 arrive SAF-ready, aligning with environmental mandates and encouraging adoption among first-time charter clients. This dual demand curve reinforces balanced growth across size categories within the private jet charter services market.


By Service Model:
On-demand charter dominance meets subscription disruptionOn-demand trips generated 51.62% of the private jet charter services market revenue 2025, reflecting reliance on flexible arrangements for last-minute executive travel and special events. Corporate flight departments use aircraft interchangeably without long-term contractual lock-in, minimizing balance-sheet exposure. Though still emerging, subscription models are expected to record a 9.63% CAGR through 2031 as clients value guaranteed availability, price certainty, and loyalty credits.
Jet cards position themselves between ad-hoc and fractional programs, offering deposits that roll over and transparent hourly rates. Empty-leg marketplaces commoditize otherwise idle repositioning flights, slicing hourly costs, and feeding new traffic. Shared-seat operators target leisure groups willing to pay above commercial fares for lounge privacy and flexible departure windows. As pricing algorithms mature, operators refine segmentation to capture demand pockets, fortifying recurring-revenue pipelines and diversifying the private jet charter services market size streams.
By Flight Type:
Domestic routes anchor revenue while international demand acceleratesDomestic operations held 47.88% of the private jet charter services market share in 2025 as executives leveraged secondary airports to bypass congested hubs. Cross-country trips between New York and Silicon Valley remain a mainstay in the US, while short-haul hops under two hours dominate European itineraries. The private jet charter services market size for international missions is projected to expand at a 9.56% CAGR to 2031 as emerging-market investments, leisure tourism, and globalized sports calendars lift cross-border travel.
Short-haul international growth clusters around routes such as London–Paris or Miami–Nassau, where schedule frequency and premium convenience justify premiums. Long-haul segments rely on ultra-long-range cabins like the Gulfstream G700, recently added by Qatar Executive to serve nonstop Asia–Europe links. AI-driven flight-planning systems optimize routing for fuel efficiency and dynamic weather avoidance, bolstering on-time performance. Enhanced network reach supports incremental traffic inflows into the private jet charter services market.
By End User:
Corporate travel leadership confronted by entertainment-driven growthCorporations and SMEs accounted for 45.02% of charter demand in 2025, embracing private aviation to compress multi-city schedules, protect intellectual property, and enhance senior-team productivity. SEC climate disclosures encourage equipment upgrades toward newer, lower-emission aircraft, indirectly stimulating replacement cycles. The sports and entertainment category is forecast to grow 9.05% annually to 2031, and it benefits from athletes' and celebrities' reliance on privacy, security, and strict timelines for global tournaments or film shoots.
HNWI vacation travel enlarges charter pipelines to resort destinations across the Maldives, Capri, and Aspen. Government agencies and NGOs contract charter firms for diplomatic shuttles and disaster-relief logistics. Entertainment charters often involve one-way staging, heightening operational complexity yet commanding premium yields. The confluence of diverse end-user needs aids revenue stability across economic cycles within the private jet charter services market.
Geography Analysis
North America Private Jet Charter Services Market
North America retained 81.93% revenue dominance in 2025 due to a 5,000-plus fleet, dense FBO networks, and favorable depreciation allowances. The United States houses the most concentrated UHNWI base globally, translating into consistent domestic and trans-Atlantic flight demand. Canada and Mexico contribute incremental volumes through resource-sector travel and tourism flows. Route liberalization under the USMCA supports seamless cross-border scheduling, cementing regional leadership in the private jet charter services market.
Europe Private Jet Charter Services Market
Europe stays resilient despite intensifying carbon levies and SAF mandates. The United Kingdom, France, and Germany remain the primary hubs, with London Biggin Hill and Paris Le Bourget reporting utilization above pre-pandemic peaks. Operators retrofit fleets with SAF-compatible engines to safeguard slot access under ReFuelEU thresholds. This allows them to preserve their share in the private jet charter services market size even as compliance costs rise. Eastern Europe exhibits pent-up potential as wealth accumulation spreads beyond legacy capitals.
South America Private Jet Charter Services Market
South America’s 9.78% forecasted CAGR positions the region as the fastest-expanding pocket of opportunity. Brazil spearheads infrastructure spending, modernizing secondary airports such as Campinas and Goiania, which reduces reliance on São Paulo Congonhas congestion. Argentine mining projects and Colombian tech investments fuel inter-city air-taxi requirements. Currency volatility and regulatory complexity remain obstacles, yet demand fundamentals support commitment from global operators seeking white-space growth.
APAC and MEA Private Jet Charter Services Market
Asia-Pacific presents a mixed outlook. China’s regulatory tightening cooled domestic charter activity in 2024, yet outbound leisure traffic pushes flights to Singapore, Phuket, and the Maldives. Indonesia, Vietnam, and the Philippines witness double-digit business-jet traffic expansion as manufacturing hubs integrate deeper into global value chains. Australia maintains a stable demand through resource-sector shuttle work. Middle East and Africa combine natural-resource wealth and tourism-led diversification; Saudi Arabia’s Vision 2030 funnels investment into Riyadh’s King Salman International Airport, strengthening regional linkage within the private jet charter services market.

Regulatory Landscape
Private jet charter services work within a layered safety and consumer-protection regime that varies by role (Part 135 air carrier, broker, or fractional program operator). In the United States, FAA Part 135 certification remains the core operating license for on-demand charter, while FAA broker rules under 14 CFR Part 295 govern how air charter brokers market and arrange flights without operating aircraft. A key compliance shift is the FAA requirement for Safety Management Systems (SMS) across Part 135 operators starting in 2025, which increases expectations for documentation, training, and continuous risk monitoring, particularly for smaller fleets.
In Europe, oversight by EASA and national authorities is tightening around operational risk controls, including crew fatigue. The EASA FTL 2026 amendment to Regulation (EU) 965/2012 (effective 1 January 2026) strengthens fatigue-risk safeguards and narrows pathways that previously allowed certain missions to be treated as private, increasing scheduling and crewing discipline for commercial charter. Alongside regulator mandates, buyers and corporate travel managers are increasingly referencing third-party safety audit frameworks such as ARGUS and Wyvern in procurement, adding another de facto layer of operating standards for providers competing on premium and corporate accounts.
Value Chain Analysis
The private jet charter services value chain connects aircraft and engine OEMs to aircraft financing or leasing, operations, and aftermarket support, with customer access mediated through either direct operators or brokers. Aircraft manufacturers supply the core asset, while MRO providers, parts distributors, and engine shop networks support airworthiness and dispatch reliability across the aircraft lifecycle. Fuel suppliers and fixed-base operators (FBOs) enable daily flight execution through refueling, hangarage, handling, and passenger processing, making FBO coverage and service consistency a key operational differentiator in both mature and emerging business-aviation markets.
On the demand interface, Part 135 charter operators control the aircraft, crew, maintenance programs, and regulatory compliance, while brokers handle distribution by matching customers to available lift without taking operational responsibility for airworthiness and flight execution. Digital booking and pricing tools are reducing the search-and-quote portion of the chain, but many constraints sit in the upstream aftermarket, including parts availability, engine shop-visit capacity, and skilled labor shortages that can prolong downtime. These bottlenecks increase the value of fleet simplification, OEM support relationships, and in-house or preferred-provider maintenance arrangements for charter platforms targeting higher utilization and more predictable service levels.
Competitive Landscape
The private jet charter services market shows moderate concentration. NETJETS IP, LLC, Flexjet LLC, and VistaJet Group Holding Limited leverage scale, brand equity, and global dispatch centers to anchor the top tier. NetJets accepted its 50th new airplane in 2024 and plans roughly 200 additional deliveries by 2025, focusing on midsize models to support North American point-to-point itineraries. Flexjet secured a USD 7 billion firm order for 182 Embraer jets in February 2025, underlining aggressive fleet growth financed by a USD 550 million unsecured bond completed in December 2024. Vista Global sought USD 1 billion in new capital and sold legacy Citation X and Ultra aircraft to streamline operations and concentrate on long-range segments.
Technology-driven entrants intensify rivalry. Jet.AI’s AI-enabled booking engine offers instant itineraries and dynamic pricing, aiming to cut broker commissions and shorten response times. Real Jet, launched by industry veteran Kenny Dichter, removes membership fees and lengthy contracts, betting on simplified hourly pricing to win share among occasional travelers. Regional operators such as Qatar Executive add flagship Gulfstream G700s to offer nonstop Doha–New York service, enriching client choice in the private jet charter services market.
Environmental differentiation becomes a core strategy. NetJets and Flexjet lead SAF-adoption programs, locking supply contracts with producers to cushion clients from exposure to volatile premiums. Operators also invest in carbon-offset portfolios and real-time emissions dashboards to satisfy corporate reporting standards. The need for capital to fund fleet upgrades and compliance spurs consolidation, with well-capitalized leaders acquiring niche rivals to secure crews, slots, and certificates.
Private Jet Charter Services Industry Leaders
NetJets IP, LLC
VistaJet Group Holding Limited
Air Charter Service Group Limited
Flexjet LLC
Wheels Up Experience Inc.
- *Disclaimer: Major Players sorted in no particular order
Private Jet Charter Services Market Companies Covered in this Report
- NETJETS IP, LLC
- Flexjet LLC
- VistaJet Group Holding Limited
- Wheels Up Experience Inc.
- flyExclusive
- XO Global LLC
- Jet Linx Aviation, LLC
- GAMA Aviation Plc
- Air Charter Service Group Limited
- PrivateFly Limited
- Sentient Jet
- Paramount Business Jets
- GlobeAir AG
- Luxaviation Group
- Jetex FZE
- RoyalJet Group
- DeerJet
- Club One Air
- Metrojet Limited
- Executive Jets Asia Pte. Ltd.
- Magellan Jets
- FXAIR
- Flapper Technologia S.A.
- Global Jet Centre
- Insijets Ltd.
- OJets Pte. Ltd.
- Jettly Inc.
- Prime Jet LLC

Market Opportunities and Future Outlook
Operators have room to differentiate beyond point-to-point transport by bundling charter services with broader UHNWI and corporate offerings, including medical concierge, security, and destination experiences that align with premium traveler expectations. Connectivity is also becoming a tangible product feature within these bundles. NetJets announced plans to bring Starlink high-speed connectivity to its fleet (December 2025), supporting the corporate productivity use case and creating a clear upsell path for subscription, jet-card, and managed-travel clients that prioritize always-on workflows.
Fleet renewal and capacity control are another actionable opportunity area, since next-generation aircraft deliveries can translate into improved dispatch, range, and cabin experience, while also supporting sustainability reporting and newer avionics standards. NetJets taking delivery of the first three Cessna Citation Ascend aircraft (May 2026) and receiving the first Bombardier Global 8000 (March 2026) shows how leading platforms are refreshing mid-size and ultra-long-range offerings, which other operators can pursue through targeted OEM slots, managed fleet programs, or partnerships. On the commercial side, consolidation and advisory capability are being used to expand customer reach and improve aircraft sourcing, as seen in Flexjet acquiring The Jet Business (June 2026), pointing to a route for charter brands to integrate brokerage, whole-aircraft sales, and membership programs into a broader lifecycle proposition.
Recent Industry Developments in Private Jet Charter Services Market
- May 2026: NetJets IP, LLC takes delivery of the first three Cessna Citation Ascend midsize business jets, fleet launch customer for the model. The move advances fleet modernization and mid-size jet expansion, enhancing the operator's ability to serve point-to-point itineraries. This strengthens NetJets' competitive position by expanding capacity and offering next generation capabilities to premium travelers.
- March 2026: NetJets IP, LLC receives the first Global 8000 aircraft from Bombardier, beginning planned 24-aircraft fleet expansion. Ultra-long-range capacity strengthens global service capabilities and premium long-range offerings. The action reinforces NetJets' leadership in large cabin travel and broadens its international reach for high net worth clients.
- February 2026: VistaJet Group Holding Limited announces major fleet agreement with Bombardier for 40 firm orders of the Challenger 3500 aircraft. Significant fleet growth and capacity expansion support VistaJet's scale and service coverage. The deal secures long-term capacity and strengthens global reach for VistaJet across key markets.


Private Jet Charter Services Market Report Scope and Research Methodology
Market Definition and Coverage
For this study, the market is defined as revenues earned from arranging and operating private air charter flights on fixed wing business aircraft, where a customer pays for access and flight time through on-demand trips or pre-purchased programs.
Scope exclusions: We exclude aircraft sales, pure aircraft leasing, airport and FBO services, and standalone maintenance training services that are not bundled into charter flight delivery.
Segments Covered in This Report
- By Aircraft Size
- Light
- Mid-size
- Large
- By Service Model
- On-Demand Charter
- Jet Card Membership
- Subscription-based Charter
- Fractional Charter Integration
- Empty-Leg/Shared Charter
- By Flight Type
- Domestic
- Short Haul
- Long Haul
- International
- Short Haul
- Long Haul
- Domestic
- By End User
- Corporates and SMEs
- HNWI/Private Individuals
- Sports and Entertainment
- Government and NGO
- By Geography
- North America
- United States
- Canada
- Mexico
- Europe
- United Kingdom
- Germany
- France
- Spain
- Rest of Europe
- Asia-Pacific
- China
- Japan
- India
- Australia
- South Korea
- Rest of Asia-Pacific
- South America
- Brazil
- Rest of South America
- Middle East and Africa
- Middle East
- United Arab Emirates
- Saudi Arabia
- Rest of Middle East
- Africa
- South Africa
- Rest of Africa
- Middle East
- North America
Data Sources, Market Sizing, and Validation
Desk Research
Desk research was used to build the base structure for the model and to sanity check the order of magnitude before assumptions were finalized. We referred to public aviation activity series and fleet context, such as FAA General Aviation and Part 135 activity survey outputs, ICAO air transport and airport statistics, and aircraft registry and utilization releases where available.
To understand demand triggers and pricing direction, we also used sources such as US DOT and BTS aviation tables, plus customs and trade releases for aviation fuel and parts as supporting signals. Association publications such as NBAA and GAMA were used for fleet and operations context. We used company filings, investor presentations, airport press releases, and reputable news and financials databases to track charter program moves, capacity adds, and route footprint changes, then used those observations to test our assumptions. In a few places, paid subscriptions for company financials and patent databases were used to fill specific gaps around operator revenue mix and technology enablement themes. The sources listed here are illustrative, and we reviewed additional public and paid references for data collection, validation, and clarification.
Primary Interviews and Surveys
Primary work focused on validating what actually drives billed charter revenue, and where published figures drift when program structures differ. We spoke with a mix of charter operators, charter brokers, fleet managers, airport-side service providers, and corporate travel decision-makers across major aviation regions so the pricing logic, utilization ranges, and the domestic versus international mix could be checked.
Interview inputs were used to confirm typical occupied flight time patterns, repositioning practices, contract lengths for jet cards or subscriptions, and the practical effect of regulation and safety requirements on supply. Where desk sources were thin, these discussions were also used to pressure test assumptions, then triangulate them back to observable activity and fleet signals.
Distribution of primary research fieldwork respondents
| Company type | Respondent position | Region |
|---|---|---|
| Top tier: 29% | CXOs: 19% | APAC: 48% |
| Mid tier: 51% | Functional/Unit leaders: 30% | EMEA: 30% |
| Smaller Players: 20% | Managers: 51% | Americas: 22% |
Market-Sizing & Forecasting
Sizing starts from a demand pool reconstruction where flight activity and fleet availability are translated into revenue potential, then adjusted for how the charter mix is actually sold and delivered. We used a top-down approach once by linking business aviation utilization signals, including Part 135 activity direction, active fleet mix by jet size, and airport access patterns, to an addressable charter share. That share was then converted to value using market-consistent pricing.
Those totals were corroborated with selective bottom-up approximations, including sampled hourly charter rates by aircraft class multiplied by realistic annual occupied hours, plus channel checks on how much volume sits in on-demand trips versus jet card and subscription programs. Key model inputs included aircraft size mix, average stage length and trip frequency, realistic load and repositioning behavior, jet card and subscription penetration, and fuel and crew cost pass-through patterns that affect pricing. For the forecast, we used scenario analysis with base, conservative, and high cases anchored to variables such as business travel intensity, HNWI leisure patterns, fleet availability, and regulatory and SAF-related cost pressure, and then aligned the scenarios to expert expectations.
Where a direct roll-up could not be completed for smaller markets, we handled gaps through proxying from nearby airports and comparable aircraft-class utilization ranges, followed by adjustments based on primary feedback on local charter maturity.
Data Validation & Update Cycle
Model outputs are checked against independent signals before finalization, including aviation activity direction, fleet and delivery trends, and reported program changes that indicate real capacity movement. We also run variance checks across regions and aircraft classes, so unusual jumps in pricing or utilization are flagged, reviewed, and corrected when the supporting evidence is weak.
A multi-step internal review is followed, where assumptions are revisited, units are reconciled, and the logic trail is re-tested so it can be repeated by another analyst. If material differences show up during review, experts are re-contacted and the impacted parts of the model are rebuilt. Reports are refreshed annually, with interim updates when major events materially change demand, supply, or pricing, and a final pre-delivery scan is completed to reflect the latest validated view.
Mordor Intelligence's Private Jet Charter Services Market Size Compared With Other Published Estimates
Published market sizes for private jet charter services can look far apart because authors do not always count the same revenue streams, and they also treat flight programs and intermediated sales differently. Differences in base year choice, currency conversion timing, and whether pricing is modeled as hourly, per-trip, or blended program revenue also push estimates up or down.
The table below highlights how scope decisions and assumption updates can create spreads, especially around what is treated as charter revenue versus adjacent business aviation services. The biggest gaps usually come from whether jet card and subscription revenues are counted only when flight services are delivered, how repositioning and occupied hours are translated into billed revenue, and how quickly pricing is refreshed when fuel and crew costs move.
Benchmark comparison
| Source | Market Size | Gaps in Research Methodology |
|---|---|---|
| Mordor Intelligence | USD 17.67 B (2026) | |
| Industry Research Brief A | USD 21.24 B (2024) | Uses an earlier base year and often applies faster near-term growth, and it can also blend broader business aviation services into charter value, which lifts totals versus a charter-only revenue view. |
| Sector Outlook Note B | USD 23.20 B (2024) | May treat jet charter as a wider umbrella that includes non-flight service revenue and uses a different pricing per flight hour assumption, which changes the implied revenue per aircraft and inflates the market size. |
The table shows that some published numbers sit higher mainly when adjacent services and looser program accounting are included. In Mordor Intelligence's model, jet card and subscription programs are counted as charter only when they translate into delivered flight revenue within the defined charter scope. With clear activity signals, transparent price and utilization inputs, and repeatable checks against independent aviation indicators, the final estimate stays practical for planning and easy to reconcile during client reviews.


Key Questions Answered in the Report
What is the current size of the private jet charter services market?
The private jet charter services market stands at USD 17.67 billion in 2026 and is projected to reach USD 25.79 billion by 2031, growing at a 7.86% CAGR.
Which region leads the private jet charter services market?
North America dominates with 81.93% revenue share in 2025 thanks to dense infrastructure and the largest UHNWI population.
Which aircraft category grows fastest within the private jet charter services market?
The light-aircraft segment is forecasted to expand at a 7.92% CAGR between 2026 and 2031 as it offers cost-efficient regional connectivity.
How are subscription models impacting the private jet charter services industry?
Subscription and jet-card programs are expected to post a 9.63% CAGR through 2031 by offering fixed rates and guaranteed availability, providing an alternative to ad-hoc charter.
What role does sustainable aviation fuel play in private jet charters?
Regulations such as ReFuelEU require rising SAF blends, and operators like NetJets already doubled SAF use in 2024, positioning sustainability as a key differentiator.
Who are the major players in the private jet charter services market?
NETJETS IP, LLC, Flexjet LLC, and VistaJet Group Holding Limited headline the market, supported by technology-driven entrants such as Jet.AI and regional specialists like Qatar Executive.
Page last updated on:


 Your data is secure and never sold or shared.


