Pressure Transmitter And Transducer Market Size and Share
Market Overview
| Study Period | 2020 - 2031 |
|---|---|
| Market Size (2026) | USD 3.32 Billion |
| Market Size (2031) | USD 3.92 Billion |
| Growth Rate (2026 - 2031) | 3.38% CAGR |
| Fastest Growing Market | Middle East |
| Largest Market | Asia Pacific |
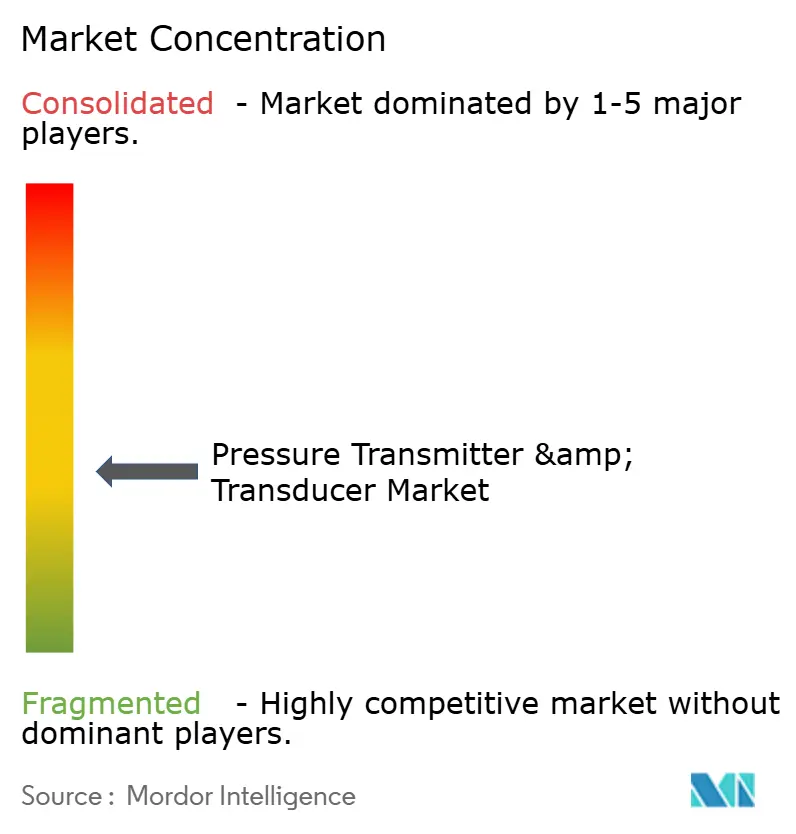
| Market Concentration | Medium |
Major Players
*Disclaimer: Major Players sorted in no particular order Image © Mordor Intelligence. Reuse requires attribution under CC BY 4.0. |
|
Pressure Transmitter And Transducer Market Analysis by Mordor Intelligence
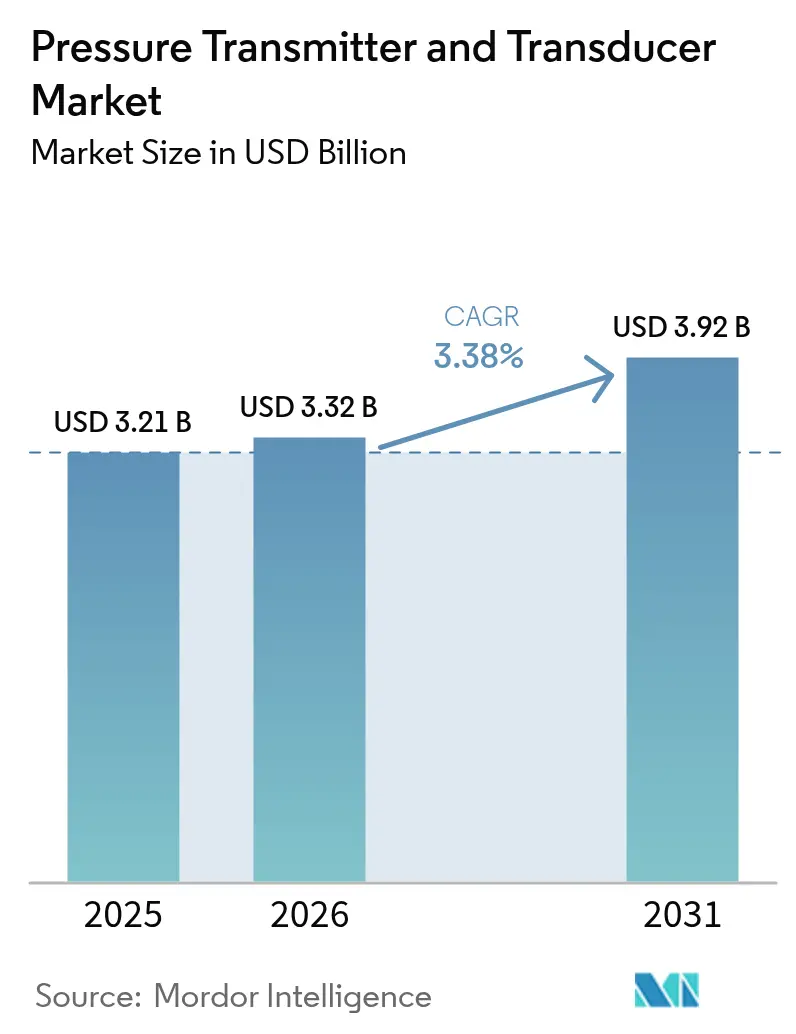
Pressure transmitter and transducer market size in 2026 is estimated at USD 3.32 billion, growing from 2025 value of USD 3.21 billion with 2031 projections showing USD 3.92 billion, growing at 3.38% CAGR over 2026-2031. Growth rests on rising demand for smart instrumentation in refineries, deeper offshore projects requiring ultra-high-pressure devices, and semiconductor fabs that need sub-1 Torr accuracy. Adoption of wireless protocols is accelerating plant digitalization, while multivariable transmitters cut installation time and total cost of ownership. Price pressure in standard 0-10 bar ranges and intermittent ASIC shortages curb momentum, yet innovations in optical and fiber-optic sensing are creating premium niches across the pressure transmitter and transducer market.
Key Report Takeaways
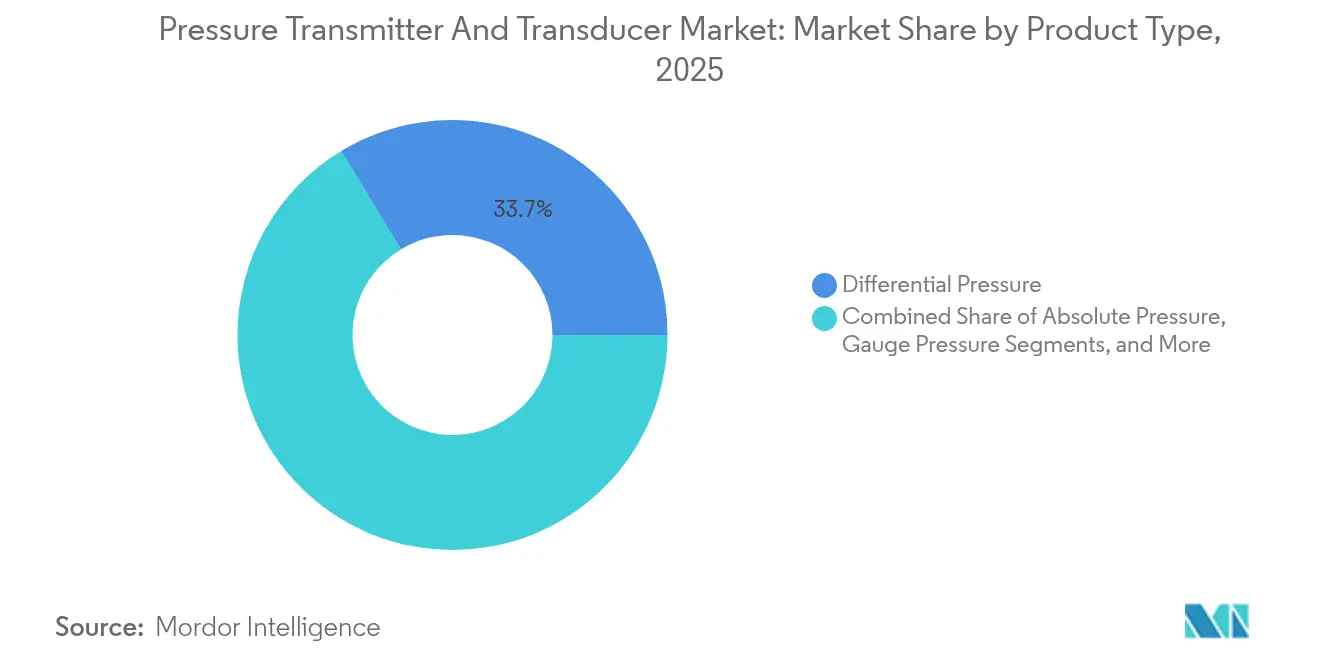
- By product type, differential transmitters led with 33.65% revenue share in 2025; multivariable units are projected to advance at a 5.55% CAGR to 2031.
- By sensing technology, piezoresistive designs held a 47.40% share in 2025, while optical solutions are poised for a 6.88% CAGR through 2031.
- By pressure range, medium (100-1,000 psi) devices captured 44.30% of the pressure transmitter & transducer market share in 2025; the ultra-high segment (>10,000 psi) is set to climb at 6.15% CAGR.
- By output/communication, analog (4-20 mA/0-10 V) remained dominant at 51.20% in 2025; wireless protocols show the quickest uptake at 7.72% CAGR.
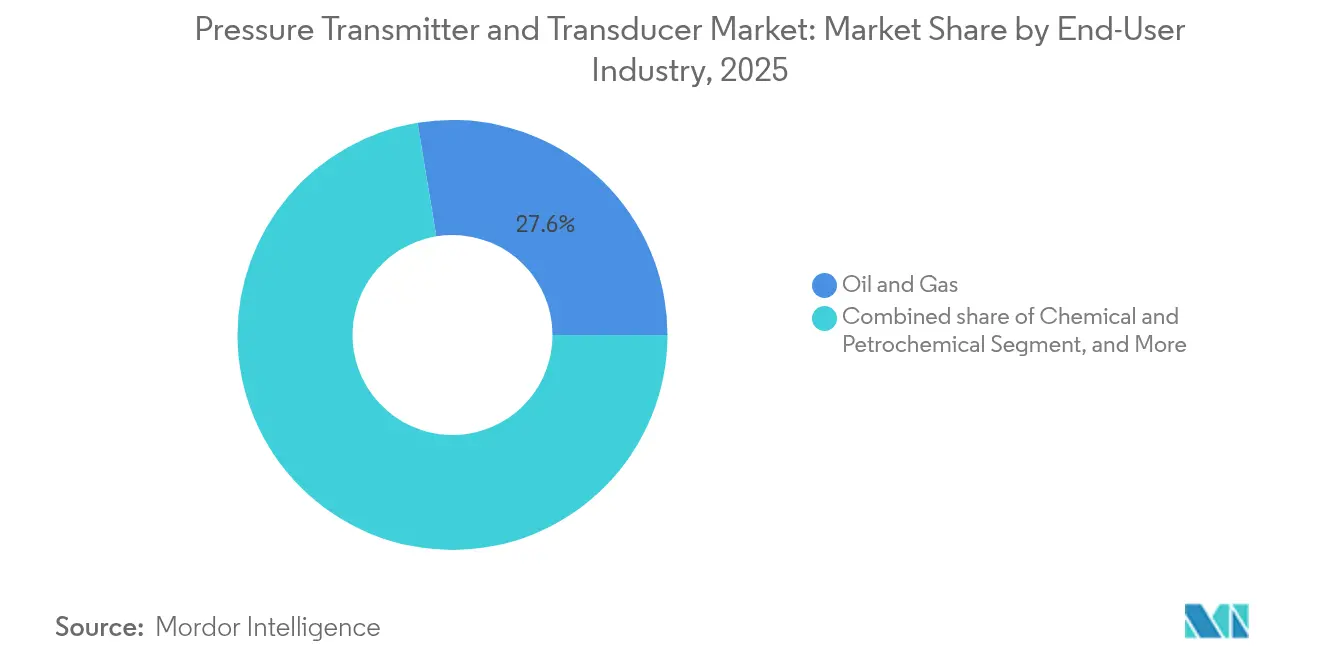
- By end-user industry, oil and gas commanded 27.60% share of the pressure transmitter & transducer market size in 2025; pharmaceuticals and biotechnology are forecast to rise at 6.24% CAGR.
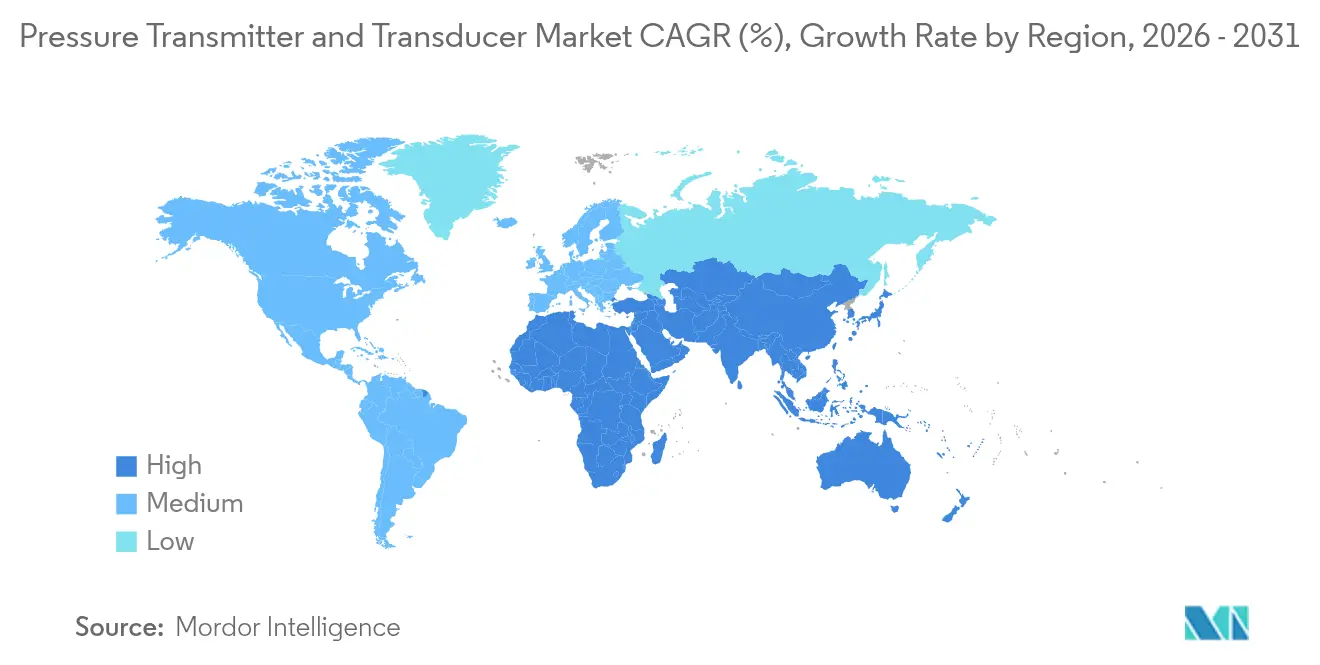
- By geography, Asia-Pacific accounted for 37.50% of the pressure transmitter & transducer market size in 2025, whereas the Middle East records the fastest 5.47% CAGR.
Note: Market size and forecast figures in this report are generated using Mordor Intelligence’s proprietary estimation framework, updated with the latest available data and insights as of 2026.
Global Pressure Transmitter And Transducer Market Trends and Insights
Drivers Impact Analysis*
| Driver | (~) % Impact on CAGR Forecast | Geographic Relevance | Impact Timeline |
|---|---|---|---|
| Hydrogen & CCUS projects need SIL-3 differential transmitters | +1.2% | Europe, North America | Medium term (2-4 years) |
| Middle-East refinery mandates for IEC 61511-compliant smart instrumentation | +0.9% | Middle East, Asia-Pacific | Short term (≤ 2 years) |
| Deep-water investments in Brazil & Guyana require >20 kpsi transducers | +0.8% | South America, global | Medium term (2-4 years) |
| APAC semiconductor fabs demand sub-1 Torr transducers | +0.6% | China, Taiwan, South Korea | Short term (≤ 2 years) |
| Source: Mordor Intelligence | |||
Upstream Hydrogen and CCUS Projects Driving SIL-3 Certified Transmitters
New hydrogen and carbon-capture facilities in Europe and North America are specifying SIL-3 differential transmitters to meet tighter risk tolerances. Devices such as the VEGAPULS 6X radar sensor provide IEC 61508 and IEC 61511 compliance plus cybersecurity certification, aligning with operators’ push for predictive diagnostics. As hydrogen electrolyzers scale, plant owners value the instruments’ built-in self-check routines that flag drift early, limiting downtime. This demand lifts premium pricing, cushioning vendors from the commoditization affecting standard ranges, and reinforces the pressure transmitter and transducer market’s pivot toward integrated safety solutions. [1]VEGA, “Safety at the Highest Level,” vega.com
Middle-East Refinery Mandates Accelerating Digital Transformation
Mandated upgrades under IEC 61511 are converting thousands of analog loops to smart transmitters across Gulf refineries. Baker Hughes’ 46,000 sqm pressure-control center opened in Abu Dhabi in 2024 to localize high-pressure assemblies and shorten lead times. Digital devices enable remote configuration and advanced diagnostics, helping operators cut maintenance trips and align with workforce-nationalization goals. These projects reinforce wireless adoption and cement the pressure transmitter & transducer market as a cornerstone of the region’s downstream modernization programs. [2]Baker Hughes, “Baker Hughes Inaugurates New Abu Dhabi Surface Pressure Control Solutions Center,” bakerhughes.com
Deep-Water Exploration Pushing Ultra-High Pressure Technology
Fields off Brazil and Guyana now deploy subsea hardware exceeding 20 kpsi. Chevron and ExxonMobil use Silicon-on-Sapphire sensors that maintain stability under corrosive brines and cyclic loading, extending service life. Supplier R&D focuses on diaphragm metallurgy and hermetic feed-throughs to guarantee zero leakage. As production shifts beyond 2,000 m water depth, ultra-high capability defines supplier qualification, reinforcing premium growth pockets within the pressure transmitter and transducer market.
Semiconductor Fabs Requiring Ultra-Clean Pressure Solutions
Cutting-edge fabs across Taiwan, South Korea, and China maintain vacuum levels below 1 Torr. Vaisala’s PDT102 offers 0.25% span accuracy using MEMS silicon sensors built for low out-gassing. The drive to 2 nm nodes raises metrology standards, insulating this segment from pricing pressure. Vendors able to certify low-particle, stainless-free assemblies are earning design wins that bolster the pressure transmitter and transducer market through 2030.
Restraints Impact Analysis*
| Restraint | (~) % Impact on CAGR Forecast | Geographic Relevance | Impact Timeline |
|---|---|---|---|
| MEMS-chip failures in high-vibration down-hole settings | −0.4% | North America, Middle East | Medium term (2-4 years) |
| Price erosion in 0-10 bar OEM transducers | −0.3% | Asia-Pacific, Europe | Short term (≤ 2 years) |
| Source: Mordor Intelligence | |||
MEMS-Chip Failures Limiting Adoption in High-Vibration Environments
Down-hole tools encounter vibration levels that fracture delicate MEMS structures, prompting operators to seek fiber-optic alternatives that tolerate heat and shock. Distributed fiber systems now monitor pressure continuously along entire wellbores. Until ruggedized MEMS variants mature, adoption remains capped, limiting part of the pressure transmitter and transducer market.
Price Erosion Squeezing Margins in Standard Pressure Ranges
Low-cost Asian firms commoditize 0-10 bar sensors, undercutting legacy suppliers by double-digit percentages. Endress+Hauser froze its US list prices through 2024 to preserve share, pairing the move with supply-chain automation. Vendors now bundle analytics platforms to defend margins, illustrating the shift to value-added differentiation across the pressure transmitter and transducer market. [3]Endress+Hauser USA, “Endress+Hauser USA Announces Price Commitment,” us.endress.com
*Our forecasts treat driver/restraint impacts as directional, not additive. The impact forecasts reflect baseline growth, mix effects, and variable interactions.
Segment Analysis
By Product Type: Multivariable Devices Gain Momentum
Differential transmitters retained a 33.65% slice of the pressure transmitter and transducer market in 2025, cementing their role in traditional flow applications. Multivariable models, by contrast, are forecast to climb at 5.55% CAGR as customers favor single-flange installations that deliver pressure, temperature, and density in one package. The Systec Controls certified Ex-zone multivariable launch underscores this tilt toward integration.
Growing digitalization is driving on-board diagnostics that flag impulse-line clogging, while firmware updates provide remote recalibration. These capabilities anchor long-term service contracts, enlarging vendor revenue streams and elevating the pressure transmitter and transducer market to a solution-centric footing. Gauge and absolute variants remain staples for general utilities and vacuum processes, but absorb slower growth.


By Sensing Technology: Optical Sensors Disrupt Traditional Paradigms
Piezoresistive chips delivered 47.40% of 2025 revenue owing to low cost and robust temperature compensation. Optical solutions, however, are expanding at a 6.88% CAGR, immune to electromagnetic interference and ideal for harsh zones. NETL’s laser-grown optical fiber probes endure extreme heat with extended linearity.
Hybrid MEMS–optical assemblies are emerging to capture both low-pressure sensitivity and high-pressure resilience. As on-board photonics prices fall, the pressure transmitter and transducer market will gradually migrate upscale, particularly in nuclear power and high-frequency RF test stands that demand EMI immunity.
By Pressure Range: Ultra-High Applications Drive Innovation
The medium band (100-1,000 psi) held a 44.30% share in 2025; nonetheless, ultra-high devices above 10,000 psi advance at a 6.15% CAGR. Glenair’s 10,000 psi SeaKing connectors with dual O-rings exemplify component hardening for subsea environs.
Advances in sapphire diaphragms and remote seal designs reduce hysteresis, widening use in supercritical CO₂ pipelines and isostatic metal forming. In lower-pressure niches, self-powered wireless sensors like PassiveLogic’s Sense Nano cut cabling and commissioning time, supporting smarter buildings. This fragmentation keeps the pressure transmitter and transducer market diversified.
By End-User Industry: Pharmaceutical Sector Emerges as Growth Engine
Oil and gas operations used 27.60% of shipments in 2025 to safeguard wells, separators, and pipelines. Cleanroom-intensive pharmaceuticals now post the fastest 6.24% CAGR as biologics scale. Positive-pressure rooms that keep sterility and negative suites containing potent compounds depend on tight differential control.
Equipment such as Siemens SITRANS P300, certified to EHEDG and 3-A, meets wash-down and explosion-proof needs simultaneously. Parallel momentum in water reclamation, food processing, and power generation sustains baseline demand, ensuring the pressure transmitter & transducer market remains broadly diversified across verticals.
By Output/Communication: Wireless Protocols Reshape Connectivity
Analog 4-20 mA lines still deliver 51.20% of shipments, valued for noise immunity and universal PLC compatibility. Yet wireless nodes, growing at 7.72% CAGR, eliminate trenching costs in sprawling sites. WirelessHART meshes reroute signals automatically and secure packets via AES-128, achieving sub-100 ms latency in dense networks.
IO-Link adoption in food plants illustrates how single-pair wiring and automatic device IDs streamline maintenance. Such connectivity upgrades expand data granularity, reinforcing analytics-driven value within the pressure transmitter and transducer market.
Geography Analysis
Asia-Pacific generated 37.50% of global revenue in 2025, anchored by aggressive semiconductor capacity expansion. Foundries specify ultra-clean stainless-free assemblies, particularly in Taiwan and South Korea, reinforcing regional leadership within the pressure transmitter & transducer market. China’s shift toward higher-precision manufacturing keeps demand brisk for mid-range sensors in automotive and chemical plants. Japan sustains a premium niche for aerospace and robotics-grade instruments, while India’s vaccine plants boost cleanroom sensor uptake.
The Middle East leads growth at a 5.47% CAGR through 2031. Saudi Arabia’s Vision 2030 diversifies chemicals and hydrogen, elevating need for SIL-3 certified transmitters. SABIC’s USD 37.3 billion sales in 2024 fund low-carbon product rollouts reliant on advanced pressure control. The UAE’s localization drive is exemplified by Baker Hughes’ new Abu Dhabi facility, which trims lead times and heightens supply-chain resilience.
North America remains technologically forward, with shale operators adopting wireless transmitters for real-time well diagnostics. Federal incentives for carbon storage add specialized demand for high-integrity devices. Europe favors energy-efficiency retrofits and progressive safety norms, spurring purchases of smart, self-verifying transmitters for hydrogen clusters. South America’s deep-water campaigns in Brazil and Guyana mandate ultra-high pressure units, while mining projects across Chile and Peru secure rugged designs. Collectively, varied regional drivers sustain the pressure transmitter and transducer market’s balanced global footprint.

Value Chain Analysis
The value chain begins with upstream materials and components, including stainless steel and Inconel wetted parts, diaphragms, high-purity alumina or ceramic substrates, fiber-optic cable assemblies, and sensing and electronics inputs (piezoresistive or MEMS dies and ASIC-based signal conditioning). Supply risk tends to cluster around specialized MEMS fab capacity and single-source ASIC dependencies, and premium-grade materials often require longer supplier qualification cycles, commonly several weeks, which adds lead-time variability for high-integrity and hazardous-area builds.
Midstream activities focus on sensor die packaging, transmitter module assembly (including hermetic sealing, diaphragm welds, remote seals, and signal conditioning), calibration and verification, and compliance testing for end-use certifications. Downstream channels cover direct sales to oil and gas, chemical, power, and pharmaceutical operators, along with OEM integration into semiconductor tools, building systems, and industrial machinery through distributors and system integrators. Capacity moves by manufacturers, such as KELLER Pressure transitioning production into a new main building in Winterthur, Switzerland (January 2026), are aimed at tightening process control, improving throughput, and limiting disruption from cross-site handoffs in assembly and test.
Competitive Landscape
The field blends diversified giants and agile specialists. Emerson, ABB, Yokogawa, Honeywell, and Siemens leverage broad automation portfolios to capture multi-plant rollouts. Emerson’s 2025 refresh of the Rosemount 3051S line delivers ±0.025% accuracy and SIL-3 capability, reinforcing its premium tier. At the same time, software layers that visualize diagnostics and feed AI-based maintenance models now dominate value propositions.
Mid-sized players—WIKA, Keller, and Micro Sensor—differentiate through rapid custom engineering. Micro Sensor’s double-diaphragm MDM7100 earned Best of Industry recognition for stability in corrosive media. Such accolades help niche brands penetrate OEM machinery markets.
Investment in R&D remains robust; Endress+Hauser spent EUR 275.6 million (7.4% of 2024 sales) and launched 81 new instruments, many with Eco-Design features. Partnerships also abound: Fibercore allied with DIMIONE to bundle interrogators and fiber-optic sensors for European customers. These collaborations accelerate specialty offerings, sustaining competitive churn and driving innovation in the pressure transmitter and transducer market.
Pressure Transmitter And Transducer Industry Leaders
-
Emerson Electric Co.
-
ABB Ltd
-
Yokogawa Electric Corporation
-
Honeywell International Inc.
-
Siemens AG
- *Disclaimer: Major Players sorted in no particular order

Market Opportunities and Future Outlook
A clear whitespace exists in premium, application-specific instrumentation where functional safety, diagnostics, and harsh-environment survivability are bought as part of an operations-and-maintenance outcome rather than as a commodity sensor. Hydrogen and CCUS facilities specifying SIL-rated differential transmitters, Middle East refinery modernization tied to IEC 61511 compliance, and deep-water subsea developments requiring ultra-high pressure capability create room for suppliers that can bundle certified hardware, device health data, and support services into plantwide standards.
Semiconductor and advanced manufacturing also create demand pockets for specialized offerings that pair ultra-clean construction with stable low-pressure performance, alongside connectivity options that fit modern tool architectures. Endress+Hauser broke ground in June 2026 on a USD 20.2 million expansion of its Level+Pressure production center in Greenwood, Indiana, adding 40,000 sq ft to an existing 105,000 sq ft footprint, and Yokogawa began releasing the OpreX Pressure Transmitter EJX S Series in February 2026 using silicon resonant sensor technology for energy, chemical, and pharmaceutical applications. Together, these actions support regionalized supply, faster delivery for retrofit programs, and differentiation through higher accuracy, diagnostics, and certified performance in regulated and contamination-sensitive environments.
Recent Industry Developments
- July 2026: The US Defense Logistics Agency issued solicitation SPE4A6-26-T-03JQ to procure a pressure transmitter (NSN 6685-01-686-8884), with responses due July 14, 2026. The request highlights ongoing defense and aerospace demand for qualified pressure measurement hardware and reinforces the role of government procurement cycles in sustaining niche, specification-driven volumes.
- June 2026: Endress+Hauser broke ground on a USD 20.2 million expansion of its Level+Pressure production center in Greenwood, Indiana, adding 40,000 square feet to the existing facility. The added footprint is intended to support higher regional output and shorter lead times for pressure and level instrumentation deliveries into North American automation projects.
- November 2024: Baker Hughes inaugurated a surface pressure-control solutions center in Abu Dhabi to localize manufacturing and assembly of high-pressure equipment. The facility strengthens in-region availability for Middle East operators and supports refinery and upstream programs that emphasize modernization and tighter delivery schedules.


Research Methodology Framework and Report Scope
Market Definition and Coverage
This market is defined as revenues generated from pressure transmitters and pressure transducers that measure liquid or gas pressure, then convert it into an electrical signal read by an instrument or a control system.
Scope exclusions: It excludes purely mechanical gauges and manometers that do not provide an electrical output signal.
Segmentation Overview
-
By Product Type
-
Pressure Transmitters
- Differential Pressure
- Absolute Pressure
- Gauge Pressure
- Multivariable Pressure
-
Pressure Transducers
- Strain-Gauge Transducers
- Piezoresistive Transducers
- Capacitive Transducers
- Optical Transducers
-
Pressure Transmitters
-
By Sensing Technology
- Piezoresistive
- Capacitive
- Strain Gauge
- Piezoelectric
- Optical
- MEMS Hybrid
-
By Pressure Range
- Low (<100 psi / <7 bar)
- Medium (100-1000 psi)
- High (1 000-10 000 psi)
- Ultra-High (>10 000 psi)
-
By Output / Communication
- Analog (4-20 mA, 0-10 V)
- Digital (HART, Fieldbus, Profibus, Modbus)
- Wireless (WirelessHART, ISA100)
- IO-Link
-
By End-User Industry
- Oil and Gas
- Chemical and Petrochemical
- Power Generation and Utilities
- Water and Wastewater
- Food and Beverage
- Pharmaceuticals and Biotechnology
- Medical Devices and Healthcare
- Aerospace and Defense
- Semiconductor and Electronics
- Mining, Metals and Marine
-
By Geography
-
North America
- United States
- Canada
- Mexico
-
Europe
- Germany
- United Kingdom
- France
- Italy
- Spain
- Nordic Countries (Sweden, Norway, Denmark)
-
Asia-Pacific
- China
- Japan
- India
- South Korea
- Taiwan
- Southeast Asia (Indonesia, Malaysia, Thailand, Vietnam)
- Australia
- New Zealand
-
South America
- Brazil
- Argentina
- Chile
-
Middle East
- Saudi Arabia
- United Arab Emirates
- Qatar
- Turkey
-
Africa
- South Africa
- Nigeria
- Egypt
-
North America
Data Sources, Market Sizing, and Validation
Desk Research
Desk work starts with aligning the product boundary and the demand pool, so the model does not mix mechanical gauges with electrical measurement devices. We referenced public sources such as industrial production and price series from the US Bureau of Labor Statistics, trade and tariff line data from UN Comtrade, and standards and terminology references from ISO and IEC documents. We also used energy and industrial activity indicators from the US Energy Information Administration. For sensing technology context, we reviewed peer-reviewed engineering journals and patents, using a paid patent database subscription to track where sensing technologies are being used and upgraded.
To connect demand signals to supplier reality, we reviewed company filings, investor presentations, and reputable press coverage for capacity additions, product launches, and regional exposure. Import and export shipment-level trends were also checked through a paid trade database subscription to detect changes in cross-border flows for instrumentation parts. These sources were organized into an assumption sheet that can be challenged in interviews. The source list is illustrative, since we also reviewed other public materials to clarify and validate key assumptions.
Primary Interviews and Surveys
Primary inputs were collected through expert interviews and structured surveys with instrumentation suppliers, distributors, EPC and system integration contacts, and end users in process industries, utilities, and discrete manufacturing. We used these discussions to confirm typical price bands, replacement cycles, the share of digital versus analog output, and how often transmitters versus compact transducers are purchased for each application. For a global view, inputs were balanced across major demand centers, so regional adoption differences and tender timing effects could be captured more consistently.
Distribution of primary research fieldwork respondents
| Company type | Respondent position | Region |
|---|---|---|
| Top tier: 36% | CXOs: 12% | APAC: 43% |
| Mid tier: 48% | Functional/Unit leaders: 41% | EMEA: 34% |
| Smaller Players: 16% | Managers: 47% | Americas: 23% |
Market-Sizing & Forecasting
The sizing logic starts with a top-down build where industrial activity and process automation demand are reconstructed by end use, then converted into expected unit needs using penetration and replacement assumptions for pressure measurement points. Once the demand pool is formed, we corroborate it with selective bottom-up checks, such as sampled supplier revenue splits, channel checks on shipment direction, and typical ASP and volume for common pressure ranges. If the two views do not reconcile, we adjust totals based on the drivers that better fit the observed indicators.
Inputs used in the model include oil and gas upstream and midstream project activity, chemical and petrochemical capacity additions, water and wastewater capital spending signals, manufacturing output trends, and adoption of digital communication protocols in instrumentation upgrades. Where published data is thin, gaps are handled using ranges from interviews, anchored to observable indicators such as import intensity and factory output indices. Forecasting is done using scenario analysis supported by light multivariate regression on the strongest macro drivers. The final path is selected after sanity checks using field feedback on lead times, tender cycles, and pricing expectations.
Data Validation & Update Cycle
Validation is done in layers, so errors do not slip through in a single pass. We compare model outputs against independent signals such as trade direction, industrial production movement, and project award momentum, then investigate sharp year-over-year jumps before sign-off. If a major variance is seen by region or by application, we re-contact a small set of respondents to confirm whether it reflects a real shift or a modeling artifact.
Reports are refreshed annually, and interim updates are triggered when material events occur, such as large project deferrals, regulatory changes, or major pricing resets in key components. Before delivery, an analyst completes a final review pass to ensure the latest public data and new interview learnings are reflected consistently across the series.
Mordor Intelligence's Pressure Transmitter and Transducer Market Size Compared With Other Published Estimates
Published market sizes for this space often differ because each publisher draws the line around products and applications differently, then applies its own pricing and currency timing assumptions. Variation also shows up when one study emphasizes process industries while another blends in adjacent sensing products that sit outside classic instrumentation budgets.
Some external estimates focus only on pressure transmitters, and they may also blend in broader pressure sensor categories when discussing transducers. In Mordor Intelligence, we count only devices that convert pressure into an electrical output and are sold as pressure transmitters or pressure transducers, with mechanical gauges excluded. Pricing is validated using interview-led ASP ranges and recent trade and production signals.
Benchmark comparison
| Source | Market Size | Gaps in Research Methodology |
|---|---|---|
| Mordor Intelligence | USD 3.32 B (2026) | |
| Global Consultancy A | USD 2.63 B (2025) | The figure is presented for transmitters only with a different base year, and the scope emphasis is on transmitter applications, which can undercount compact transducers sold into OEM equipment. |
| Industry Publisher B | USD 3.10 B (2024) | The estimate uses an earlier current year and appears transmitter-led, which can shift value due to currency timing and a different treatment of digital output upgrades and replacement driven demand. |
The spread in the table is largely explained by scope line items and timing, not a fundamental disagreement on demand direction. When we keep the scope tied to electrical output pressure measurement devices, and then cross-check pricing and adoption changes through interviews and observable industry indicators, the final market value stays traceable to clear steps that can be repeated each year.


Key Questions Answered in the Report
What is the current size of the pressure transmitter & transducer market?
The market is valued at USD 3.32 billion in 2026 and is forecast to reach USD 3.92 billion by 2031 at a 3.38% CAGR.
Which region holds the largest share of the pressure transmitter & transducer market?
Asia-Pacific leads with 37.50% share in 2025, driven by semiconductor and industrial expansion.
Which product segment is growing the fastest?
Multivariable transmitters are advancing at a 5.55% CAGR because they consolidate multiple measurements into one device, cutting installation costs.
Why are optical pressure sensors gaining popularity?
They resist electromagnetic interference and perform well in harsh or high-temperature environments, fueling a 6.88% CAGR through 2031.
How are wireless protocols impacting the pressure transmitter & transducer industry?
WirelessHART and similar networks reduce cabling costs and enable remote diagnostics, supporting the segment’s 7.72% CAGR.
What are the main restraints on market growth?
MEMS-chip failures in high-vibration down-hole conditions and aggressive price competition in 0-10 bar ranges are the most influential restraints.
Page last updated on:


