Technology, Media and Telecom
5th MayPricing Strategy for Semiconductor Components
3 Min Read
The United States Pressure Sensors Market Report is Segmented by Sensor Type (MEMS, Strain-Gauge and More), Technology (Piezoresistive, Capacitive and More), Output Interface, Pressure Range, Application (Automotive, Medical, Industrial, Consumer Electronics and More), US Region (Northeast, Midwest and More)
Market Overview
| Study Period | 2020 - 2031 |
|---|---|
| Base Year For Estimation | 2025 |
| Forecast Data Period | 2026 - 2031 |
| Market Size (2026) | USD 24.82 Billion |
| Market Size (2031) | USD 35.14 Billion |
| Growth Rate (2026 - 2031) | 7.18 % CAGR |
| Market Concentration | Medium |
Major Players *Disclaimer: Major Players sorted in no particular order. Image © Mordor Intelligence. Reuse requires attribution under CC BY 4.0. |
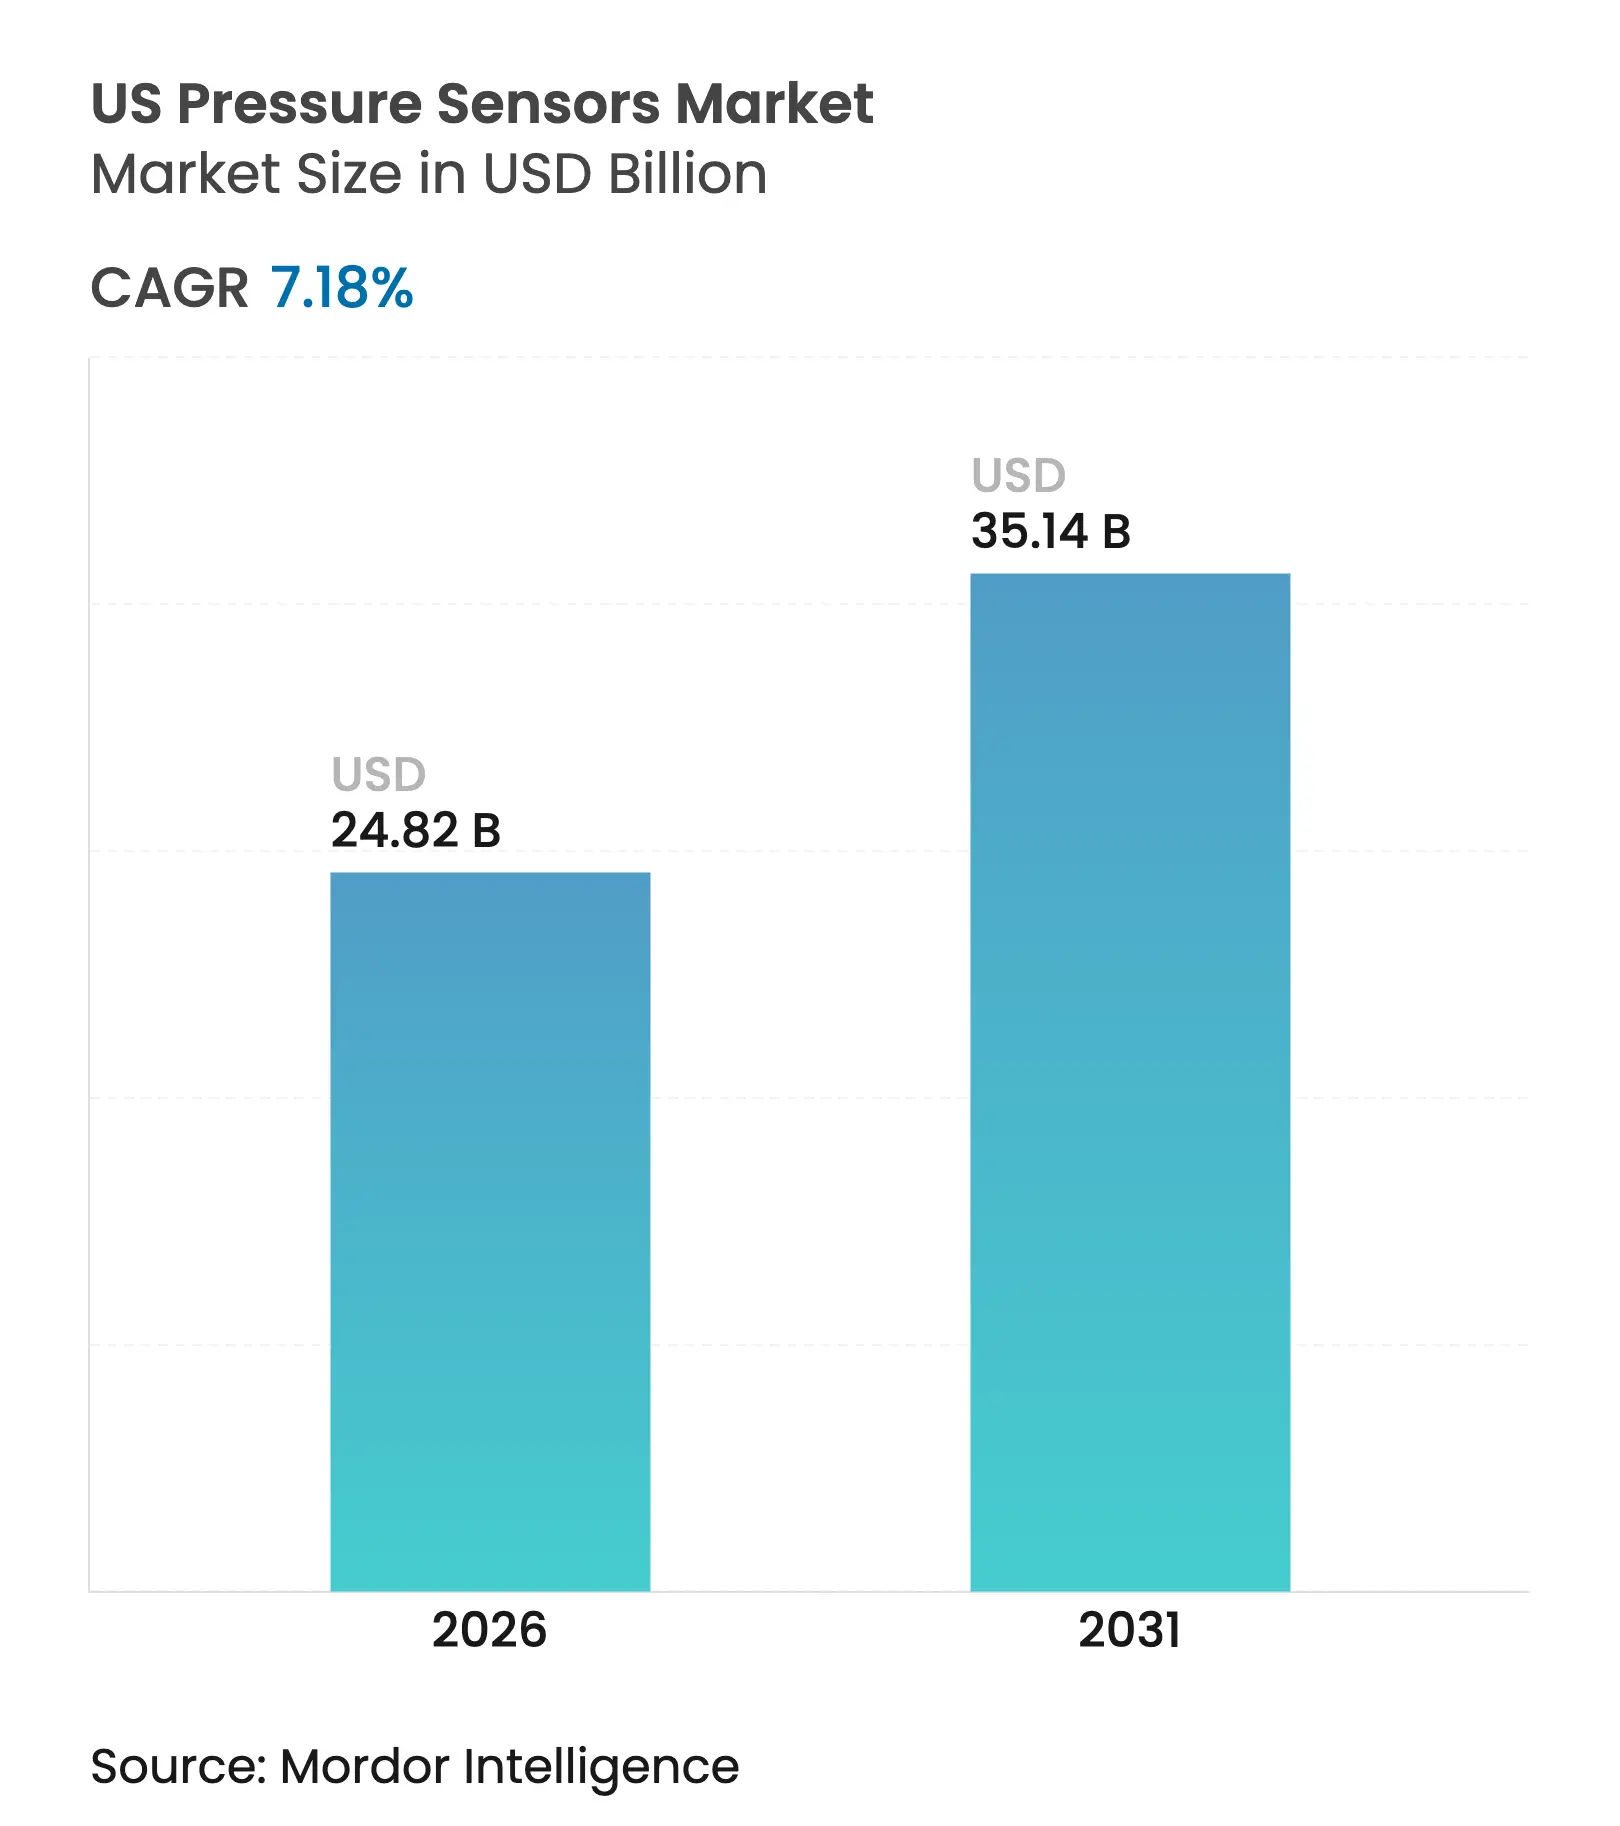
The US pressure sensors market size is expected to grow from USD 23.16 billion in 2025 to USD 24.82 billion in 2026 and is forecast to reach USD 35.14 billion by 2031 at 7.18% CAGR over 2026-2031. Semiconductor manufacturers are driving a large share of this expansion as fabs tighten vacuum and gas control tolerances below ±0.05% full scale. Heightened safety rules in automotive, medical, and LNG infrastructure keep demand resilient even when supply chains face stress. The convergence of MEMS and NEMS platforms is reshaping cost curves, with nanoscale devices setting new accuracy benchmarks while easing integration into AI-ready modules. Battery-powered IoT systems are pushing adoption of capacitive designs that combine low power with temperature stability. Regionally, the South benefits from energy-cost advantages that attract new plants, while helium scarcity is forcing packaging innovation that improves long-term hermeticity.
Key Report Takeaways
Note: Market size and forecast figures in this report are generated using Mordor Intelligence's proprietary estimation framework, updated with the latest available data and insights as of 2026.
Drivers Impact Analysis
| Driver | (~) % Impact on CAGR Forecast | Geographic Relevance | Impact Timeline | |||
|---|---|---|---|---|---|---|
TPMS replacement cycle accelerates aftermarket demand TPMS replacement cycle accelerates aftermarket demand | +1.2% | Northeast, Midwest | Medium term (2-4 years) | (~) % Impact on CAGR Forecast :+1.2% | Geographic Relevance :Northeast, Midwest | Impact Timeline :Medium term (2-4 years) |
Medicare reimbursement for home BP monitors Medicare reimbursement for home BP monitors | +0.8% | South, West | Short term (≤ 2 years) | |||
OSHA LNG continuous-logging mandate OSHA LNG continuous-logging mandate | +0.9% | South, Gulf Coast | Medium term (2-4 years) | |||
Semiconductor-fab ultra-high-accuracy demand Semiconductor-fab ultra-high-accuracy demand | +1.5% | West, Northeast | Long term (≥ 4 years) | |||
| Source: Mordor Intelligence | ||||||
TPMS Replacement Cycle Accelerates Aftermarket Demand
First-generation mandatory Tire Pressure Monitoring Systems are now reaching end-of-life, creating repeat business for sensor suppliers. Vehicles built after the 2007 TREAD Act are entering second and third replacement cycles, and winter road-salt exposure in the Northeast and Midwest quickens battery depletion. Bartec Auto ID’s 2025 Rite-SensorBlue®, tailored for Tesla models, illustrates the shift toward EV-optimized TPMS that adds Bluetooth diagnostics and extends service intervals. Predictive alerts embedded in these units move the aftermarket from reactive swaps to scheduled maintenance, supporting premium price points. [1]Bartec Auto ID, “TPMS News,” bartecautoid.com
Medicare Reimbursement for Home BP Monitors
Expanded Medicare and Medicaid coverage now reaches 84% of state plans for self-measured blood pressure devices, opening access for about 1.4 million beneficiaries with hypertension. Michigan’s program pays up to USD 75 per device, setting a national pricing anchor. This reimbursement landscape fuels rapid demand for reliable low-pressure sensors that fit in compact arm-cuffs while streaming data into telehealth platforms. [2]American Medical Association, “42 State Medicaid Plans Now Cover Home BP Monitoring Services,” ama-assn.org
OSHA LNG Continuous-Logging Mandate
Since early 2024 OSHA requires real-time pressure logging across LNG facilities, driving uptake of intrinsically safe sensors certified for hazardous areas. The Pipeline and Hazardous Materials Safety Administration’s January 2025 rule proposal for CO₂ pipelines mirrors these rules, broadening the opportunity footprint along the Gulf Coast. Implementation costs of USD 21.3 million a year translate directly into equipment budgets for vendors able to meet SCADA connectivity standards. [4]Pipeline and Hazardous Materials Safety Administration, “PHMSA Notice of Proposed Rulemaking for CO2 Pipelines,” phmsa.dot.gov
Semiconductor-Fab Ultra-High-Accuracy Demand
Continued investment exceeding USD 540 billion has placed US fabs on a path to produce at 3 nm and below, tightening process windows and pulling in sensors with <0.05% FS accuracy. Weak-coupling resonator designs now deliver 1.99% relative deviation at elevated temperatures, while embedded AI calibrates drift in real time, extending sensor service life inside cleanrooms.
Restraints Impact Analysis
| Restraint | (~) % Impact on CAGR Forecast | Geographic Relevance | Impact Timeline | |||
|---|---|---|---|---|---|---|
Smart-phone barometer saturation Smart-phone barometer saturation | −0.6% | West | Short term (≤ 2 years) | (~) % Impact on CAGR Forecast :−0.6% | Geographic Relevance :West | Impact Timeline :Short term (≤ 2 years) |
Helium shortage inflates MEMS packaging cost Helium shortage inflates MEMS packaging cost | −0.4% | National | Medium term (2-4 years) | |||
| Source: Mordor Intelligence | ||||||
Smart-Phone Barometer Saturation
Nearly every mid-to-high-tier handset now ships with a barometric sensor, capping volume growth in consumer electronics. Manufacturers pivot toward differentiated performance such as ultra-low-power variants for wearables or high-precision altimeters for drones, carving niche gains in an otherwise mature space concentrated in West Coast supply chains.
Helium Shortage Inflates MEMS Packaging Cost
A 30% helium price jump since 2024 raises costs for hermetic sealing. Vendors respond with alternative materials and leadless packages for silicon carbide die, solutions showcased at the 2024 MicroFluidic Handling Systems conference. Novel packaging reduces noble gas dependency and widens high-temperature operating envelopes, lowering lifetime ownership costs for industrial users.
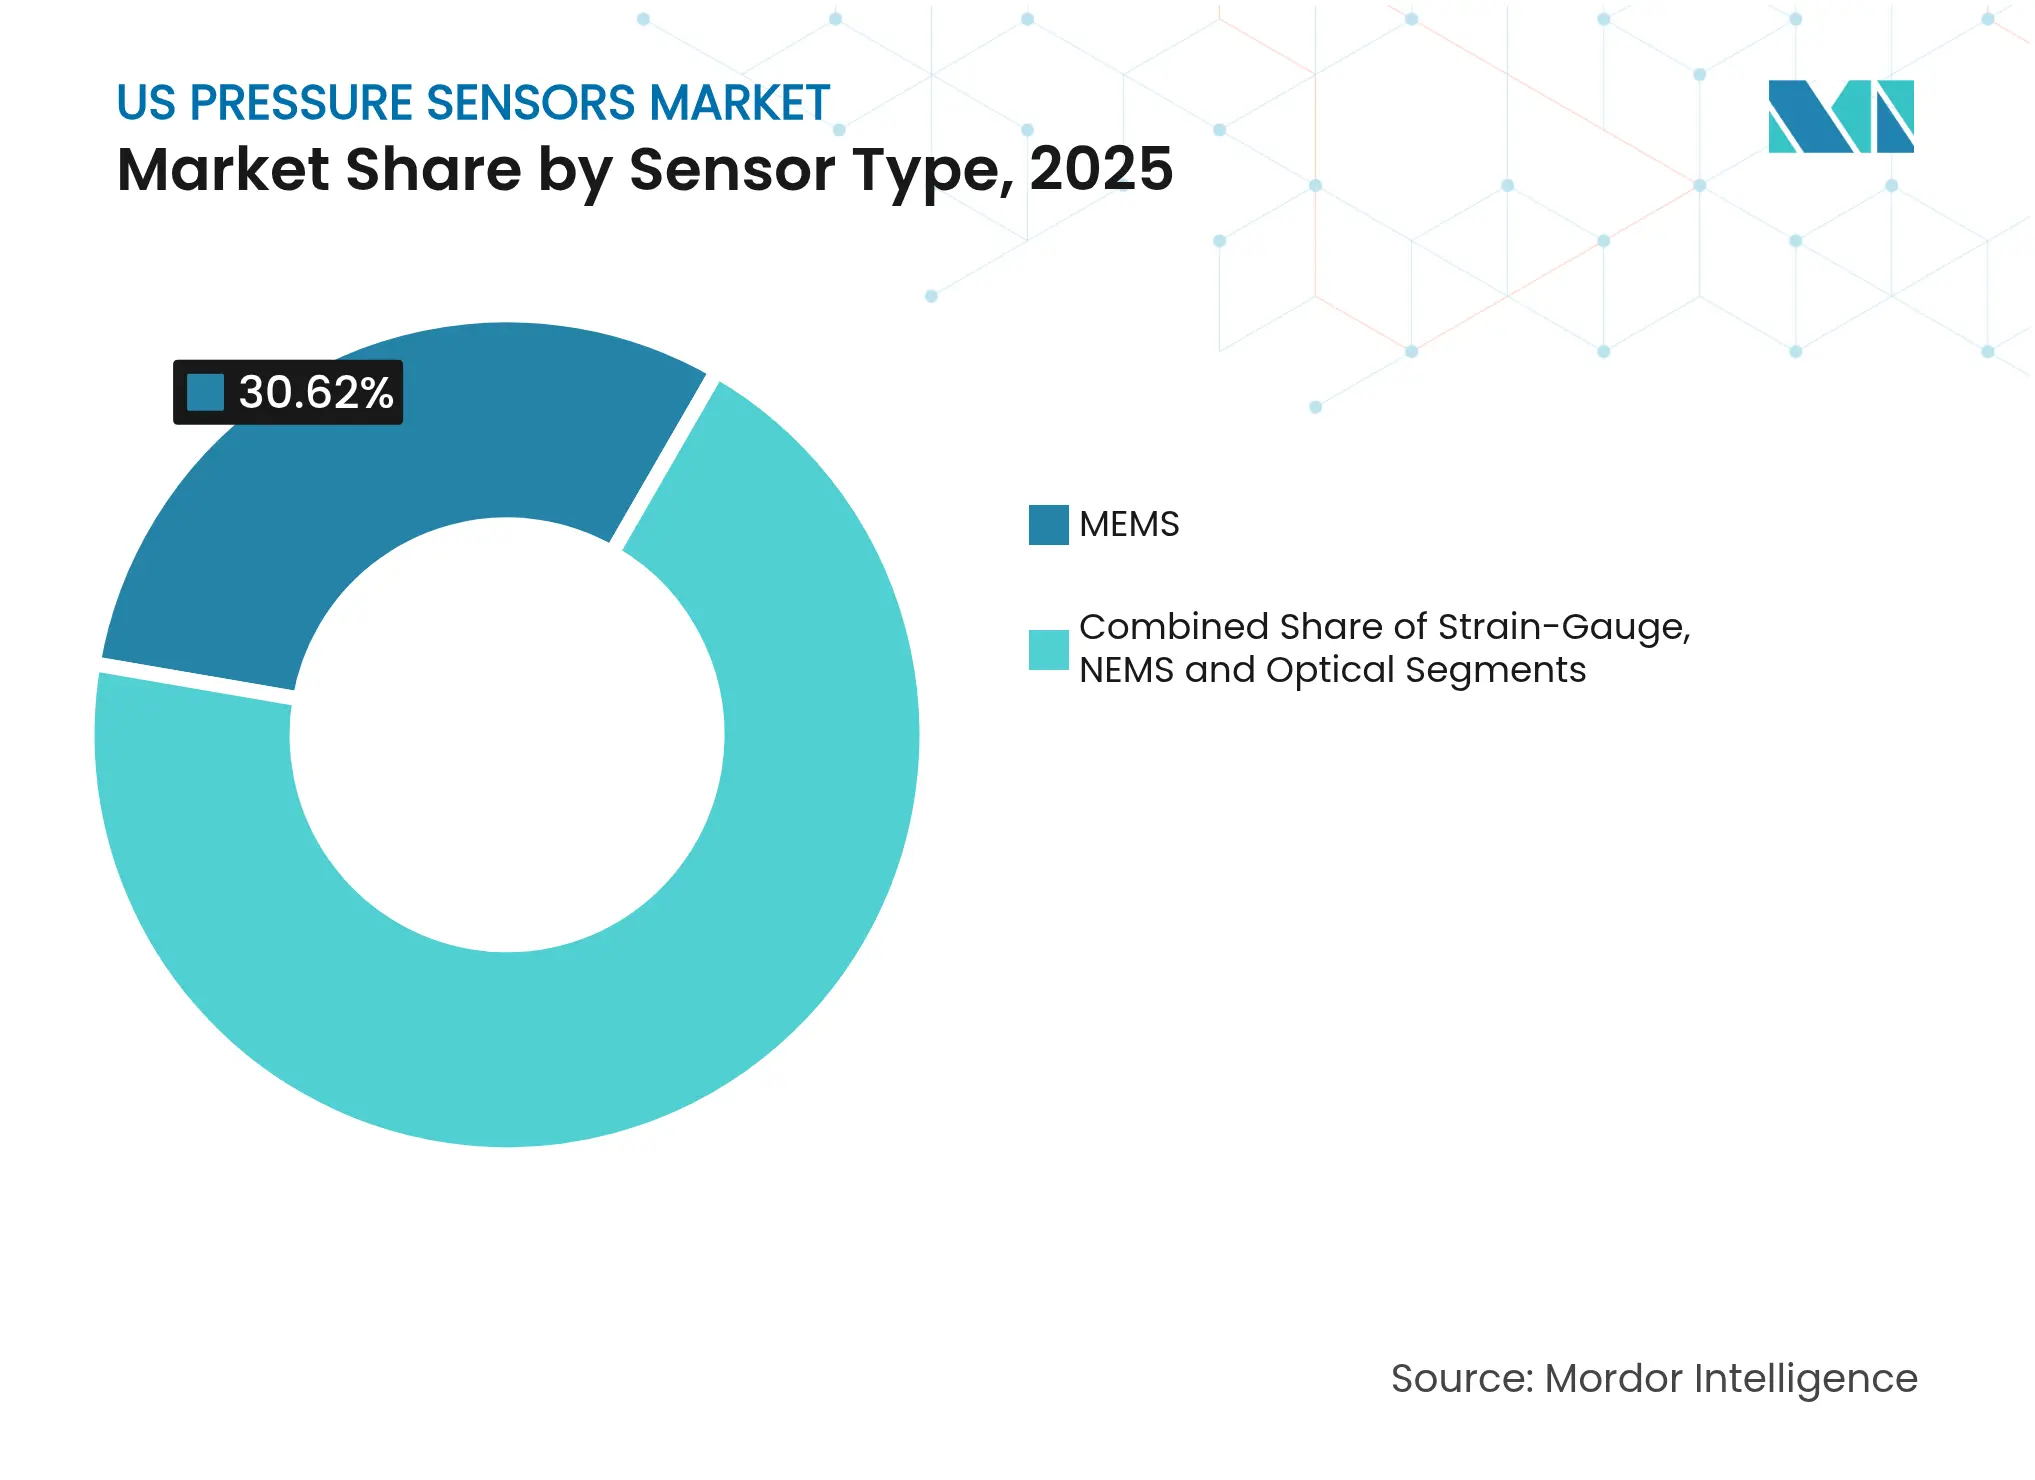
By Sensor Type: NEMS Disrupts Traditional Dominance
MEMS held 30.62% of the US pressure sensors market share in 2025 and underpin mainstream automotive and industrial designs. Yield-optimized silicon lines keep unit costs low, while graphene membranes now lift sensitivity to 66 µV/V/kPa, enhancing resolution for altimeters and medical wearables. Strain-gauge devices remain favored in harsh settings such as upstream oil where silicon carbide variants work reliably at 600 °C. Optical sensors gain ground in environments with strong electromagnetic fields.
As foundries deploy shared tooling, production scale will narrow cost gaps with MEMS, opening broader adoption in high-volume medical disposables. The US pressure sensors market will therefore see a gradual blend of micro and nano formats in mixed-technology modules that embed AI and data encryption.
Note: Segment shares of all individual segments available upon report purchase
By Technology: Capacitive Sensing Gains Momentum
Piezoresistive architectures led with 45.35% revenue share in 2025 because manufacturers can reuse mature CMOS back-end steps. Recent silicon-carbide revisions cut the temperature coefficient of zero output to 0.08% per °C, fitting harsh oilfield or aerospace needs. Polynomial-regression algorithms embedded in ASICs trim residual errors to 0.008% FS, aligning accuracy with mission-critical expectations.
Capacitive sensing, projected to rise at a 9.76% CAGR, provides superior energy efficiency vital for battery-powered IoT nodes. ES Systems’ 2024 release achieves ±0.25% FS total error while offering I²C, SPI, and analog outputs. Resonant techniques stay in specialty vacuum gauges where 0.1 Pa resolution guides semiconductor chamber pressure. The US pressure sensors market will see competitive overlap as vendors integrate multiple technologies into single packages that let OEMs dial performance to application-specific thresholds.
By Pressure Range: Low-Pressure Precision Drives Innovation
Medium range devices from 10 kPa to 1 MPa contributed 56.42% to the US pressure sensors market size in 2025 because they cover HVAC, hydraulic, and process duties. Non-linearity is now down to 0.71% across −30 °C to +60 °C ambient, lowering calibration cycles for OEMs.
Low-pressure models below 10 kPa will outpace other ranges with an 8.18% CAGR, backed by medical wearables that detect subtle respiratory patterns and by environmental stations measuring air quality. Flexible polymer diaphragms now sense as low as 1.5 kPa and settle in under 50 ms, making them ideal for continuous patient monitoring. High-pressure variants above 1 MPa remain crucial in deep-well drilling and hydraulic fracturing. Silicon-carbide die withstand 350 bara at 600 °C, a performance envelope that keeps US aerospace programs competitive. The US pressure sensors market will therefore segment by application severity, not just by absolute pressure.

Recognized by Experts. Trusted by Leaders.
A trusted intelligence partner to global decision-makers across 90+ countries.


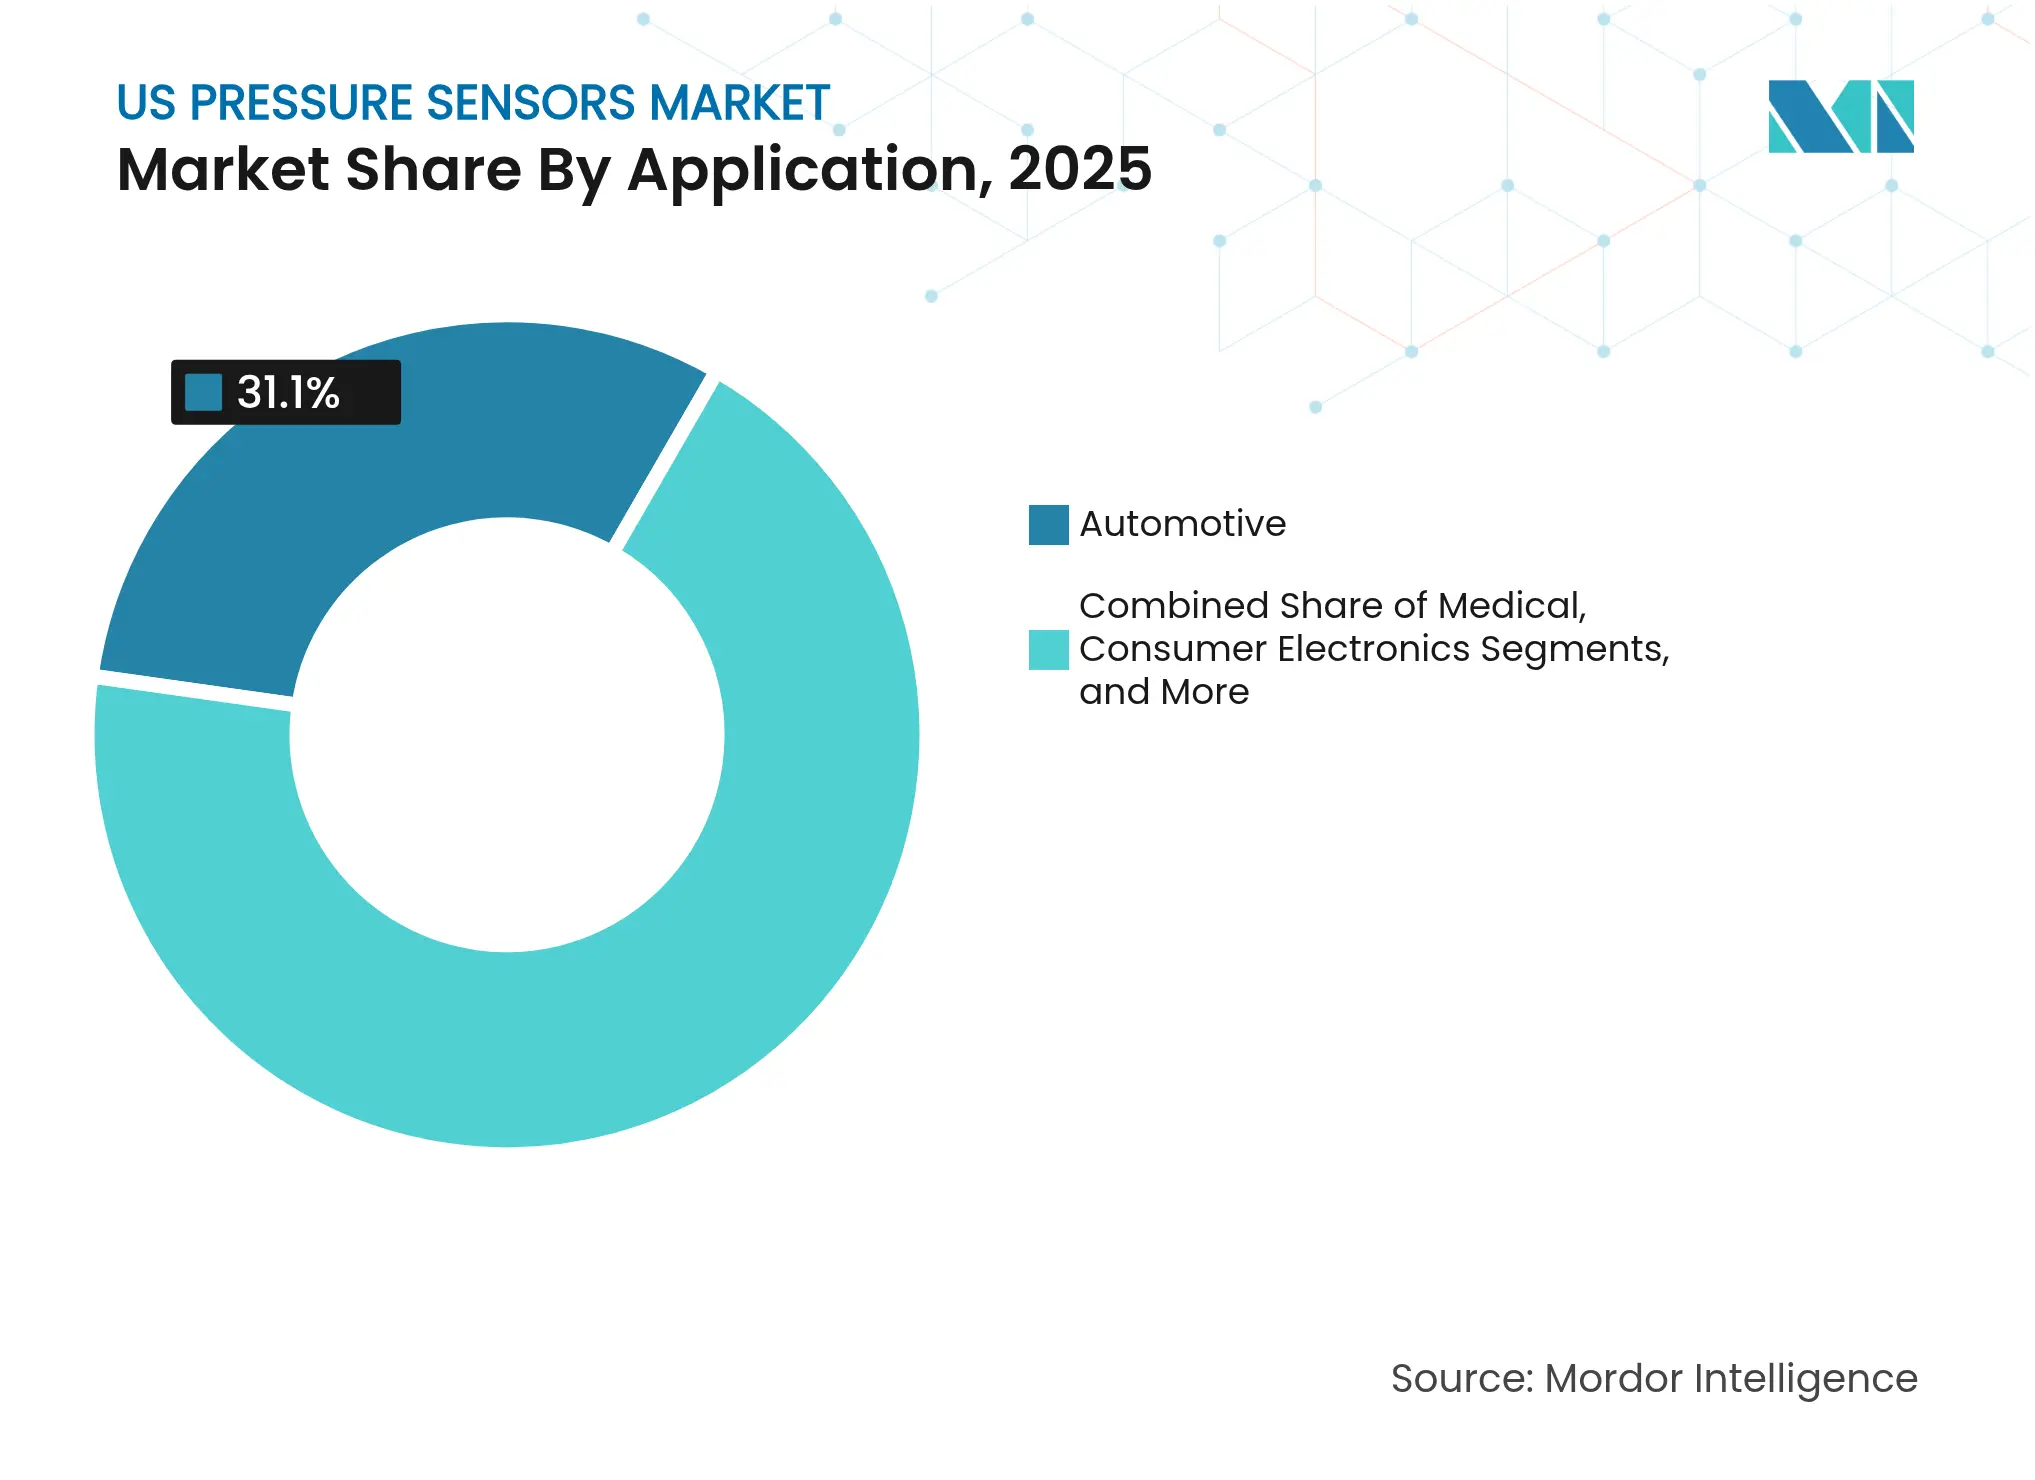
By Application: Automotive Innovation Drives Dual Leadership
Automotive held 31.10% of the US pressure sensors market share in 2025 and also posts the highest 9.42% CAGR. TPMS mandates guarantee baseline volumes and the shift to EV platforms adds demand for battery pressure and thermal management sensors. Bartec’s Bluetooth TPMS tool suite underscores the trend toward over-the-air diagnostics that reduce service bay time.
Medical devices are the next high-growth arena as public reimbursement widens. Home blood pressure kits link through cellular hubs, expanding cloud-connected cohorts for cardiology research. Industrial automation relies on pressure data for predictive maintenance, while aerospace and defense demand radiation-tolerant models. HVAC adoption rises as building owners employ sensor arrays to optimize air handling energy use. Across each vertical, embedded AI accelerates the conversion of raw pressure data into actionable events, further integrating sensors into end-to-end value propositions within the US pressure sensors market.
Note: Segment shares of all individual segments available upon report purchase
By Output Interface: Digital Protocols Enable Advanced Analytics
Analog leads legacy installations because PLC input cards already match voltage or current loops. However, noise susceptibility and limited metadata cap its usefulness. Smart hybrids embed A-to-D conversion beside the sensing element then output voltage for backward compatibility while exposing the same data via I²C.
Digital interfaces such as I²C and SPI are expanding inside factory automation and medical devices, letting users pull temperature compensation and self-diagnostic flags. Sensata’s digital water pressure sensor forwards leak alerts to SCADA dashboards for utilities. As edge analytics spreads, Ethernet-APL certified flowmeters from ABB illustrate how deterministic networking now reaches sensor level, creating unified data fabrics inside plants. The US pressure sensors market is expected to weight future design wins toward digital-ready SKUs that shorten commissioning time.
Manufacturing demand is broadly distributed across automotive, semiconductor, medical-device, and energy supply chains, providing a balanced base that buffers the industry from sector-specific swings. Semiconductor fabs are tightening process tolerances below ±0.05% FS are pulling in ultra-high-accuracy devices, while nationwide TPMS mandates sustain a dependable replacement cycle. National demand tilts toward medium-range sensors that held 56.42% of the US pressure sensors market share in 2025, yet low-pressure models are advancing at an 8.18% CAGR as home health monitoring accelerates.
Federal safety regulations—including OSHA’s continuous logging requirement for LNG installations and the proposed PHMSA rules for CO₂ pipelines—are embedding continuous pressure monitoring into critical infrastructure. These mandates create predictable procurement budgets because operators must install intrinsically safe sensors that interface with SCADA networks for real-time compliance reporting. On the industrial front, expanding automation investments are elevating demand for digital-output devices that feed predictive-maintenance platforms, while 84% of Medicaid programs now cover self-measured blood pressure devices, scaling sensor volume for connected medical equipment. Together, regulatory pull and reimbursement incentives form a structurally diverse growth foundation for the US pressure sensors market.
Supply-chain resilience initiatives encourage domestic sourcing of critical components, and more than USD 540 billion in announced semiconductor capacity commitments are catalyzing local sensor agreements. Helium scarcity has spurred nationwide investment in alternative hermetic packaging that reduces noble-gas reliance and widens operating envelopes for harsh-environment designs. Edge-AI integration is emerging as a unifying theme across factories, vehicles, and medical devices, prompting manufacturers to embed machine-learning cores that perform drift correction and anomaly detection on-device. Competitive advantage is increasingly tied to delivering such intelligent modules at scale, which helps sustain price premiums despite rising raw-material costs.

Reports are available across multiple geographies.
Gain in-depth market insights across regions to support informed decisions.
Market Concentration
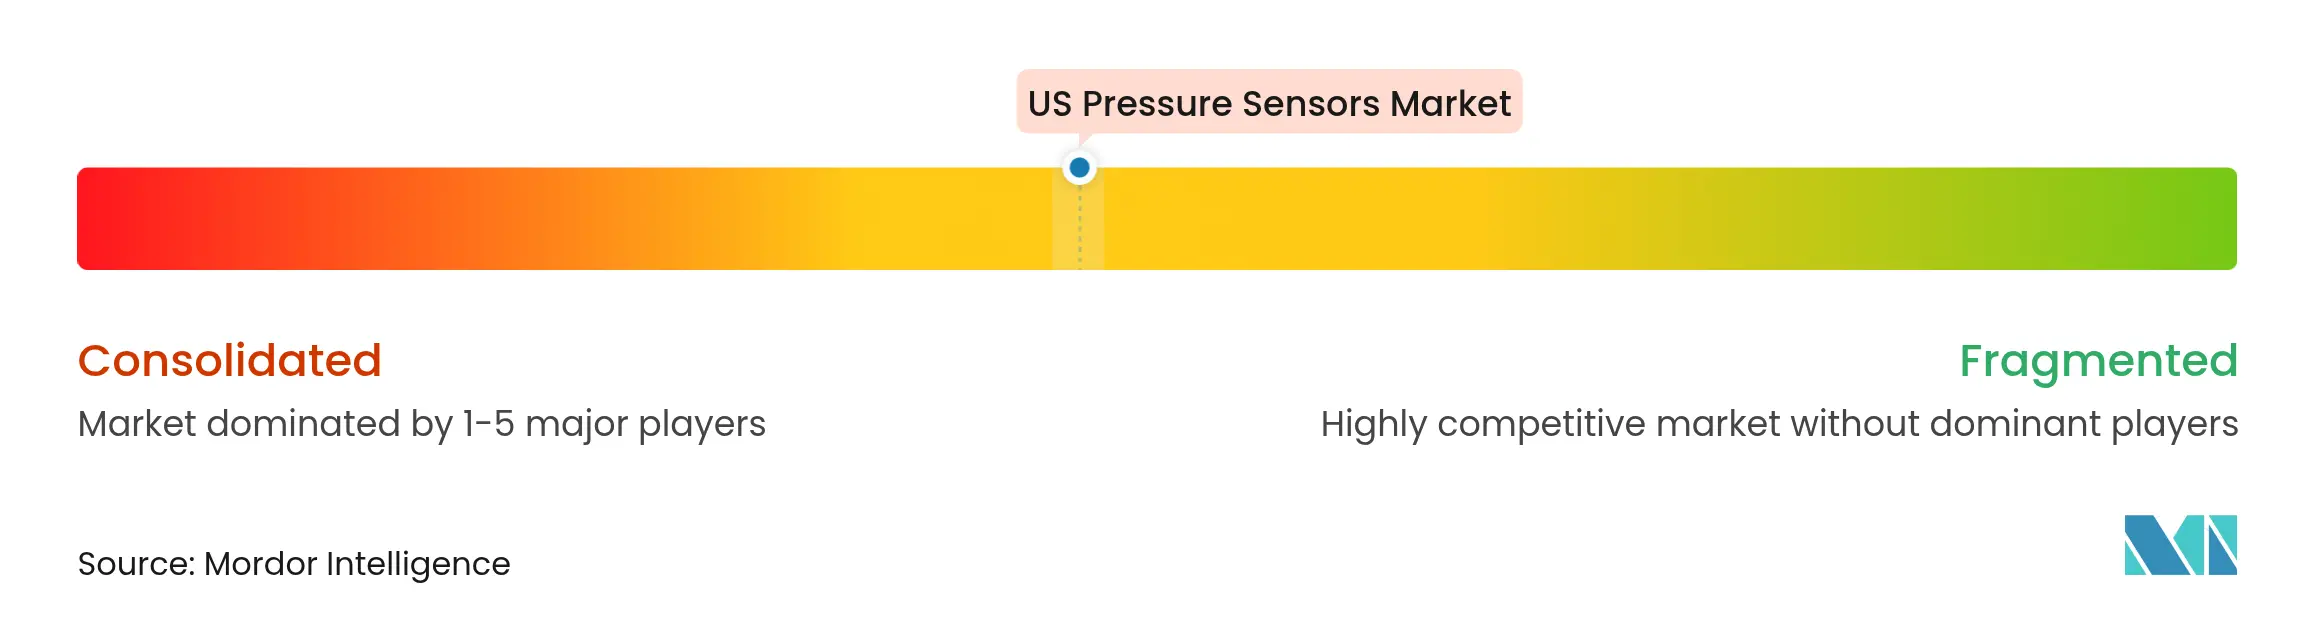
The US pressure sensors market is moderately fragmented. Honeywell, Bosch, and Sensata leverage vertical integration to secure key OEM slots and comply with demanding quality audits. Acquisition activity is high: Emerson bought Flexim and DwyerOmega absorbed Process Sensing Technologies in 2024, expanding reach into complementary flow and humidity sensing.
Volume-oriented players chase economies of scale for automotive and consumer batches, whereas niche specialists such as All Sensors Corp. and Kulite focus on aerospace and industrial extremes where unit margins are higher. This bifurcation steers different R&D priorities; tier-one vendors refine ASIC co-design for lower power, while specialists craft silicon-carbide or graphene membranes that survive corrosive and high-temperature environments.
Edge AI integration represents a parallel battleground. Vendors that bundle inference engines inside the sensor package cut latency and reduce cloud bandwidth, features that resonate with asset owners seeking to harden cybersecurity by keeping analytics on site.

*Disclaimer: Major Players sorted in no particular order
1. INTRODUCTION
2. RESEARCH METHODOLOGY
3. EXECUTIVE SUMMARY
4. MARKET LANDSCAPE
5. MARKET SIZE AND GROWTH FORECASTS (VALUE)
6. COMPETITIVE LANDSCAPE
7. MARKET OPPORTUNITIES AND FUTURE OUTLOOK
Market Definitions and Key Coverage
Segmentation Overview
Detailed Research Methodology and Data Validation
Desk Research
Primary Research
Market-Sizing & Forecasting
Data Validation & Update Cycle
Why Our United States Pressure Sensors Baseline Commands Reliability
Benchmark comparison
| Market Size | Anonymized source | Primary gap driver | ||
|---|---|---|---|---|
USD 23.16 B (2025) | Mordor Intelligence | - | Anonymized source:Mordor Intelligence | Primary gap driver:- |
USD 3.70 B (2024) | Global Consultancy A | Captures only packaged chips; excludes transmitters and aftermarket modules | ||
USD 4.34 B (2024) | Industry Journal B | Employs conservative ASP drawn from consumer electronics alone | ||
USD 2.80 B (2024) | Research Boutique C | Uses 2021 price deck and does not adjust for IoT-linked sensor upgrades |
Pricing Strategy for Semiconductor Components
3 Min Read
Accelerating Additive Manufacturing Adoption in India
3 Min Read
A Leading Sanitaryware Company’s Journey in Saudi Arabia
4 Min Read
When decisions matter, industry leaders turn to our analysts. Let’s talk.