Pre-Shipment Inspection Market Size and Share
Market Overview
| Study Period | 2020 - 2031 |
|---|---|
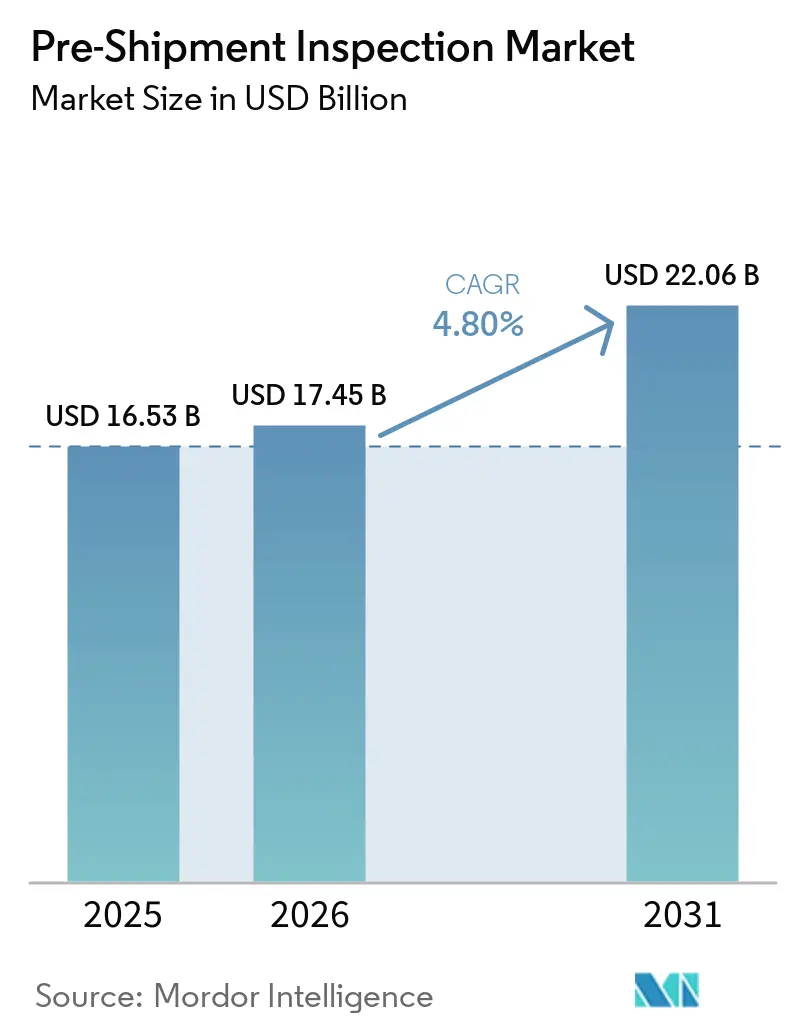
| Market Size (2026) | USD 17.45 Billion |
| Market Size (2031) | USD 22.06 Billion |
| Growth Rate (2026 - 2031) | 4.80% CAGR |
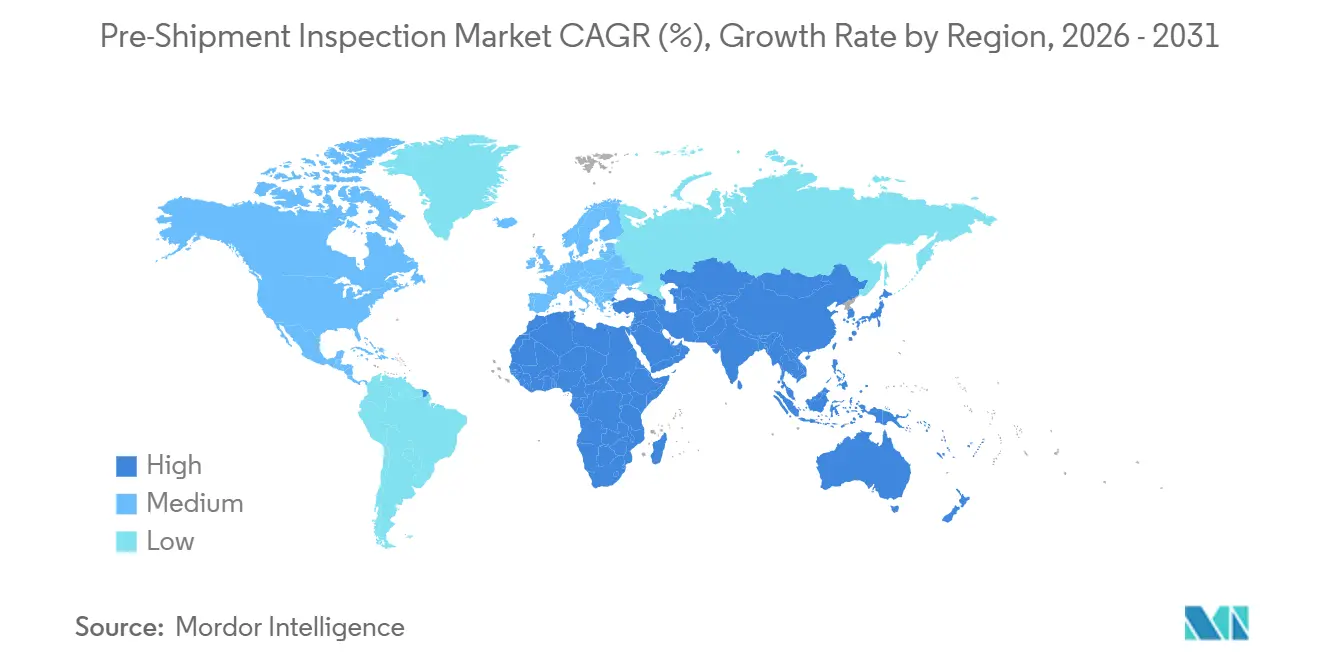
| Fastest Growing Market | Asia Pacific |
| Largest Market | Middle East and Africa |
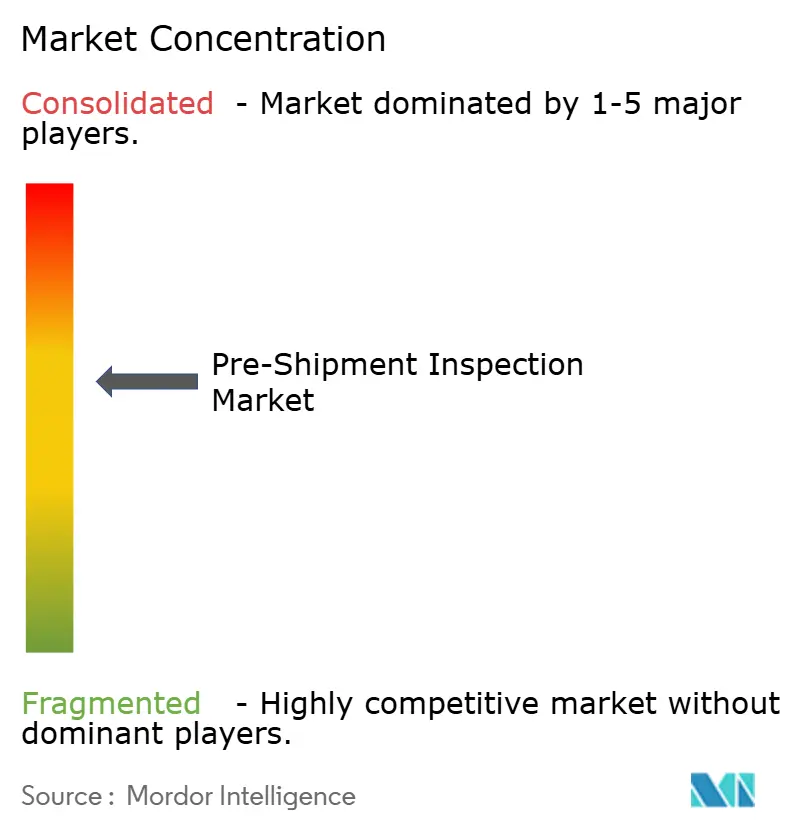
| Market Concentration | Medium |
Major Players *Disclaimer: Major Players sorted in no particular order Image © Mordor Intelligence. Reuse requires attribution under CC BY 4.0. | |
Pre-Shipment Inspection Market Analysis by Mordor Intelligence
The Pre-Shipment Inspection market size is projected to expand from USD 16.53 billion in 2025 and USD 17.45 billion in 2026 to USD 22.06 billion by 2031, registering a CAGR of 4.8% between 2026 to 2031. Steady growth reflects tighter global safety regulations, a surge in cross-border e-commerce, and the preference for capital-light operating models. Outsourced quality-assurance programs dominate because manufacturers wish to avoid fixed laboratory costs, while digital inspection certificates gain traction as insurers and customs offices pursue tamper-proof documentation. Asia-Pacific remains the revenue anchor, yet the Middle East and Africa post the fastest expansion as new pre-clearance mandates activate. Competitive pressure intensifies as global leaders acquire regional specialists and embed artificial-intelligence tools that deliver same-day digital reports.
Key Report Takeaways
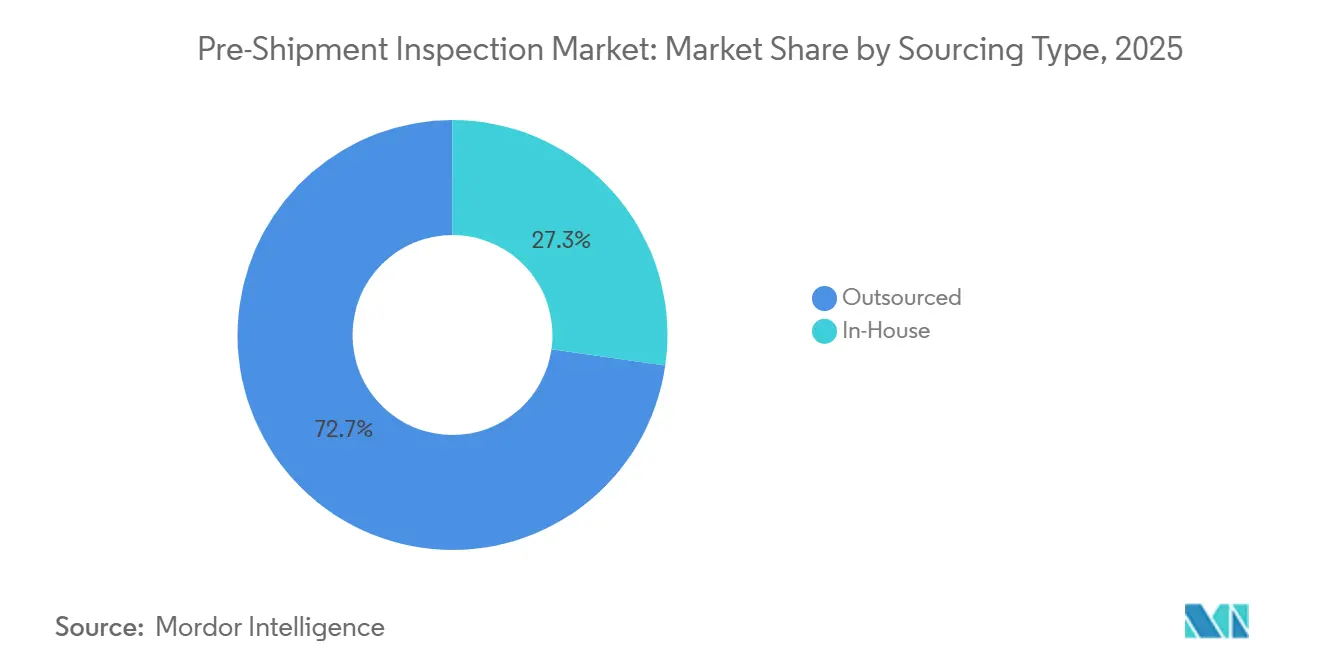
- By sourcing type, outsourced inspection held 72.74% of the Pre-Shipment Inspection market share in 2025 and is projected to advance at a 5.28% CAGR through 2031.
- By service type, blockchain-enabled digital certification recorded the highest forecast growth at a 5.55% CAGR in the Pre-Shipment Inspection market between 2026 and 2031.
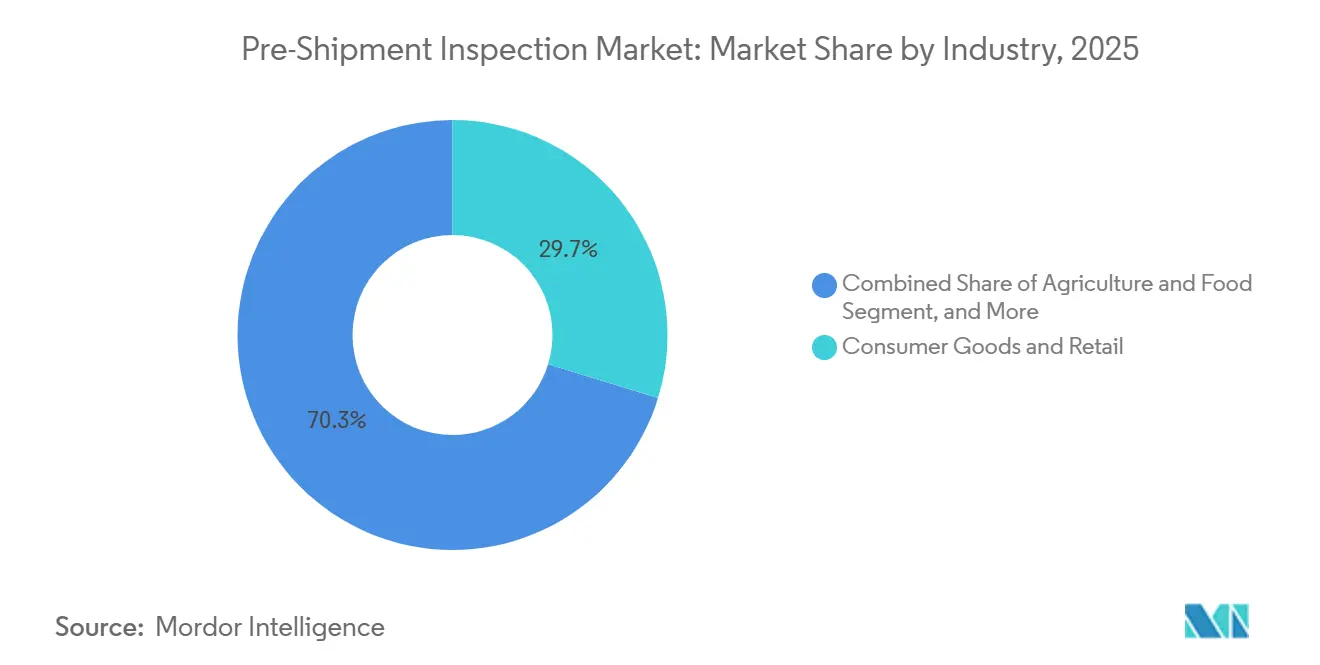
- By industry, consumer goods and retail led with 29.73% of the Pre-Shipment Inspection market size in 2025, while agriculture and food posted the fastest 5.31% CAGR to 2031.
- By shipment mode, sea freight accounted for 64.62% share of the 2025 Pre-Shipment Inspection market size, and air cargo is set for a 5.22% CAGR through 2031.
- By geography, Asia-Pacific commanded 41.68% of the 2025 Pre-Shipment Inspection market in 2025, whereas the Middle East and Africa are forecast to grow at 5.16% CAGR to 2031.
Note: Market size and forecast figures in this report are generated using Mordor Intelligence’s proprietary estimation framework, updated with the latest available data and insights as of January 2026.
Global Pre-Shipment Inspection Market Trends and Insights
Driver Impact Analysis*
| Driver | (~) % Impact on CAGR Forecast | Geographic Relevance | Impact Timeline |
|---|---|---|---|
| Stringent Global Product-Quality and Safety Regulations | +1.4% | Global, with focus on North America, European Union, and Asia-Pacific export hubs | Medium term (2-4 years) |
| Asia-Pacific Export Boom Driving Compliance Certificates | +1.2% | Asia-Pacific core, with spill-over to Middle East and Africa import corridors | Long term (≥ 4 years) |
| Rising Product Recalls and E-Commerce Counterfeiting | +0.9% | Global, acute in North America and European Union consumer markets | Short term (≤ 2 years) |
| Blockchain-Secured Digital Inspection Certificates | +0.7% | Early adoption in European Union and Middle East, with pilot programs in Asia-Pacific | Medium term (2-4 years) |
| Outsourcing Trend to Cut In-House QA Costs | +0.5% | Global, pronounced among SMEs in South America and Africa | Long term (≥ 4 years) |
| Insurer Demand for Verified Data for Parametric Cover | +0.3% | North America and European Union, with niche penetration in Asia-Pacific cold-chain corridors | Medium term (2-4 years) |
| Source: Mordor Intelligence | |||
Stringent Global Product-Quality and Safety Regulations
Governments outsource border-control tasks to accredited bodies to accelerate clearance without lowering safety thresholds. The United States Food and Drug Administration now requires lot-level traceability for high-risk produce, making pre-shipment certificates a legal requirement.[1]U.S. Food and Drug Administration, “FSMA Traceability Final Rule,” fda.gov India broadened its import inspection rules in early 2026, and Kenya contracted nine international firms to police new programs, expanding the addressable volume. Morocco’s Product Conformity Assessment platform cut certificate issuance time by 40% through digital workflows.[2]PortNet, “Product Conformity Assessment Platform,” portnet.ma These moves collectively push manufacturers to hire third-party inspectors to stay compliant.
Asia-Pacific Export Boom Driving Compliance Certificates
Electronics, textiles, and machinery that leave China, Vietnam, and India face stricter conformity rules in destination markets; many buyers stipulate third-party inspection before shipment. Bilateral fresh-fruit programs between Chile and the United States processed more than 850 000 tonnes in the 2025-2026 season, showing how pre-export certificates speed customs clearance.[3]USDA APHIS, “Chile–U.S. Pre-Clearance Program Renewal,” usda.gov Saudi Arabia’s SABER and Spain’s new recycled-content marks also need independent validation, channeling business toward inspection providers across Asia-Pacific.
Rising Product Recalls and E-Commerce Counterfeiting
Consumer goods recalls climbed 12% in North America during 2025, while automotive electronics recalls rose 8% in Europe, prompting tighter supplier audits.[4]Sedgwick, “2025 Recall Index,” sedgwick.com Counterfeit seizures in the European Union and the United States exceeded 2 million items, yet enforcement captures only a small fraction. Brand owners now stage factory-gate checks to confirm authenticity before goods enter e-commerce networks, a trend intensified by a 2026 infant-formula contamination incident highlighted by the World Health Organization.
Blockchain-Secured Digital Inspection Certificates
Bureau Veritas and Trade Technologies launched a ledger-based system that lets banks verify certificates instantly, shortening letter-of-credit cycles from days to minutes. Morocco hashes all conformity documents on PortNet, cutting disputes by 30%. Cold-chain insurer Parsyl links policy payouts to blockchain-anchored sensor data, proving value beyond customs use cases. Interoperability issues remain, yet early results show faster clearance and lower fraud.
Restraint Impact Analysis*
| Restraint | (~) % Impact on CAGR Forecast | Geographic Relevance | Impact Timeline |
|---|---|---|---|
| High Cost of Third-Party Inspections for SMEs | -0.6% | Global, acute in South America, Africa, and Southeast Asia | Short term (≤ 2 years) |
| Non-Uniform Global Inspection and Certification Regimes | -0.4% | Global, with friction at North America–European Union and Asia-Pacific–Middle East interfaces | Long term (≥ 4 years) |
| Cyber-Risk in Connected Inspection and Remote-Audit Tools | -0.2% | North America and European Union, with emerging exposure in Asia-Pacific hubs | Medium term (2-4 years) |
| Shortage of Skilled Inspectors During Peak Seasons | -0.2% | Asia-Pacific export corridors, with episodic constraints in North America and European Union | Short term (≤ 2 years) |
| Source: Mordor Intelligence | |||
High Cost of Third-Party Inspections for SMEs
Inspection fees ranging from USD 300 to USD 1 500 per visit erode thin export margins for small firms. Many pay spot rates and must pre-fund certificates before receiving bank credit, widening a cash-flow gap. Argentina’s Decreto 477/1997 imposes flat fees that raise per-unit costs for low-value consignments, pushing micro-exporters to seek expensive bridge loans. Limited trade-finance access in Africa and South America magnifies the burden.
Non-Uniform Global Inspection and Certification Regimes
Exporters often undergo duplicative tests because an ISO 17020 accreditation in one jurisdiction might not be recognized in another. The World Trade Organization’s Technical Barriers to Trade Committee met in March 2026 to address the rising patchwork of schemes that drive up compliance costs. Post-Brexit UKCA rules double inspection budgets for firms shipping to both the United Kingdom and the European Union. Morocco’s importer-led model added a new learning curve for suppliers unfamiliar with PortNet, highlighting how fragmentation persists despite digitization.
*Our forecasts treat driver/restraint impacts as directional, not additive. The impact forecasts reflect baseline growth, mix effects, and variable interactions.
Segment Analysis
By Sourcing Type: Outsourcing Dominates Cost-Reduction Strategies
Outsourced programs controlled 72.74% of the Pre-Shipment Inspection market share in 2025. This model is particularly advantageous for manufacturers of electronics, apparel, and industrial components, allowing them to sidestep capital expenditures on laboratories. By outsourcing, companies can focus on their core competencies while leveraging the expertise of specialized providers. The supply-chain volatility of 2025 further underscored the benefits of variable-cost contracts, which adjust according to order volume, offering flexibility and cost efficiency. However, in-house units retained their relevance in specific cases, particularly where intellectual property concerns restricted external access, ensuring sensitive information remained protected.
In 2026, Bureau Veritas integrated inspection data into a trade-finance platform, demonstrating that niche providers can validate hefty software investments for a vast clientele. This move highlighted the potential for technology to enhance operational efficiency and transparency in the Pre-Shipment Inspection process. Exporters in the Asia-Pacific region heavily rely on outsourced partners, considering them vital for maintaining operational flexibility and meeting fluctuating demand. This reliance not only propels the segment's growth at a 5.28% CAGR but also solidifies its foundational role in the overarching Pre-Shipment Inspection market. The increasing adoption of outsourced solutions in the region reflects a broader trend toward cost optimization and agility in global trade operations.


By Service Type: Blockchain Certification Outpaces Traditional Conformity
Product-conformity checks accounted for 38.19% of 2025 revenue, yet blockchain-anchored certificates are in the spotlight with a 5.55% CAGR. At the same time, blockchain-anchored certificates gained prominence, achieving a 5.55% CAGR. Traditional inspections, which ensure compliance by validating dimensions, labeling, and functionality, remain essential. Additionally, document verification continues to be mandatory for customs clearance, particularly in regions with high tariffs. The growing focus on cost efficiency led shippers to increasingly adopt container-loading supervision in 2025, aiming to optimize freight expenses and reduce logistical inefficiencies.
During-production audits have become indispensable for identifying defects early in the manufacturing process, especially for high-value or safety-critical goods. These audits help mitigate risks and ensure product quality before shipment. The International Air Transport Association reported 562 CEIV Pharma sites in 2025, all requiring rigorous temperature monitoring to maintain compliance with pharmaceutical standards. In early 2026, Morocco issued over 50,000 cryptographically signed certificates, showcasing the growing adoption of blockchain technology in trade processes. Furthermore, Bureau Veritas's collaboration with banks on ledger tie-ups reflects increasing trust in digital proofs, a trend poised to reshape service offerings in the Pre-Shipment Inspection market.
By Industry: Agriculture Accelerates on Traceability Mandates
Consumer goods and retail accounted for 29.73% of 2025 revenue, as apparel, footwear, and toys require visual-defect checks. These sectors rely heavily on pre-shipment inspections to ensure product quality and compliance with international standards. The agriculture and food sector, however, is projected to grow at the fastest rate, with a 5.31% CAGR, following the implementation of the FDA Traceability Rule in January 2026. This regulation requires lot-level documentation for every shipment entering the United States, making inspections mandatory. The rule aims to enhance traceability and safety in the food supply chain, driving significant growth in inspection activities. As a result, the agriculture and food sector is expected to play a pivotal role in the overall Pre-Shipment Inspection market.
India has introduced similar regulations for processed foods and additives, aligning its policies with global standards to ensure food safety and quality. Additionally, the Chile-United States fruit program highlights the importance of bilateral protocols in maintaining and boosting export momentum. This program has set an example of how collaborative efforts can streamline trade processes and ensure compliance with stringent inspection requirements. The rising inspection volumes for cold-chain perishables, spices, and confectionery have further contributed to the growth of the food sector within the Pre-Shipment Inspection market. Despite this increase, the consumer goods sector continues to maintain its significant share, demonstrating the balanced growth of both sectors in the market. This trend underscores the evolving dynamics of the Pre-Shipment Inspection market, driven by regulatory changes and international trade protocols.

By Shipment Mode: Air Cargo Gains on Perishable Corridors
Sea freight kept 64.62% share in 2025 because containerization remains cost-efficient for mass-market goods. This mode of transport continues to dominate global trade because of its ability to handle large volumes at lower costs compared to other methods. On the other hand, air cargo is projected to grow at a CAGR of 5.22% through 2031, driven by the increasing demand for faster delivery of high-value and time-sensitive goods. To address this demand, Swissport launched a 30,000-tonne perishables hub at Heathrow Airport, which includes a border inspection post. This facility underscores the growing need for rapid clearance processes, particularly for perishable items like flowers and seafood that require stringent handling and quick transit.
The International Air Transport Association (IATA) highlighted the critical role of temperature compliance in air freight, citing Colombian flower exports for Valentine’s Day 2026 as an example. These exports required strict temperature controls aboard freighters to ensure product quality during transit. While rail and road transport are gaining traction due to nearshoring trends, they primarily generate lower fees and exhibit modest growth. However, these modes lack the scale efficiencies and global reach offered by ocean and air freight networks, making them less competitive for large-scale or time-sensitive shipments.
Geography Analysis
Asia-Pacific produced 41.68% of 2025 global revenue, propelled by China’s machinery, India’s pharmaceuticals, and Vietnam’s fast-growing furniture sector. Export-oriented manufacturers here treat inspection as a cost of market entry, not a discretionary spend. Digital scheduling platforms and high inspector density allow same-day deployments, reinforcing regional dominance in the Pre-Shipment Inspection market.
The Middle East and Africa posts the quickest expansion at 5.16% CAGR to 2031. Morocco’s PortNet cut issuance times by 40% after mandating importer-led conformity checks. Kenya’s 2026 tender added nine accredited firms to enforce new rules. East African lab investments trimmed average certification cycles from 21 days in 2023 to 14 days in 2025, lowering non-tariff barriers and catalyzing trade flows within the African Continental Free Trade Area.
North America and Europe are mature zones where growth flows from regulatory updates such as the FDA traceability rule and European recycled-content directives. SGS deepened its U.S. footprint by buying Applied Technical Services for USD 1.325 billion, signaling confidence despite slower headline gains. South America remains steady, shaped by Argentina’s pre-shipment mandates and Chile’s long-running fruit program, although currency volatility tempers spending among exporters.

Competitive Landscape
Five global leaders, SGS, Bureau Veritas, Intertek, TÜV Rheinland, and DEKRA, command a majority of the Pre-Shipment Inspection market share. Accreditation to ISO 17020 and ISO 17065 is now table stakes, leading to margin pressure as smaller ISO-certified entrants match baseline offerings. Providers respond by adding artificial-intelligence defect detection, drone seal verification, and application-programming-interface connectivity that removes PDFs from trade workflows.
SGS purchased Applied Technical Services for USD 1.325 billion in January 2026, adding 85 North American sites and 2 100 staff. The deal strengthens SGS in the industrial and oil-and-gas verticals, where proximity and deep materials know-how command premium pricing. Bureau Veritas chose partnership over acquisition, embedding inspection data into bank platforms via Trade Technologies to automate letter-of-credit release.
Regionally focused players such as QIMA, HQTS, and V-Trust undercut legacy rates and promise 48-hour digital reports, eroding incumbent pricing in Asia-Pacific. Technology adoption sets the competitive frontier; the World Trade Organization debates on mutual-recognition agreements could either open doors for agile newcomers or fortify entrenched giants if cross-border standards align with existing accreditation portfolios.
Pre-Shipment Inspection Industry Leaders
SGS SA
Bureau Veritas SA
Intertek Group plc
TÜV SÜD AG
TÜV Rheinland AG
- *Disclaimer: Major Players sorted in no particular order

Recent Industry Developments
- March 2026: Bureau Veritas partnered with Trade Technologies to launch blockchain-based inspection certificates that link directly into trade-finance workflows.
- February 2026: The Chile–United States fresh-fruit pre-shipment program was renewed, facilitating more than 850 000 tonnes of cherries, grapes, and stone fruit in the 2025-2026 season.
- February 2026: Kenya Bureau of Standards awarded pre-export verification contracts to nine inspection firms to cover electrical appliances, textiles, and automotive parts.
- January 2026: The United States Food and Drug Administration’s Food Safety Modernization Act traceability rule became enforceable, mandating lot-level certificates for high-risk produce.


Global Pre-Shipment Inspection Market Report Scope
The Pre-Shipment Inspection Market covers services used to verify the quality, quantity, packaging, labeling, and compliance of goods before they are shipped to buyers. It is a key part of supply chain quality control and helps ensure that products meet contractual, regulatory, and customer specifications before export or delivery. Demand is driven by expanding global trade, stricter import-export regulations, and the need to reduce recalls, disputes, and non-compliance risks.
The Pre-Shipment Inspection Market Report is Segmented by Sourcing Type (In-House, Outsourced), Service Type (Product Conformity Inspection, Document Verification and Compliance Review, Container Loading and Stuffing Supervision, During-Production Inspection), Industry (Consumer Goods and Retail, Industrial and Manufacturing, Agriculture and Food, Oil Gas and Petrochemicals, Other Industry), Shipment Mode (Sea, Air, Road and Rail), and Geography (North America, Europe, Asia-Pacific, Middle East and Africa, South America). The Market Forecasts are Provided in Terms of Value (USD).
| In-House |
| Outsourced |
| Product Conformity Inspection |
| Document Verification and Compliance Review |
| Container Loading / Stuffing Supervision |
| During-Production Inspection (DUPRO) |
| Consumer Goods and Retail |
| Industrial and Manufacturing |
| Agriculture and Food |
| Oil, Gas and Petrochemicals |
| Other Industry |
| Sea |
| Air |
| Road / Rail |
| North America | United States |
| Canada | |
| Mexico | |
| Europe | Germany |
| United Kingdom | |
| France | |
| Italy | |
| Rest of Europe | |
| Asia-Pacific | China |
| Japan | |
| India | |
| South Korea | |
| Australia | |
| Rest of Asia-Pacific | |
| South America | |
| Middle East and Africa |
| By Sourcing Type | In-House | |
| Outsourced | ||
| By Service Type | Product Conformity Inspection | |
| Document Verification and Compliance Review | ||
| Container Loading / Stuffing Supervision | ||
| During-Production Inspection (DUPRO) | ||
| By Industry | Consumer Goods and Retail | |
| Industrial and Manufacturing | ||
| Agriculture and Food | ||
| Oil, Gas and Petrochemicals | ||
| Other Industry | ||
| By Shipment Mode | Sea | |
| Air | ||
| Road / Rail | ||
| By Geography | North America | United States |
| Canada | ||
| Mexico | ||
| Europe | Germany | |
| United Kingdom | ||
| France | ||
| Italy | ||
| Rest of Europe | ||
| Asia-Pacific | China | |
| Japan | ||
| India | ||
| South Korea | ||
| Australia | ||
| Rest of Asia-Pacific | ||
| South America | ||
| Middle East and Africa | ||


Key Questions Answered in the Report
What is the projected value of the Pre-Shipment Inspection market by 2031?
The sector is forecast to reach USD 22.06 billion by 2031.
Which sourcing model leads current demand?
Outsourced inspection services held 72.74% share in 2025 and remain the dominant model.
Why is agriculture inspection growing fastest?
New traceability mandates in the United States, India, and the European Union are turning pre-shipment checks into a compliance requirement, driving agriculture at a 5.31% CAGR.
Which region offers the highest growth outlook?
Middle East and Africa is set to expand at 5.16% CAGR through 2031, supported by new conformity programs and large infrastructure imports.
How are digital certificates changing inspection workflows?
Blockchain-based documentation enables banks and customs authorities to verify cargo in real time, reducing clearance and payment cycles from days to minutes.
What strategic move did SGS execute in 2026?
SGS acquired Applied Technical Services for USD 1.325 billion to expand North American presence and strengthen industrial testing capabilities.
Page last updated on:


