Baggage Scanners Market Size and Share
Market Overview
| Study Period | 2020 - 2031 |
|---|---|
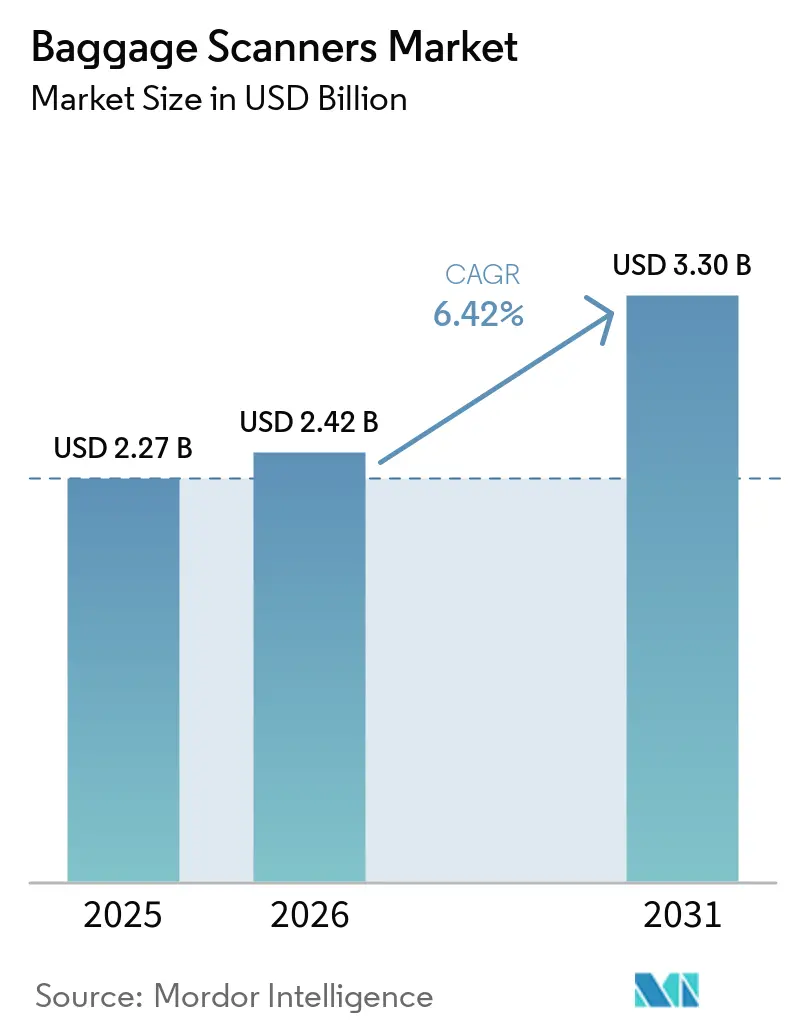
| Market Size (2026) | USD 2.42 Billion |
| Market Size (2031) | USD 3.30 Billion |
| Growth Rate (2026 - 2031) | 6.42% CAGR |
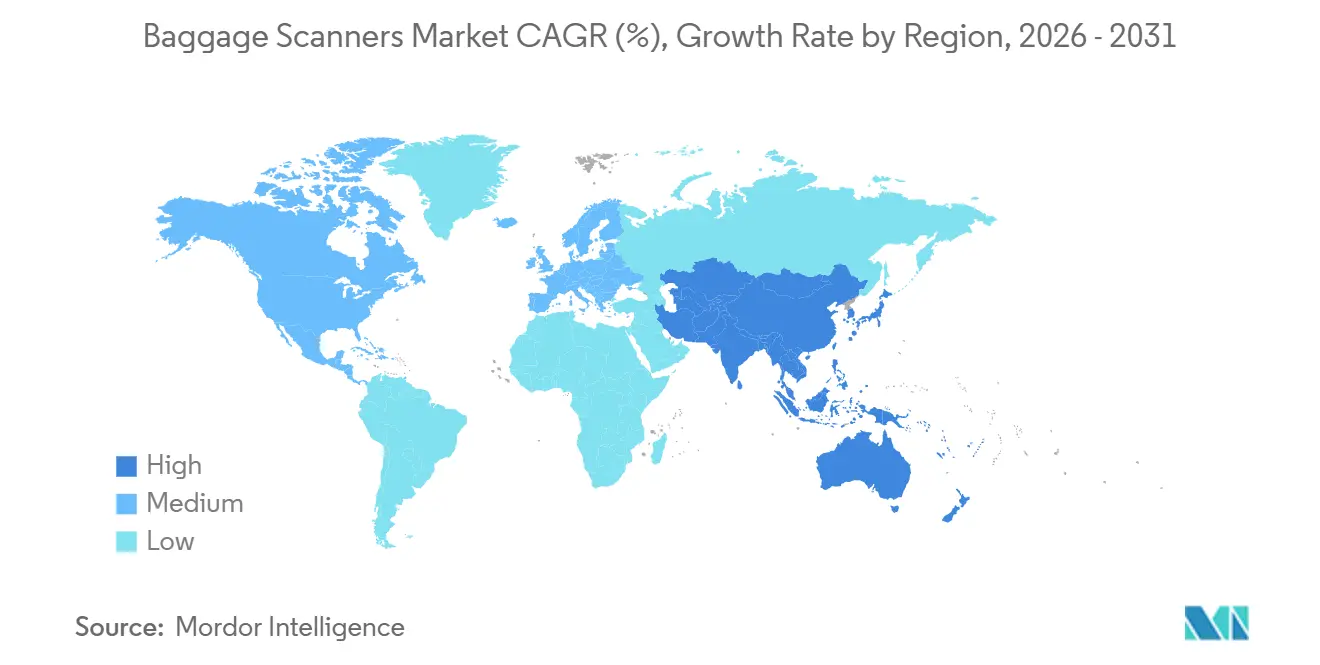
| Fastest Growing Market | Asia-Pacific |
| Largest Market | North America |
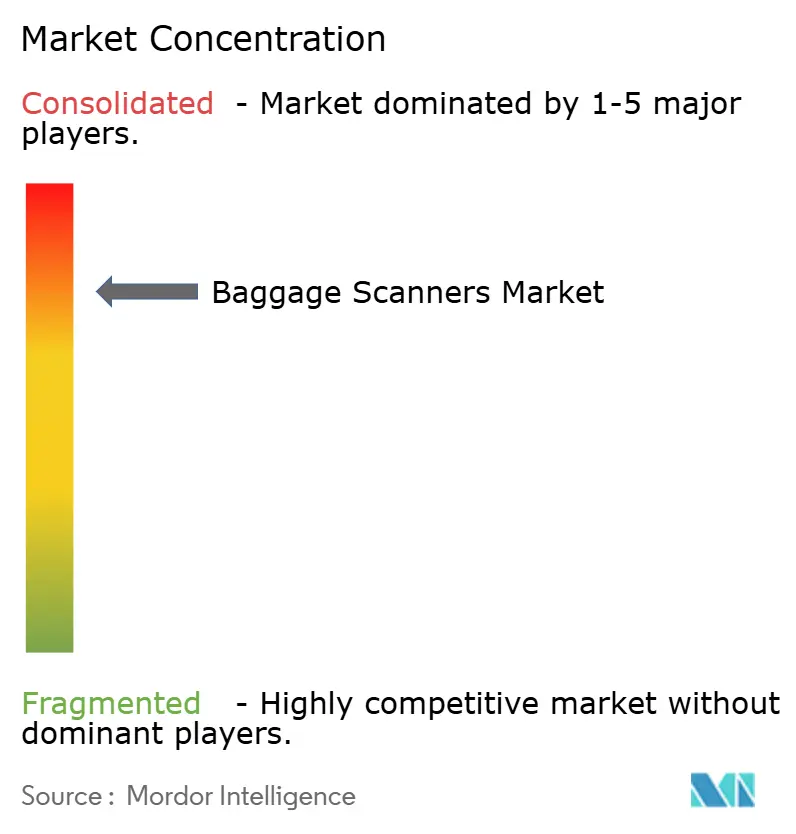
| Market Concentration | High |
Major Players *Disclaimer: Major Players sorted in no particular order Image © Mordor Intelligence. Reuse requires attribution under CC BY 4.0. | |
Baggage Scanners Market Analysis by Mordor Intelligence
The baggage scanners market size is expected to grow from USD 2.27 billion in 2025 to USD 2.42 billion in 2026 and is forecast to reach USD 3.30 billion by 2031 at 6.42% CAGR over 2026-2031. Growing passenger throughput, mandatory computed-tomography (CT) upgrades, and e-commerce-driven parcel flows are widening the revenue base. Airports remain the anchor buyer group, but logistics hubs, metro stations, and border agencies are accelerating procurement cycles as they pivot to AI-enabled, high-throughput lines. Competitive pressure from lower-priced Chinese turnkey CT platforms is forcing Western incumbents to bundle software and multi-year services to defend installed bases. Regionally, North America benefits from the Transportation Security Administration’s multi-billion-dollar CT rollout, while Asia-Pacific supplies the steepest incremental demand curve as India, China, and Gulf states funnel airport and metro construction budgets into security infrastructure.
Key Report Takeaways
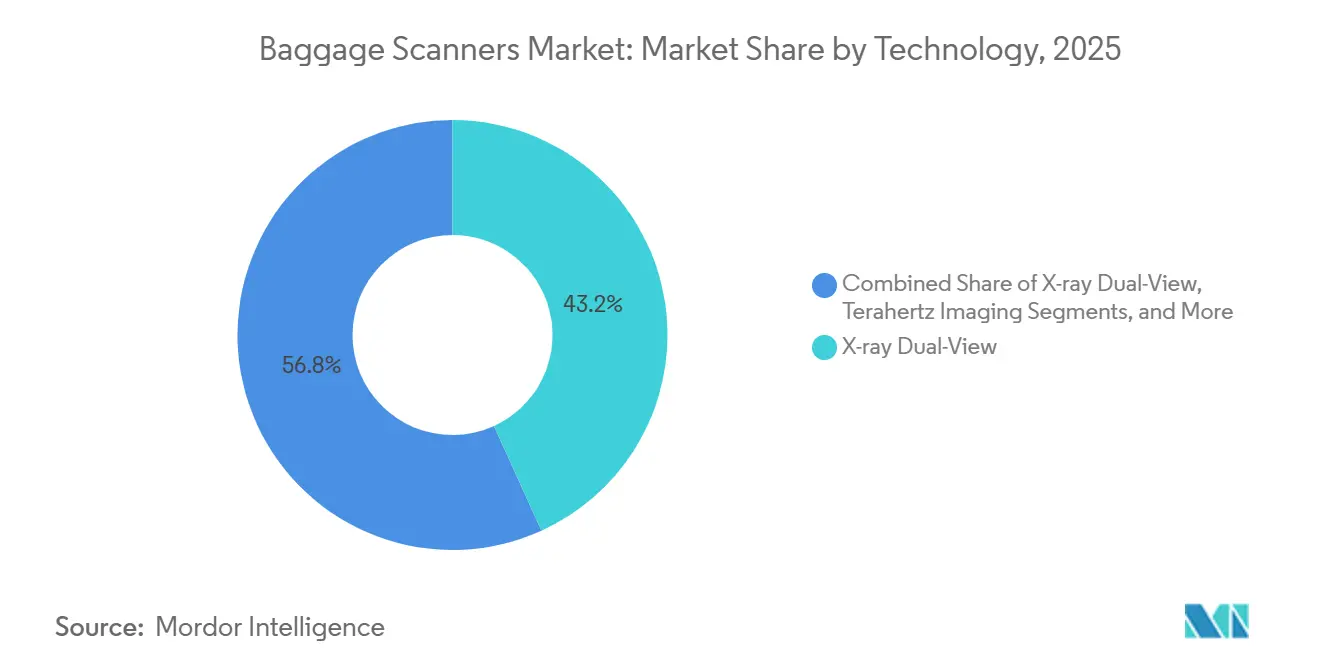
- By technology, X-ray dual-view systems led with 43.21% of baggage scanners market share in 2025, whereas computed tomography is projected to expand at a 7.85% CAGR to 2031.
- By tunnel geometry, 50-100 cm units commanded 48.25% of baggage scanners market share in 2025, and mobile cabinets are advancing at a 7.70% CAGR through 2031.
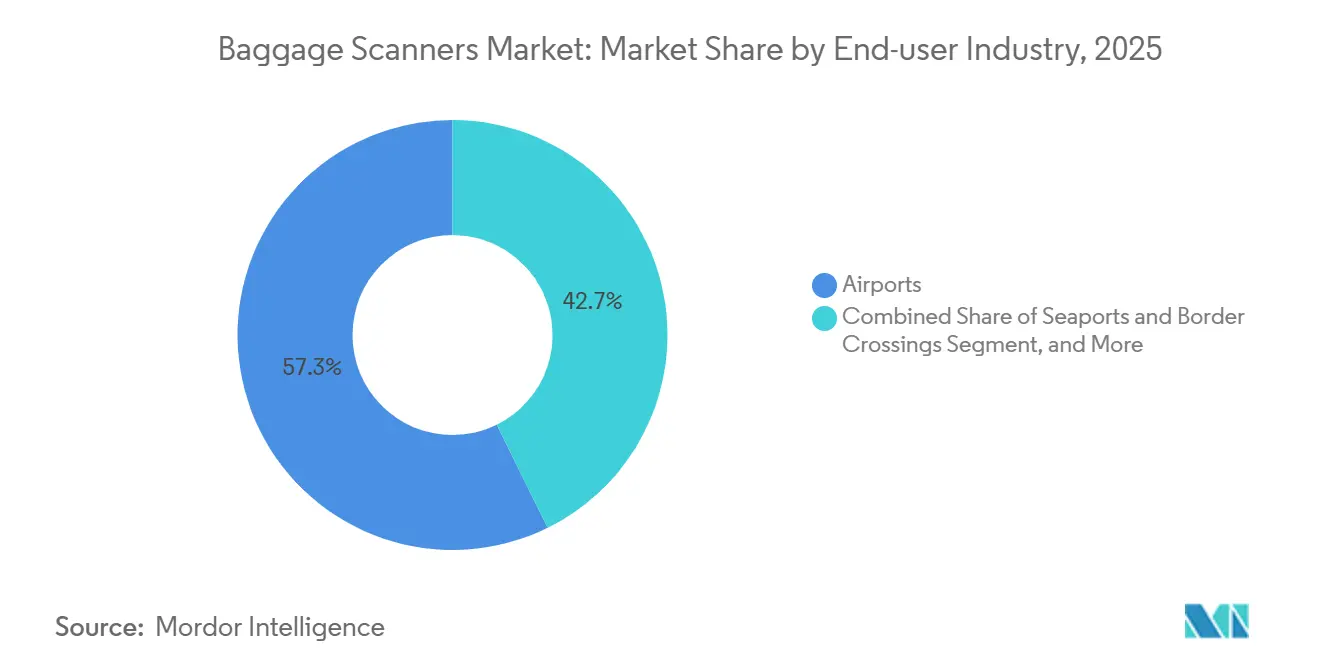
- By end-user, airports accounted for 57.31% of baggage scanners market share in 2025, while logistics and parcel facilities are forecast to be the fastest-growing segment at 6.78% CAGR during 2026-2031.
- By mobility, fixed systems dominated with an 84.18% of baggage scanners market share in 2025, yet portable and mobile systems are tracking a 6.91% CAGR through 2031.
- By geography, North America held a 32.22% of baggage scanners market share in 2025, and Asia-Pacific is expected to record the highest regional growth at 7.55% CAGR to 2031.
Note: Market size and forecast figures in this report are generated using Mordor Intelligence’s proprietary estimation framework, updated with the latest available data and insights as of January 2026.
Global Baggage Scanners Market Trends and Insights
Drivers Impact Analysis*
| Driver | (~) % Impact on CAGR Forecast | Geographic Relevance | Impact Timeline |
|---|---|---|---|
| Increasing Passenger Throughput At Major Airports | +1.2% | Global, led by Asia-Pacific and Middle East | Medium term (2–4 years) |
| Mandatory Adoption Of Advanced Imaging Technologies | +1.5% | North America, Europe, Middle East, spill-over to Asia-Pacific | Short term (≤ 2 years) |
| Expansion Of E-Commerce Logistics Hubs | +0.9% | Global, concentrated in North America, Europe, China | Medium term (2–4 years) |
| Modernization Of Rail And Metro Stations | +0.8% | Asia-Pacific core, spill-over to Middle East and Africa | Long term (≥ 4 years) |
| Integration Of Artificial Intelligence For Automated Threat Recognition | +0.7% | Global, early adoption in North America and Europe | Short term (≤ 2 years) |
| Rising Deployment Of Compact Mobile Scanners For Event Security | +0.5% | Global, early gains in North America, Europe, select Middle East | Medium term (2–4 years) |
| Source: Mordor Intelligence | |||
Increasing Passenger Throughput At Major Airports
Hub-airport expansion programs are underpinning long-run demand. Dubai International’s installation of 140 CT lanes, Mumbai’s USD 1 billion Terminal 1 redevelopment, and India’s directive for 600 hand-baggage scanners exemplify capacity locks that extend replacement cycles well into the next decade. Mega-projects in Saudi Arabia and the United Arab Emirates embed AI-enabled lanes from day one, giving vendors visibility on multiyear order pipelines.[1]GACA Information Center, “King Salman International Airport Development Plan,” gaca.gov.sa
Mandatory Adoption Of Advanced Imaging Technologies
Regulatory mandates compress adoption curves. The Transportation Security Administration’s USD 2.6 billion award to Leidos for 12,000 credential-authentication and explosives-trace units, plus CT lanes, anchors U.S. demand, while the European Civil Aviation Conference Standard 3 positions CT as the de facto cabin-baggage benchmark. Heathrow’s GBP 1 billion (USD 1.27 billion) CT retrofit removes the 100 milliliter liquid limit, catalyzing copy-cat projects across European hubs.
Expansion Of E-Commerce Logistics Hubs
Express carriers are embedding high-capacity tunnels into sorting centers that process tens of thousands of parcels per hour. FedEx’s Memphis Secondary 25 facility runs a six-sided belt scanner at 56,000 packages per hour, and DHL Express Australia integrates dual-energy systems tied to centralized image review, proving the labor-savings thesis that logistics operators use to justify capital spend.
Modernization Of Rail And Metro Stations
India’s Delhi Metro, Chennai Metro, and Kolkata Metro have swapped legacy single-view units for AI-ready dual-energy scanners, cutting false alarms by almost one-third. China’s high-speed rail nodes show similar patterns, as Nanchang Metro reports a 30% increase in throughput after switching to domestic dual-view lines.
Restraints Impact Analysis*
| Restraint | (~) % Impact on CAGR Forecast | Geographic Relevance | Impact Timeline |
|---|---|---|---|
| High Capital Expenditure And Long Procurement Cycles | -0.8% | Global, acute in emerging markets and small regional airports | Medium term (2–4 years) |
| Stringent Data-Privacy Concerns Over 3D Imaging Storage | -0.4% | Europe, North America, spill-over to Asia-Pacific | Short term (≤ 2 years) |
| Limited Infrastructure Funding At Small Regional Airports | -0.3% | Africa, South America, select Asia-Pacific | Long term (≥ 4 years) |
| Supply-Chain Bottlenecks In Specialty X-Ray Components | -0.5% | Global, concentrated impact in North America and Europe | Short term (≤ 2 years) |
| Source: Mordor Intelligence | |||
High Capital Expenditure And Long Procurement Cycles
CT scanners cost two to three times as much as dual-view units, pushing the return-on-investment horizon farther out for smaller airports. Tender processes in Africa, South America, and secondary Indian metros often exceed 18 months as buyers juggle donor conditions, currency hedges, and local-content clauses, delaying capacity even where throughput is rising.
Stringent Data-Privacy Concerns Over 3D Imaging Storage
The European Data Protection Board’s Opinion 11/2024 forbids centralized storage of biometric templates, obligating on-device processing. Vendors must redesign platforms to comply with General Data Protection Regulation and similar Canadian privacy rules, adding 10-15% to total ownership costs and forcing airports to weigh compliance premiums against passenger-flow benefits.[2]European Data Protection Board, “Opinion 11/2024 on Biometric Template Storage,” edpb.europa.eu
*Our forecasts treat driver/restraint impacts as directional, not additive. The impact forecasts reflect baseline growth, mix effects, and variable interactions.
Segment Analysis
By Technology: CT Platforms Accelerate As Liquid Bans Lift
Computed tomography captured momentum in 2025 and is on track for a 7.85% CAGR during 2026-2031, led by U.S., European, and Gulf regulators permitting passengers to keep electronics and liquids in their bags. The baggage scanners market size for CT platforms is projected to expand sharply as TSA, Heathrow, and Dubai Airports standardize volumetric imaging. Dual-view X-ray systems retained a 43.21% hold because secondary airports, rail stations, and parcel centers value lower capex and established operator familiarity.
Dual-view’s entrenched base anchors upgrade services, yet its share erodes where AI engines require richer data streams. Single-view remains confined to mail rooms. Millimeter-wave and terahertz imaging are attracting attention as non-ionizing alternatives compliant with European passenger-screening rules, but component costs and performance standards keep them niche. Smiths Detection’s SDX 10080 SCT cargo CT and Leidos-Quadridox diffraction partnership illustrates the race to stretch CT into freight lanes, opening new monetization layers.[4]Leidos, “Leidos-Quadridox Advanced Threat Detection Partnership,” leidos.com


By Scanner Geometry: Medium Tunnels Dominate, Cabinet Units Surge
Scanners with 50-100 cm openings captured 48.25% share in 2025 due to alignment with International Air Transport Association cabin-bag limits. The baggage scanners market share for mobile cabinet and stand-alone systems will grow rapidly at a 7.70% CAGR, as border posts and event venues prefer compact devices that fit in standard vans. Tunnels less than 50 cm remain relevant for mail and e-commerce parcels, while gantries greater than 100 cm serve seaport and air-freight pallets.
Medium-tunnel CT systems form the heart of TSA’s and Heathrow’s checkpoint conversions, signaling production scale-up. Mobile cabinets embed AI analytics and can be fielded within hours, extending the vendor's value proposition from hardware to logistics services. Oversized cargo scanners, though lower in unit volume, carry premium pricing tied to container-radiography specifications.
By End-User Industry: Logistics Outpaces Aviation Hubs
Airports accounted for 57.31% revenue in 2025 and still anchor absolute demand. Yet logistics and parcel facilities, growing at a 6.78% CAGR to 2031, now shape vendor roadmaps. Customs pre-clearance rules, lithium-battery restrictions, and duty-free time windows push express carriers toward integrated scan-and-sort lines that marry dual-energy detectors with machine-learning classifiers. Seaports and border crossings are adopting drive-through or gantry CT to comply with 100%-container directives, as seen in Cameroon’s Douala Port investment of CFA 192.9 billion (USD 320 million).
Rail and metro operators in India and China are leapfrogging single-view systems to dual-energy systems, compressing refresh cycles. Government buildings and courthouses purchase sporadically, while hotels and venues adopt portable scanners during high-risk events. For vendors, parcel hubs and metros offer a steady annuity, as equipment cycles are shorter and AI software licensing generates recurring revenue.
By Mobility: Portable Systems Take Hold At Remote Borders And Events
Fixed installations commanded 84.18% market share in 2025, reflecting certification pathways at airports. Portable units, however, are forecast to grow at a 6.91% CAGR owing to users in customs, the military, and event security. Deployments such as Moldova’s USD 2.93 million Rapiscan Eagle M-60 trailer and Costa Rica’s 12-unit mobile fleet illustrate demand for rapid-setup solutions where permanent infrastructure is impractical.
Performance gaps narrow as solid-state detectors and battery technology mature. Vendors bundle ruggedized enclosures plus cloud-agnostic AI, giving agencies agile assets to chase shifting smuggling routes. Hybrid fixed-portable configurations piloted at San Ysidro land crossing hint at broader adoption once regulatory evaluations conclude.
Geography Analysis
North America retained a 32.22% hold in 2025 as the TSA installed 634 CT units and inked a USD 2.6 billion Leidos contract that secures replacement demand through 2033. Canada pilots CT at Toronto Pearson and Vancouver, and U.S. Customs and Border Protection awarded OSI Systems USD 54 million for CertScan drive-through lanes. Mexico, with constrained federal budgets, leans on redeployable portals, giving portable-system vendors an entry point.
Asia-Pacific is the fastest-growing region, with a 7.55% CAGR through 2031. India’s Bureau of Civil Aviation Security earmarked INR 1,000 crore (USD 120 million) for 600 baggage units, and metro projects in Delhi, Chennai, and Kolkata specified AI-ready scanners.[5]Bureau of Civil Aviation Security, “Mandate for 600 Hand-Baggage Scanners,” bcasindia.gov.in China’s rail upgrades deploy domestic dual-view lines, and Airports Council International surveys indicate CT adoption will double in three years. Southeast Asia and Gulf airports, backed by USD 183 billion in planned capital, further swell the order book.
Europe’s CT momentum coexists with stringent privacy mandates that slow the adoption of full-body scanners. Heathrow’s GBP 1 billion (USD 1.27 billion) retrofit leads, while smaller states prioritize border-security portals such as Estonia’s EUR 3.1 million (USD 3.31 million) Rapiscan Argos. The Middle East channels mega-airport budgets into volumetric imaging, whereas sub-Saharan Africa’s capital gaps slow refresh cycles, limiting near-term penetration. South America exhibits episodic buys, typified by Chile’s CLP 3.2 billion (USD 3.54 million) Nuctech mobile trailer and Brazil’s pilot CT lanes at Guarulhos, where fiscal austerity lengthens tender timelines.

Competitive Landscape
Smiths Detection, OSI Systems, and Nuctech hold significant market share, yet the field is widening as Chinese turnkey CT packages undercut price benchmarks by up to 40%. Western incumbents respond with analytics subscriptions, predictive maintenance, and bundled multiyear agreements, locking in annuity streams. Smiths Detection’s Heathrow award, OSI Systems’ CBP contract, and Nuctech’s border-agency wins show divergent regional strongholds.[6]OSI Systems, “USD 54 Million U.S. Customs and Border Protection CertScan Award,” osi-systems.com
Technology roadmaps revolve around AI threat recognition, certified by the Transportation Security Administration and the European Civil Aviation Conference. Partnerships, such as Leidos with Quadridox for diffraction-enhanced CT, signal a shift toward multimodal material identification that may reset detection baselines. Millimeter-wave and terahertz prototypes remain pre-commercial, but vendors that are accumulating intellectual property claims stand to influence future regulatory specifications.
Compliance segmentation adds complexity. European units require on-device image anonymization to comply with the General Data Protection Regulation, while China and India mandate domestic data localization. Vendors with cloud-agnostic architectures and distributed analytics can amortize development across multiple jurisdictions, elevating software to a differentiator on par with detector resolution. Mid-tier firms fill niche gaps, VOTI Detection in cargo, Astrophysics in compact tunnels, and securing footholds where incumbents focus on high-volume CT lines.
Baggage Scanners Industry Leaders
Smiths Group plc
OSI Systems Inc.
Nuctech Company Limited
Leidos Holdings Inc.
Astrophysics Inc.
- *Disclaimer: Major Players sorted in no particular order

Recent Industry Developments
- February 2026: Smiths Detection secured a multi-year contract valued at more than GBP 1 billion (USD 1.27 billion) with London Heathrow Airport to deploy HI-SCAN 6040 CTiX units, eliminating the 100 milliliter liquid limit.
- January 2026: Douala Port, Cameroon, commissioned eight scanners as part of a CFA 192.9 billion (USD 320 million) upgrade to achieve 100% container screening.
- December 2025: Dnata opened a smart cargo-screening hub at Dubai International Airport with six X-ray lines compliant with Annex 17 of the International Civil Aviation Organization.
- November 2025: Leidos partnered with Quadridox to fuse CT with X-ray diffraction for material-specific detection.
- September 2025: OSI Systems received a USD 54 million award from U.S. Customs and Border Protection for CertScan cargo portals.


Global Baggage Scanners Market Report Scope
The Baggage Scanners Market Report is Segmented by Technology (X-ray Single-View, X-ray Dual-View, Computed Tomography, Millimeter-wave Imaging, and Terahertz Imaging), Scanner Geometry (Less than 50 cm Tunnel, 50-100 cm Tunnel, Greater than 100 cm Tunnel, and Mobile Cabinet/Stand-alone), End-user Industry (Airports, Seaports and Border Crossings, Railway and Metro Stations, Logistics and Parcel Facilities, Government Buildings and Courthouses, and Hotels, Malls and Public Venues), Mobility (Fixed Systems, and Portable/Mobile Systems), and Geography (North America, Europe, Asia-Pacific, Middle East, Africa, and South America). The Market Forecasts are Provided in Terms of Value (USD).
| X-ray Single-View |
| X-ray Dual-View |
| Computed Tomography (CT) |
| Millimeter-wave Imaging |
| Terahertz Imaging |
| Less than 50 cm Tunnel (Small Parcel) |
| 50-100 cm Tunnel (Medium Baggage) |
| Greater than 100 cm Tunnel (Large Baggage) |
| Mobile Cabinet / Stand-alone |
| Airports |
| Seaports and Border Crossings |
| Railway and Metro Stations |
| Logistics and Parcel Facilities |
| Government Buildings and Courthouses |
| Hotels, Malls and Public Venues |
| Fixed Systems |
| Portable / Mobile Systems |
| North America | United States |
| Canada | |
| Mexico | |
| Europe | United Kingdom |
| Germany | |
| France | |
| Italy | |
| Rest of Europe | |
| Asia-Pacific | China |
| Japan | |
| India | |
| South Korea | |
| Rest of Asia-Pacific | |
| Middle East | Saudi Arabia |
| United Arab Emirates | |
| Rest of Middle East | |
| Africa | South Africa |
| Egypt | |
| Rest of Africa | |
| South America | Brazil |
| Argentina | |
| Rest of South America |
| By Technology | X-ray Single-View | |
| X-ray Dual-View | ||
| Computed Tomography (CT) | ||
| Millimeter-wave Imaging | ||
| Terahertz Imaging | ||
| By Scanner Geometry | Less than 50 cm Tunnel (Small Parcel) | |
| 50-100 cm Tunnel (Medium Baggage) | ||
| Greater than 100 cm Tunnel (Large Baggage) | ||
| Mobile Cabinet / Stand-alone | ||
| By End-user Industry | Airports | |
| Seaports and Border Crossings | ||
| Railway and Metro Stations | ||
| Logistics and Parcel Facilities | ||
| Government Buildings and Courthouses | ||
| Hotels, Malls and Public Venues | ||
| By Mobility | Fixed Systems | |
| Portable / Mobile Systems | ||
| By Geography | North America | United States |
| Canada | ||
| Mexico | ||
| Europe | United Kingdom | |
| Germany | ||
| France | ||
| Italy | ||
| Rest of Europe | ||
| Asia-Pacific | China | |
| Japan | ||
| India | ||
| South Korea | ||
| Rest of Asia-Pacific | ||
| Middle East | Saudi Arabia | |
| United Arab Emirates | ||
| Rest of Middle East | ||
| Africa | South Africa | |
| Egypt | ||
| Rest of Africa | ||
| South America | Brazil | |
| Argentina | ||
| Rest of South America | ||


Key Questions Answered in the Report
What is the current size of the baggage scanners market and its forecast growth through 2031?
The baggage scanners market size stands at USD 2.42 billion in 2026 and is projected to reach USD 3.30 billion by 2031, reflecting a 6.42% CAGR.
Which technology segment will experience the fastest growth?
Computed tomography platforms lead technology growth with a projected 7.85% CAGR during 2026-2031 as regulators lift liquid and laptop removal rules.
Which end-user group is expanding the quickest?
Logistics and parcel facilities are forecast to grow at 6.78% CAGR, outpacing airports due to e-commerce parcel surges.
What regional market offers the highest growth opportunity?
Asia-Pacific is expected to advance at 7.55% CAGR through 2031 as India, China, and Gulf states fund metro and airport expansions.
How are vendors defending market share against lower-priced competitors?
Western incumbents bundle AI-driven analytics, predictive maintenance, and multiyear service agreements to counter Chinese turnkey CT platforms 30-40% price discounts.
What are the main regulatory trends shaping future demand?
Mandatory CT adoption under European Civil Aviation Conference Standard 3 and Transportation Security Administration directives, plus stricter data-privacy rules requiring on-device image processing, are steering procurement specifications worldwide.
Page last updated on:


