Vehicle Scanner Market Size and Share
Market Overview
| Study Period | 2020 - 2031 |
|---|---|
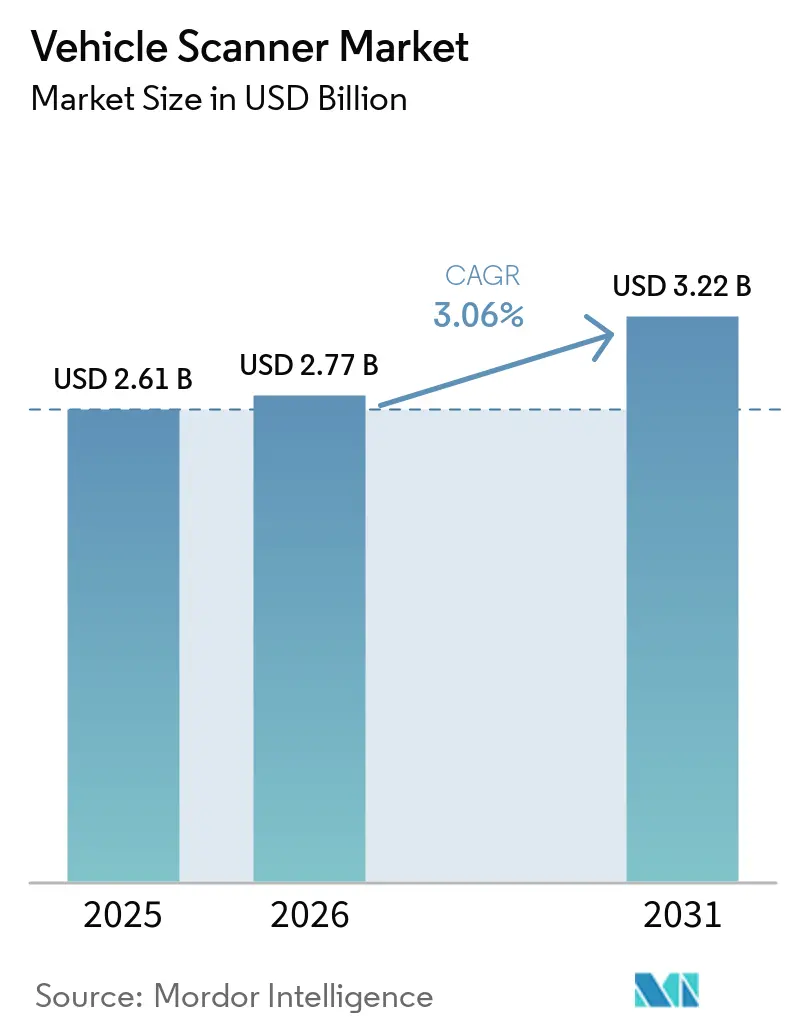
| Market Size (2026) | USD 2.77 Billion |
| Market Size (2031) | USD 3.22 Billion |
| Growth Rate (2026 - 2031) | 3.06% CAGR |
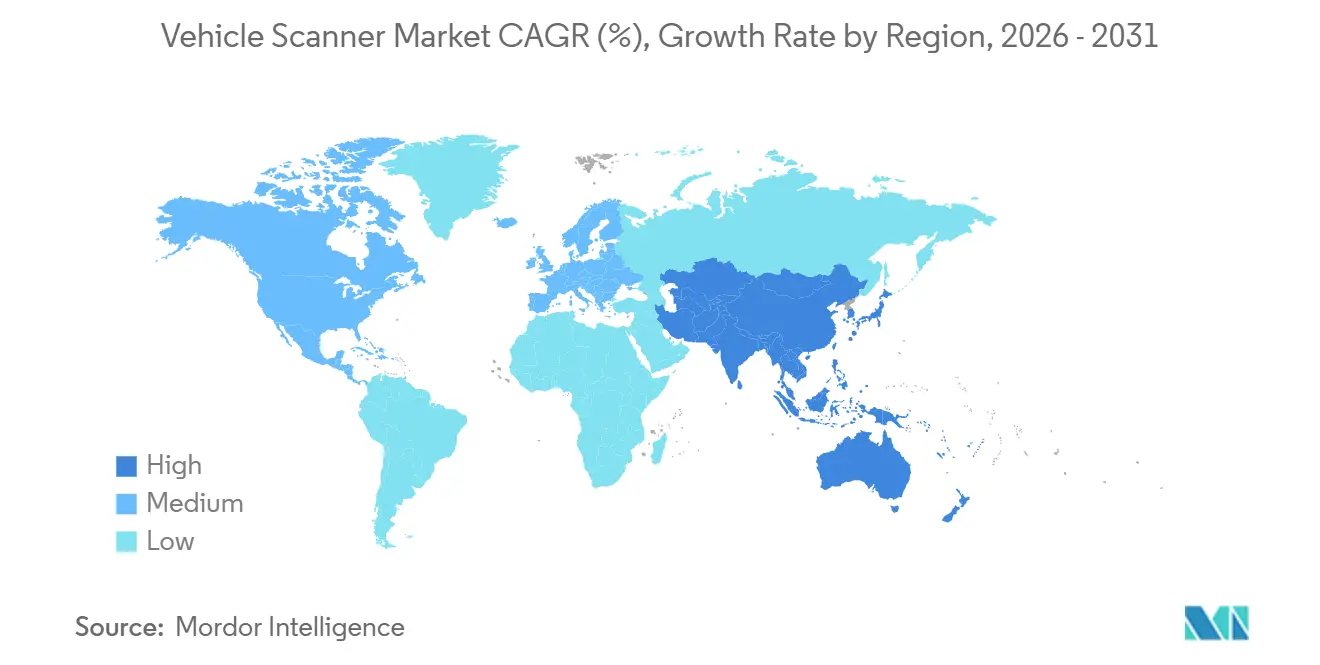
| Fastest Growing Market | Asia Pacific |
| Largest Market | North America |
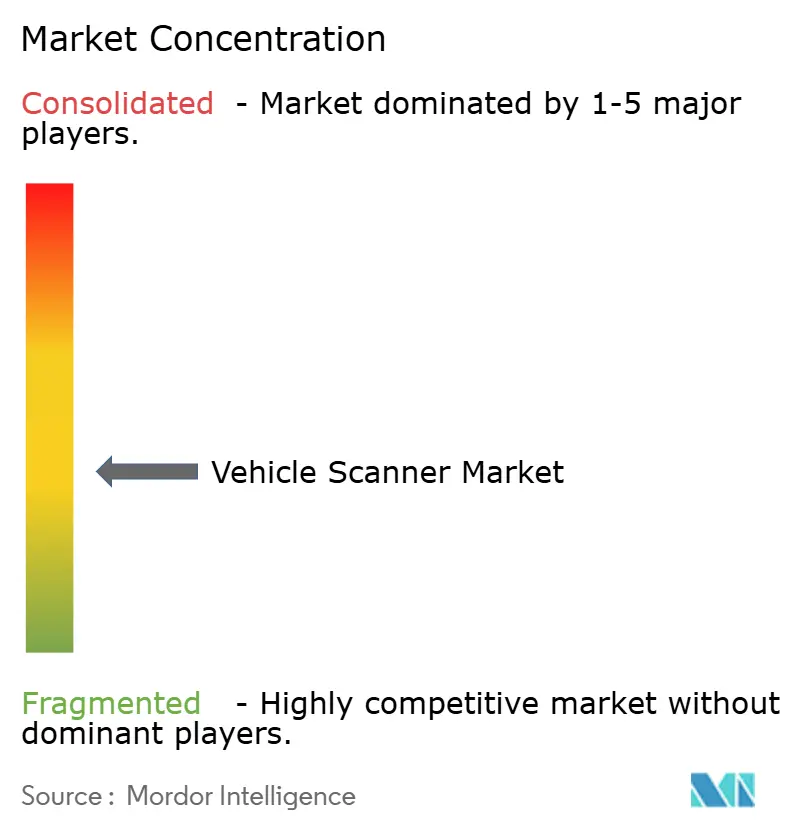
| Market Concentration | Medium |
Major Players *Disclaimer: Major Players sorted in no particular order Image © Mordor Intelligence. Reuse requires attribution under CC BY 4.0. | |
Vehicle Scanner Market Analysis by Mordor Intelligence
The vehicle scanner market size was valued at USD 2.61 billion in 2025 and is estimated to grow from USD 2.77 billion in 2026 to reach USD 3.22 billion by 2031, at a CAGR of 3.06% during the forecast period (2026-2031). Rising global trade flows, port-security mandates, and software-defined imaging platforms are reshaping procurement cycles. Fixed gantries still anchor permanent border crossings, yet demand is pivoting to mobile units that can be redeployed as threat patterns change. Technology choice is also shifting: non-ionizing millimeter-wave systems are gaining favor over backscatter X-ray as operators look to eliminate cumulative-dose concerns. Regional growth is led by Asia-Pacific, where smart gate initiatives and large-scale AI projects now match the installed-base maturity long associated with North America.
Key Report Takeaways
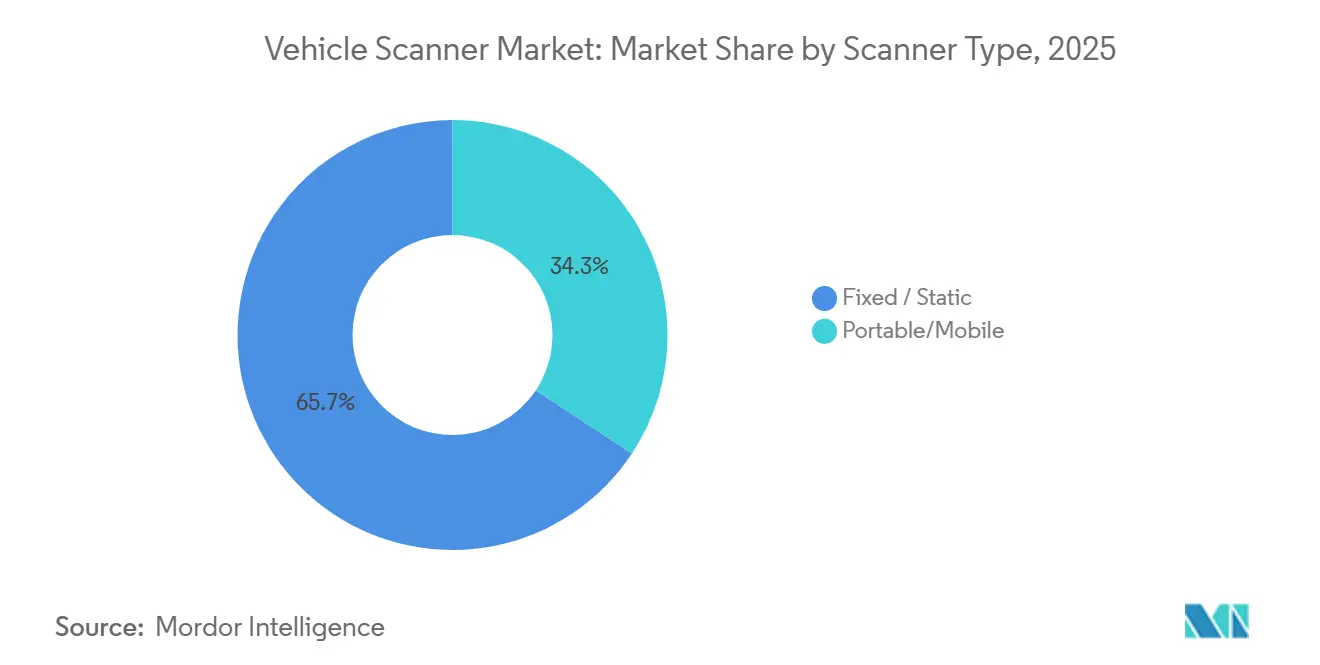
- By scanner type, fixed units held 65.71% of the vehicle scanner market share in 2025; portable models are projected to expand at a 3.78% CAGR through 2031.
- By structure type, drive-through portals led with a 52.54% of the vehicle scanner market share in 2025, while under-vehicle surveillance systems are advancing at a 3.55% CAGR to 2031.
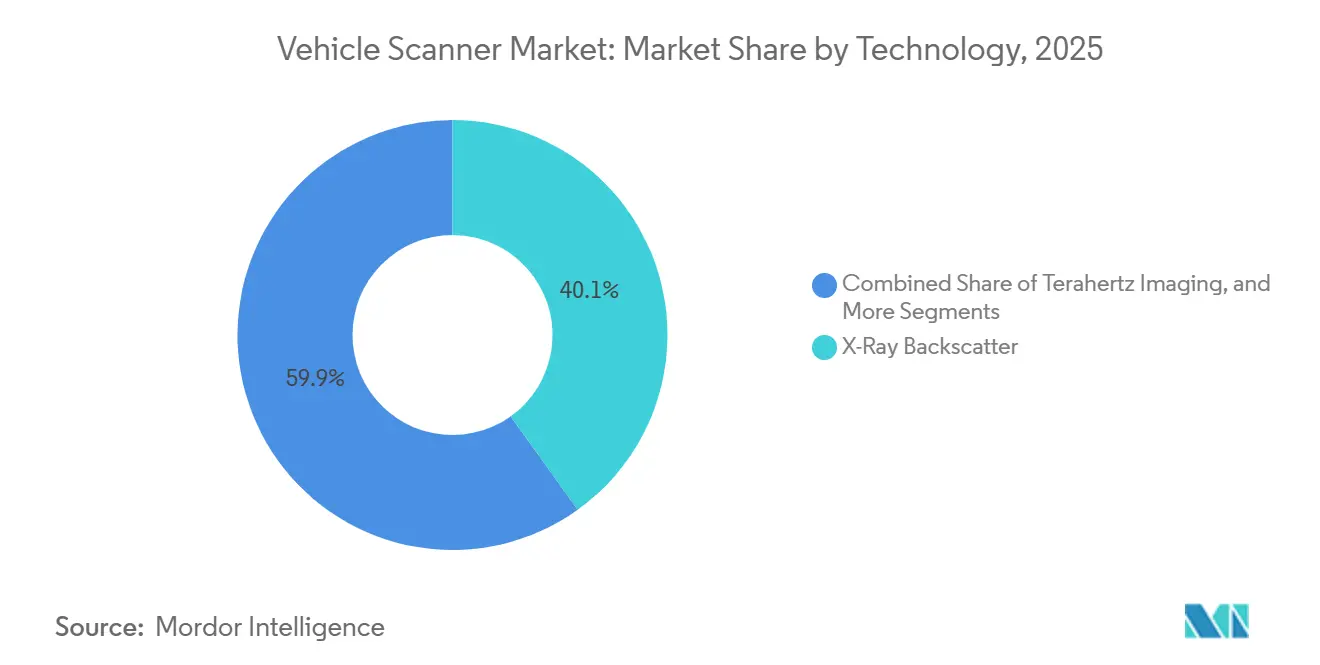
- By technology, X-ray backscatter accounted for 40.11% of the vehicle scanner market share in 2025; millimeter-wave imaging is forecast to post the fastest growth at 3.98% CAGR.
- By component, cameras held 35.05% of the vehicle scanner market share in 2025, whereas software subscriptions are projected to rise at a 3.86% CAGR.
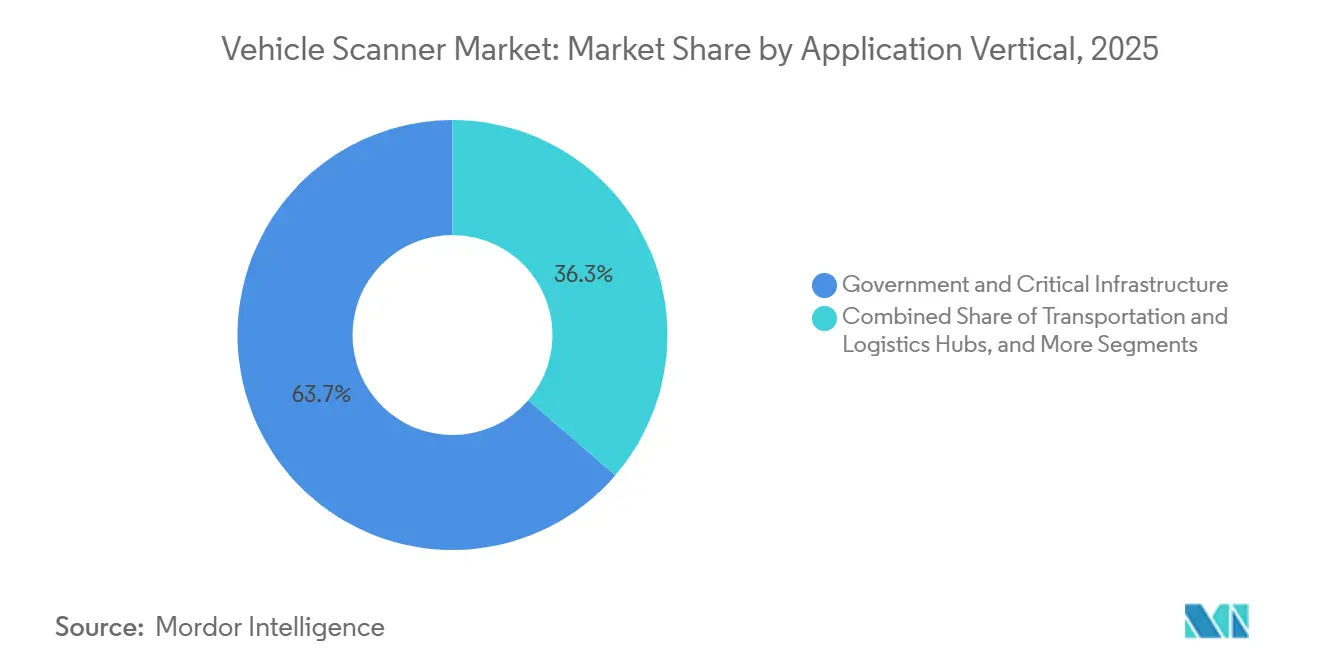
- By application vertical, government and critical-infrastructure users commanded 63.68% of the vehicle scanner market share in 2025; private and commercial facilities are expected to record a 3.91% CAGR.
- By geography, North America captured 39.26% of the vehicle scanner market share in 2025, yet Asia-Pacific is on track for the quickest regional expansion at 3.63% CAGR.
Note: Market size and forecast figures in this report are generated using Mordor Intelligence’s proprietary estimation framework, updated with the latest available data and insights as of January 2026.
Global Vehicle Scanner Market Trends and Insights
Drivers Impact Analysis*
| Driver | (~) % Impact on CAGR Forecast | Geographic Relevance | Impact Timeline |
|---|---|---|---|
| Rising Cross-Border Trade Volumes and Cargo Security Mandates | +0.8% | Global focus on North America, European Union, and Asia-Pacific corridors | Medium term (2–4 years) |
| Mandatory 100% Scanning Directives at U.S. and EU Ports | +0.7% | North America and European Union, with spill-over to South America and MEA | Short term (≤ 2 years) |
| AI-Enabled Anomaly Detection Reduces False Positives and Staffing Costs | +0.6% | Early adoption in North America, European Union, and Asia-Pacific | Medium term (2–4 years) |
| Surge in Security Spending for Critical Infrastructure | +0.5% | Middle East and Africa, Asia-Pacific, secondary gains in South America | Long term (≥ 4 years) |
| Insurance and Fleet Leasing Firms Adopting Drive-Through Scanners | +0.4% | North America and European Union, emerging in Asia-Pacific urban hubs | Medium term (2–4 years) |
| EU Import Control System 2 Phase-In Driving NII Investments | +0.3% | European Union core, influence on partner countries | Short term (≤ 2 years) |
| Source: Mordor Intelligence | |||
Rising Cross-Border Trade Volumes And Cargo Security Mandates
Rapid growth in containerized freight has outpaced the capacity of manual inspection, prompting customs agencies to deploy high-throughput, non-intrusive systems. The U.S. Congress set a five-year window for 100% scanning of inbound containers, while the European Union activated the Import Control System 2 for road freight in 2025.[1]European Commission, “ICS2 Implementation Roadmap,” europa.eu Chile invested CLP 30 billion (USD 31 million) in mobile X-ray trucks, seizing 6.8 million counterfeit goods during January-September 2025. India’s 2026-27 Union Budget allocates funding for AI-powered portals at every major port. Such directives are converting episodic capital purchases into multi-year refresh programs that favor modular platforms capable of software upgrades without hardware replacement.
Mandatory 100% Scanning Directives At U.S. And EU Ports
Compressed regulatory timelines are accelerating procurement. U.S. Customs and Border Protection already operates 405 non-intrusive inspection units and has ordered 38 additional drive-through systems to meet the mandate by 2027, according to. The Department of Homeland Security is piloting low-energy portals that cut radiation dose in half at San Ysidro. In Europe, ICS2 is pushing ports to integrate license-plate recognition and X-ray images with customs risk engines, while Argentina deployed trailer-type scanners at high-altitude crossings to pre-clear cargo destined for EU markets.
AI-Enabled Anomaly Detection Reduces False Positives And Staffing Costs
Machine-learning algorithms are shifting the economic equation from hardware throughput to software precision. A 12-week United Kingdom Border Force pilot cut manual secondary inspections by 30%. Indian Customs now uses AI filters to release low-risk cargo in real time. Nuctech’s MT1213 DE scanner, delivered to Chile in 2026, learns autonomously to classify organic versus inorganic materials, enabling single-operator control in remote sites. These gains in productivity underpin the vehicle scanner market’s shift toward recurring software subscriptions.
Surge In Security Spending For Critical Infrastructure In Middle East And Africa And Asia-Pacific
Sovereign-wealth funds and development banks are retrofitting energy, defense, and transport hubs with multi-layered perimeter security. Vietnam’s smart border gates couple AI, 5G, and autonomous vehicle lanes for seamless customs processing. Argentina is consolidating customs, immigration, and agro-sanitary checks at its new Iguazú frontier center. Chile plans six additional mobile scanners in 2026 as part of a technology-renewal roadmap. These projects create sustained demand for drive-through and under-vehicle surveillance packages optimized for harsh climates and variable traffic.
Restraints Impact Analysis*
| Restraint | (~) % Impact on CAGR Forecast | Geographic Relevance | Impact Timeline |
|---|---|---|---|
| Health and Privacy Concerns Over Cumulative Radiation Exposure | -0.3% | Global, heightened in North America and European Union | Medium term (2–4 years) |
| High Capex for Drive-Through Portals Deters Small Facilities | -0.2% | Global, especially in South America, Africa, and rural North America | Long term (≥ 4 years) |
| Absence of Unified Imaging and Test Standards Across Regions | -0.2% | Fragmented regulations among North America, European Union, Asia-Pacific | Long term (≥ 4 years) |
| Scarcity of Certified Field Technicians Limits Rural Deployment and Support | -0.2% | North America, European Union, Asia-Pacific secondary markets | Medium term (2–4 years) |
| Source: Mordor Intelligence | |||
Health And Privacy Concerns Over Cumulative Radiation Exposure
Advocacy groups are pressuring regulators to tighten dose limits. U.S. rules cap vehicle-scan exposure at 0.1 milliroentgen per pass, and Ohio’s state code mirrors that ceiling.[2]U.S. Food and Drug Administration, “21 CFR 1020.40 Radiation Standards,” fda.gov A U.K. defense study shows a single backscatter scan delivers 0.05 microsieverts, yet staff scanning hundreds of vehicles per shift raises collective-dose objections. DHS pilots of ultra-low-dose portals signal a policy shift toward non-ionizing options, boosting millimeter-wave adoption.
High Capex For Drive-Through Portals Deters Small Facilities
A full-featured gantry can cost more than USD 1 million plus 10-15% annually for maintenance. LiveView Technologies introduced GuardGate in March 2026, a portable barrier with AI and license-plate recognition priced for rapid payback at distribution yards. Chile spends CLP 3.2 billion (USD 3.3 million) per mobile truck, beyond many rural customs budgets. Leasing and per-scan models offer lower upfront costs, but long-term fees can eclipse the cost of outright purchase, complicating return-on-investment calculations.
*Our forecasts treat driver/restraint impacts as directional, not additive. The impact forecasts reflect baseline growth, mix effects, and variable interactions.
Segment Analysis
By Scanner Type: Portability Gains As Temporary Checkpoints Multiply
Fixed gantries commanded 65.71% of the 2025 vehicle scanner market share, reflecting decades of deployment at high-volume ports and border crossings. These installations integrate overhead X-ray, radiation portals, and automated conveyors, supporting throughputs of 40-60 vehicles per hour. Portable units, although lower in hourly capacity, give customs agencies the freedom to reposition assets at seasonal trade peaks or intelligence-led hotspots. Chile moved a Nuctech MT1213 DE unit to the Cardenal Samoré crossing, where extreme weather and fluctuating traffic volumes make permanent infrastructure impractical.[3]European Commission, “Are X-ray security scanners safe?” ec.europa.eu
The vehicle scanner market for mobile systems is advancing at a 3.78% CAGR, driven by relocatable designs that can ride on railcars, trucks, or trailers. U.S. Customs recently ordered 100 relocatable portals to satisfy evolving threat profiles without new civil works. While fixed scanners remain indispensable for anchor ports, budget-constrained agencies now blend both categories, using gantries at main hubs and trailers at secondary crossings to maximize coverage without proportional capital outlay.


By Structure Type: UVSS Extends Beyond Classic Perimeter Defense
Drive-through portals accounted for 52.54% of 2025 revenue due to their one-pass, head-to-tail imaging capability. They remain a regulatory cornerstone for the detection of weapons, narcotics, and undeclared cargo. Under-vehicle surveillance systems are projected to grow at a 3.55% CAGR, driven by critical infrastructure users who pair them with access-control bollards. Vietnam’s smart gates combine UVSS, license plate recognition, and biometric checks to clear trucks in less than 1 minute.
Hybrid architectures are blurring category lines as vendors embed UVSS arrays inside X-ray lanes, giving operators a composite view of cabin, cargo hold, and chassis in a single transit. The vehicle scanner market now rewards suppliers that can feed all image layers into unified analytic dashboards, easing operator workload and tightening audit trails. This convergence is particularly valuable at corporate campuses concerned with both contraband and accidental damage documentation.
By Technology: Millimeter-Wave Imaging Captures The Non-Ionizing Premium
X-ray backscatter, with a 40.11% slice of 2025 revenue, still anchors the installed base, but millimeter-wave and terahertz systems are forecast to clock the highest 3.98% CAGR. Teradar’s CES 2026 unveiling of a passive 220 gigahertz array highlighted the ability to detect hidden objects without ionizing radiation. European airports, responding to stricter dose guidelines, are testing dual-energy CT plus millimeter-wave overlays to maintain material discrimination without regulatory friction.
The vehicle scanner market for millimeter-wave platforms may be smaller today, yet premium price points and lower licensing hurdles attract both public and private buyers. Peer-reviewed trials proved sub-millimeter resolution suitable for vehicle hulls, positioning the modality as a long-term successor to backscatter in passenger-car and light-truck lanes. Dual-energy transmission remains dominant for heavy freight, where 320 kV sources penetrate dense cargo, but even here, multi-modal sensors that fuse X-ray and millimeter-wave images are emerging as procurement favorites.

By Component: Software Subscriptions Eclipse Hardware Margins
Cameras generated 35.05% of 2025 turnover, yet software revenue is growing 3.86% per year as analytics move to cloud dashboards. UVeye now scans nearly 1 million vehicles monthly for Amazon, CarMax, and General Motors, monetizing each image through AI-based defect detection. For customs operators, progressive-learning libraries reduce false positives and accelerate release by replacing static rule sets with adaptive models.
Hardware commoditization is compressing margins on sensors and lighting arrays. Vendors compensate by bundling multi-year maintenance and per-scan analytic fees. The vehicle scanner market is therefore tilting toward platform economics: customers value remote calibration, over-the-air model updates, and API connectors more than incremental boosts in camera resolution. Suppliers unable to pivot toward software risk, leading to erosion of share in the face of cloud-native entrants.
By Application Vertical: Private Facilities Narrow The Gap With Government
Government and critical-infrastructure users accounted for 63.68% of 2025 spending, supported by statutory border mandates and defense funding. However, insurance-driven digitization is steering private fleets toward automated portals that document damage at every handoff. UVeye’s dealership roll-outs illustrate how shorter dwell times and objective imaging alleviate disputes over cosmetic claims.
The vehicle scanner market size from private facilities is growing at a 3.91% CAGR as distributors, rental firms, and logistics yards adopt lower-dose or optical-only systems. These buyers prioritize ease of deployment, often choosing portable barriers like GuardGate that install in hours and reduce reliance on human guards. As software dashboards normalize across public and private sites, data interoperability will become the next battleground for vendors seeking enterprise-wide platform lock-in.
Geography Analysis
North America retained 39.26% of 2025 revenue thanks to a mature installed base and sizable follow-on contracts, including a USD 200 million order for relocatable passenger-vehicle scanners. A DHS-funded low-energy pilot at San Ysidro underlines the region’s pivot toward lower-dose portals. Canada and Mexico are harmonizing protocols to support unified USMCA corridors, favoring interoperable software layers that exchange manifest data in real time.
Asia-Pacific is projected to grow at a 3.63% CAGR, the quickest among all regions. India’s 2026-27 budget mandates AI-based scanning at every major port. Vietnam opened smart gates with autonomous lanes and UVSS to streamline cross-border traffic with China. China, Japan, and South Korea are upgrading dual-energy portals to integrate license-plate and driver-face recognition, while Australia refreshes systems to meet biosecurity benchmarks.
Europe’s share is anchored by the Import Control System 2, effective for road freight since April 2025. London Heathrow installed Smiths Detection CT systems as part of a GBP 1 billion modernization.[4]Smiths Detection, “HI-SCAN 6040 CTiX Reaches 2,000 Units,” smithsdetection.comEastern European candidate states are front-loading scanner procurements to expedite accession talks. South America is led by Chile and Argentina, which rely on mobile trucks to secure mountain passes where civil works are cost-prohibitive. The Middle East and Africa remain mixed: Saudi Arabia and the United Arab Emirates fund large-scale upgrades, while budget gaps limit rural penetration elsewhere.

Competitive Landscape
The top five suppliers, OSI Systems, Smiths Detection, Leidos, Nuctech, and UVeye Ltd., collectively capture a significant share of global revenue, giving the vehicle scanner market a moderate concentration profile. OSI Systems secured more than USD 200 million in 2025 orders, including a USD 56 million batch of Eagle M60 ZBx and ZBV trucks. Smiths Detection exceeded 2,000 global installations of its HI-SCAN 6040 CTiX in March 2026.
Software-native challengers are scaling quickly. UVeye raised USD 191 million and now handles almost 1 million monthly scans across commercial fleets.[5]UVeye, “Series D Funding Announcement,” uveye.com Nuctech delivered AI-equipped mobile portals to Chile in 2026, showing China’s state-backed financing strategy for Latin American contracts.
Standards published under ISO 19232-3:2025 and ISO 15708-4:2025 are commoditizing baseline imaging, forcing hardware leaders to differentiate via analytics, cloud integration, and lifetime service models. New entrants target underserved niches: LiveView’s GuardGate addresses facilities that cannot justify the cost of million-dollar gantries, and terahertz startups pitch non-ionizing systems that sidestep radiation licensing requirements.
Vehicle Scanner Industry Leaders
OSI Systems Inc. (Rapiscan Systems)
Smiths Detection Inc.
Leidos Holdings Inc. (VACIS)
Nuctech Company Limited
UVeye Ltd.
- *Disclaimer: Major Players sorted in no particular order

Recent Industry Developments
- March 2026: LiveView Technologies launched GuardGate, a portable barrier with AI monitoring and license-plate recognition. Early pilots cut guard costs by more than 30%.
- March 2026: Smiths Detection sold its 2,000th HI-SCAN 6040 CTiX, marking broad adoption in aviation.
- July 2025: OSI Systems received a USD 34 million order for Z Portal and CarView lanes from an international customer.
- January 2025: UVeye raised USD 191 million to accelerate global roll-out of AI-powered inspection portals.


Global Vehicle Scanner Market Report Scope
The Vehicle Scanner Market Report is Segmented by Scanner Type (Fixed or Static, Portable or Mobile), Structure Type (Drive-Through Scanners, Under-Vehicle Surveillance Systems), Technology (X-Ray Backscatter, Dual-Energy Transmission X-Ray, Millimeter-Wave Imaging, Terahertz Imaging, Infrared and Optical Line-Scan, Acoustic or Ultrasonic), Component (Camera, Lighting Unit, Barriers, Software, Services, Other Components), Application Vertical (Government and Critical Infrastructure Protection, Commercial and Industrial Facilities, Transportation and Logistics Hubs, Automotive Dealership and Fleet Maintenance, Law Enforcement and Border Control), and Geography (North America, South America, Europe, Asia-Pacific, Middle East and Africa). The Market Forecasts are Provided in Terms of Value (USD).
| Fixed / Static |
| Portable / Mobile |
| Drive-Through Scanners |
| Under-Vehicle Surveillance Systems (UVSS) |
| X-Ray Backscatter |
| Dual-Energy Transmission X-Ray |
| Millimeter-Wave Imaging |
| Terahertz Imaging |
| Infrared and Optical Line-Scan |
| Acoustic / Ultrasonic |
| Camera |
| Lighting Unit |
| Barriers |
| Software |
| Services |
| Other Components |
| Government and Critical Infrastructure Protection |
| Commercial and Industrial Facilities |
| Transportation and Logistics Hubs |
| Automotive Dealership and Fleet Maintenance |
| Law Enforcement and Border Control |
| North America | United States | |
| Canada | ||
| Mexico | ||
| South America | Brazil | |
| Argentina | ||
| Rest of South America | ||
| Europe | Germany | |
| United Kingdom | ||
| France | ||
| Italy | ||
| Spain | ||
| Rest of Europe | ||
| Asia-Pacific | China | |
| Japan | ||
| India | ||
| South Korea | ||
| ASEAN | ||
| Rest of Asia-Pacific | ||
| Middle East and Africa | Middle East | Saudi Arabia |
| United Arab Emirates | ||
| Turkey | ||
| Rest of Middle East | ||
| Africa | South Africa | |
| Nigeria | ||
| Rest of Africa | ||
| By Scanner Type | Fixed / Static | ||
| Portable / Mobile | |||
| By Structure Type | Drive-Through Scanners | ||
| Under-Vehicle Surveillance Systems (UVSS) | |||
| By Technology | X-Ray Backscatter | ||
| Dual-Energy Transmission X-Ray | |||
| Millimeter-Wave Imaging | |||
| Terahertz Imaging | |||
| Infrared and Optical Line-Scan | |||
| Acoustic / Ultrasonic | |||
| By Component | Camera | ||
| Lighting Unit | |||
| Barriers | |||
| Software | |||
| Services | |||
| Other Components | |||
| By Application Vertical | Government and Critical Infrastructure Protection | ||
| Commercial and Industrial Facilities | |||
| Transportation and Logistics Hubs | |||
| Automotive Dealership and Fleet Maintenance | |||
| Law Enforcement and Border Control | |||
| By Geography | North America | United States | |
| Canada | |||
| Mexico | |||
| South America | Brazil | ||
| Argentina | |||
| Rest of South America | |||
| Europe | Germany | ||
| United Kingdom | |||
| France | |||
| Italy | |||
| Spain | |||
| Rest of Europe | |||
| Asia-Pacific | China | ||
| Japan | |||
| India | |||
| South Korea | |||
| ASEAN | |||
| Rest of Asia-Pacific | |||
| Middle East and Africa | Middle East | Saudi Arabia | |
| United Arab Emirates | |||
| Turkey | |||
| Rest of Middle East | |||
| Africa | South Africa | ||
| Nigeria | |||
| Rest of Africa | |||


Key Questions Answered in the Report
How fast is the vehicle scanner market expected to grow through 2031?
It is projected to expand at a 3.06% CAGR from 2026 to 2031, reaching USD 3.22 billion by the end of the period.
Which scanner structure is gaining traction outside government checkpoints?
Under-vehicle surveillance systems are advancing at a 3.55% CAGR as corporate campuses and logistics yards adopt layered perimeter defense solutions.
Why are millimeter-wave platforms attracting new investment?
They operate in non-ionizing bands, easing regulatory approvals and mitigating cumulative radiation concerns while still delivering high-resolution imaging.
What is driving demand from private fleets and insurers?
Automated drive-through portals document vehicle condition in seconds, reducing adjuster site visits and streamlining claims processing, a trend pushing private-facility CAGR to 3.91%.
Which region offers the fastest growth prospects?
Asia-Pacific leads with a forecast 3.63% CAGR, propelled by India's AI-powered port initiatives and Vietnam's smart gate deployments.
How are vendors offsetting hardware commoditization?
Leading suppliers now bundle cloud analytics, over-the-air model updates, and multi-year service plans, shifting revenue toward recurring software subscriptions.
Page last updated on:


