Pre-harvest Equipment Market Size and Share
Market Overview
| Study Period | 2020 - 2030 |
|---|---|
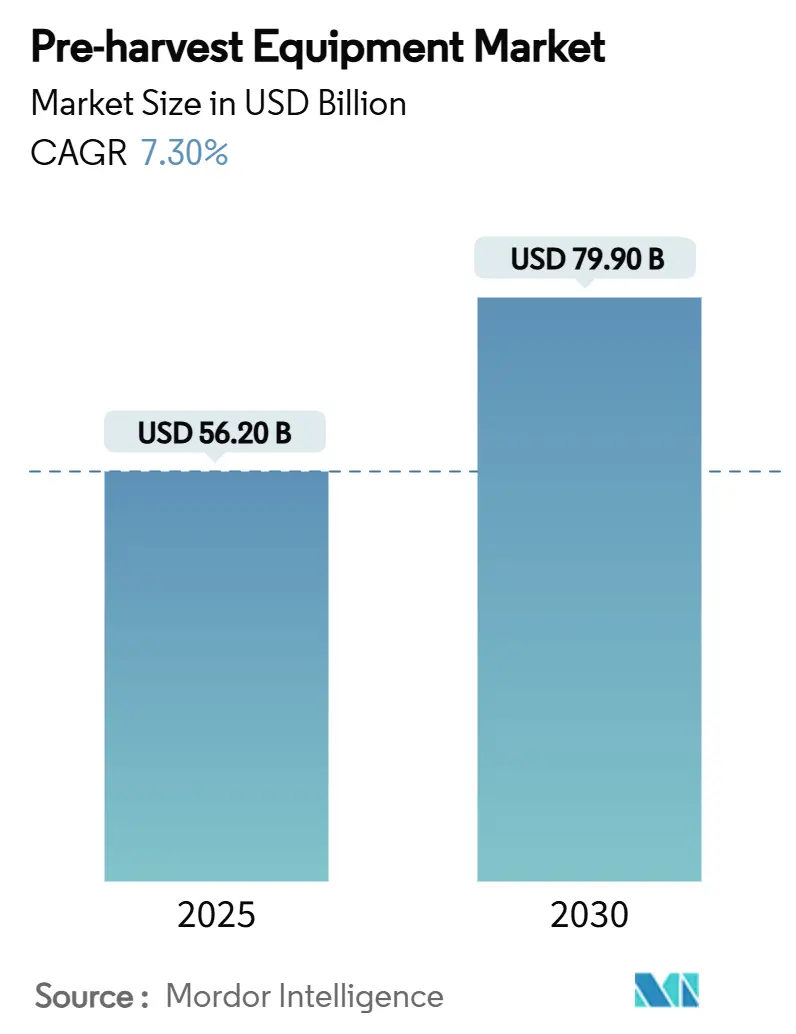
| Market Size (2025) | USD 56.20 Billion |
| Market Size (2030) | USD 79.90 Billion |
| Growth Rate (2025 - 2030) | 7.30% CAGR |
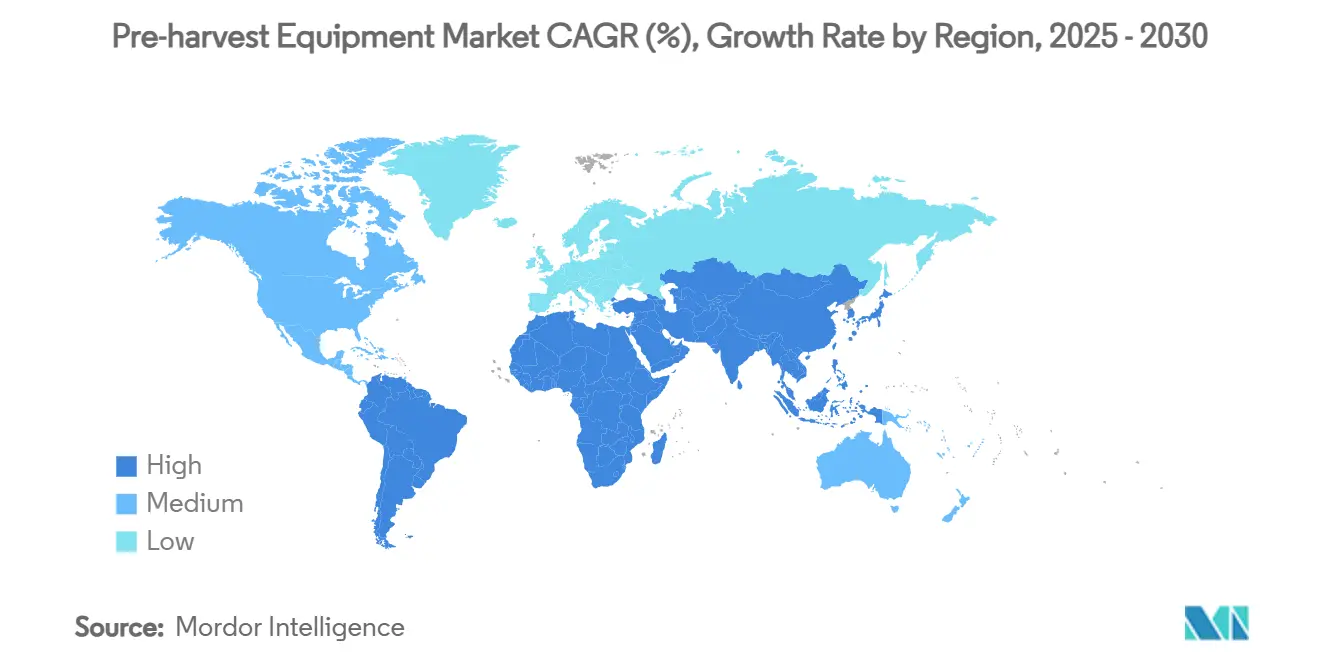
| Fastest Growing Market | Middle East |
| Largest Market | Asia Pacific |
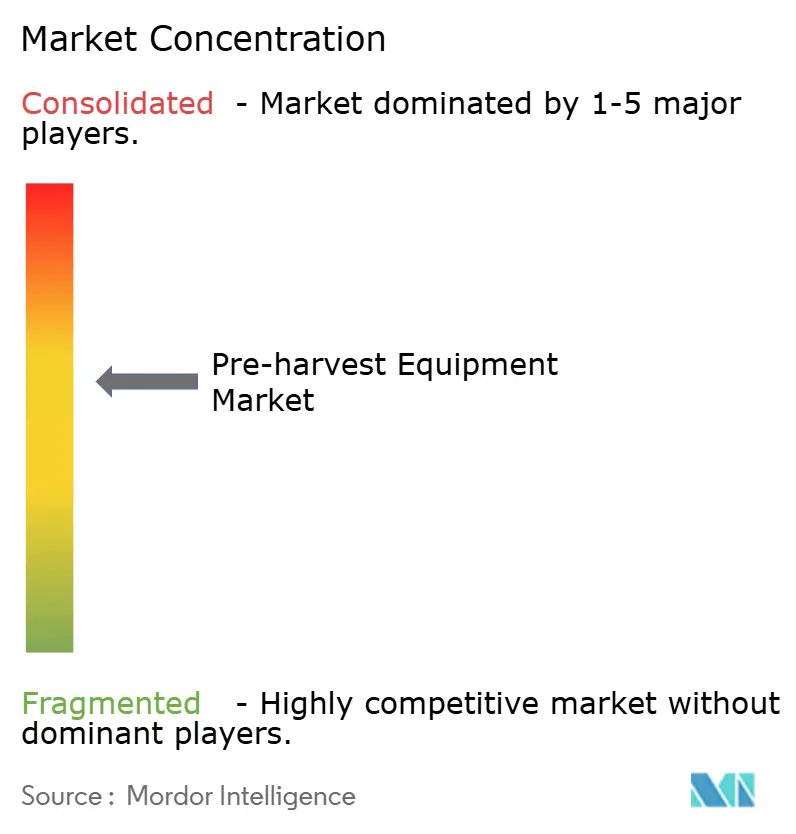
| Market Concentration | Medium |
Major Players *Disclaimer: Major Players sorted in no particular order Image © Mordor Intelligence. Reuse requires attribution under CC BY 4.0. | |
Pre-harvest Equipment Market Analysis by Mordor Intelligence
The pre-harvesting equipment market size stood at USD 56.2 billion in 2025 and is forecast to reach USD 79.9 billion by 2030, advancing at a 7.3%. This sustained expansion reflects chronic farm-labor shortages, rapid precision-agriculture uptake, and the arrival of autonomous field platforms that lower operating costs and boost input efficiency. Asia-Pacific remains the revenue leader, anchored by rising mechanization levels in China and government subsidy schemes in India, while the Middle East delivers the fastest regional CAGR as food-security programmes steer capital toward robotics and vertical farming. Cultivators retain top billing among implements, yet a surge of electric, self-navigating robots signals a pivotal technology shift. Tractor-mounted tools still dominate, though self-propelled equipment is scaling quickly as growers look for pinpoint depth control, input saving, and relief from operator availability constraints. Competitive dynamics in the pre-harvesting equipment market are shifting as legacy manufacturers acquire digital agriculture specialists, contend with component shortages, and recalibrate production to meet demand for fully integrated autonomous solutions.
Key Report Takeaways
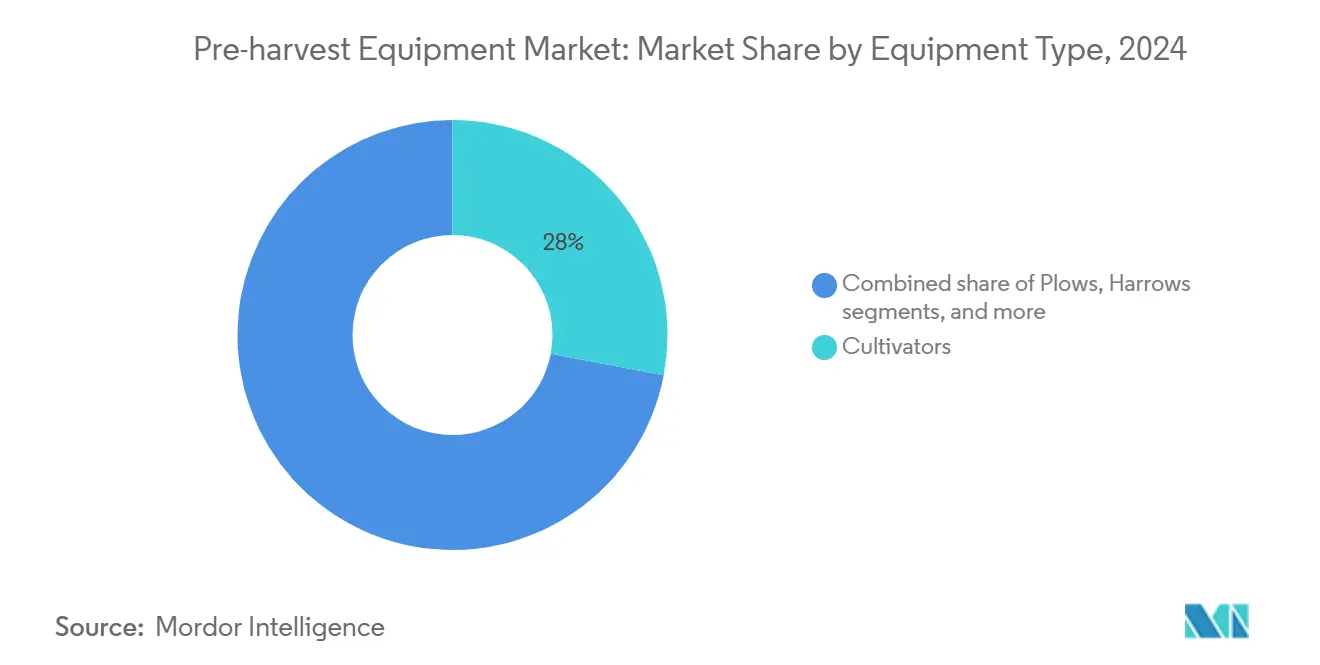
- By equipment type, cultivators led with 28% of the pre-harvesting equipment market share in 2024, whereas planters are projected to expand at an 8.5% CAGR through 2030.
- By power source, tractor-mounted implements held 41.8% of the market size in 2024, while self-propelled systems are slated to post a 9.4% CAGR to 2030.
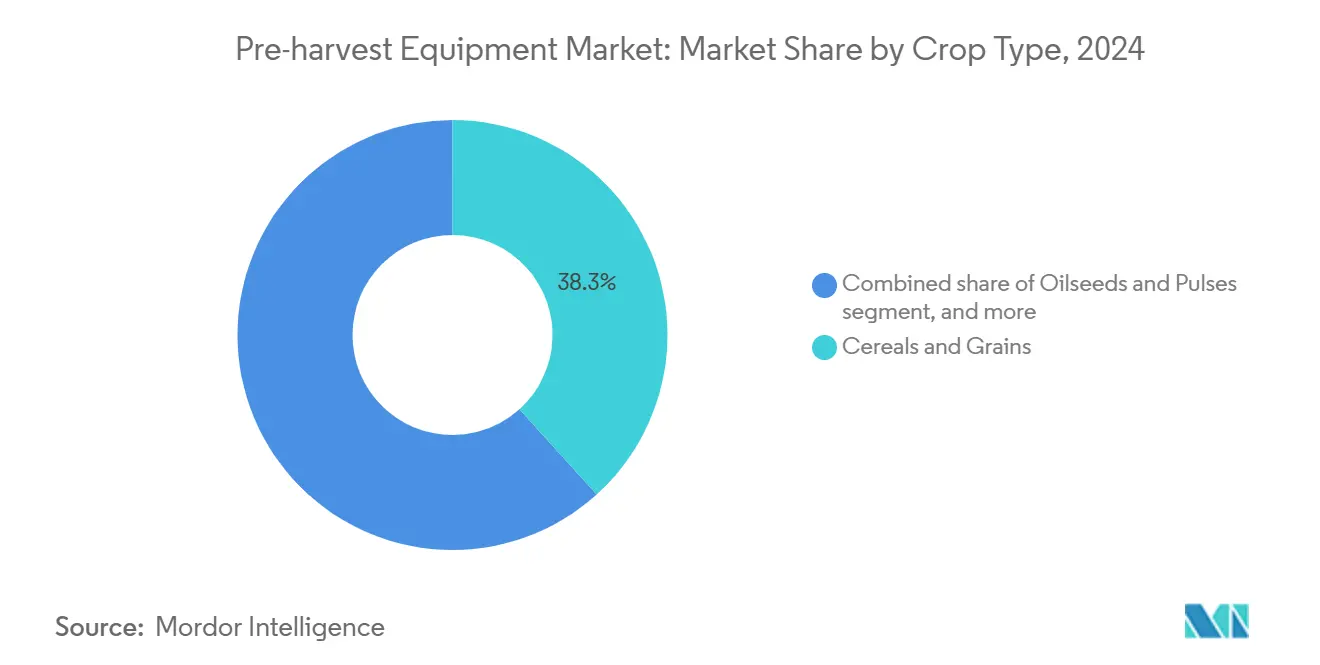
- By crop, cereals and grains accounted for a 38.3% share of the pre-harvesting equipment market size in 2024, and fruits and vegetables are accelerating at an 11.2% CAGR through 2030.
- By end user, large-scale farms captured 45% of the market size in 2024, and small and medium farmers represent the fastest-growing cohort at a 10.5% CAGR to 2030.
- By geography, Asia-Pacific commanded 32.5% revenue share in 2024, while the Middle East is forecast to register an 8.2% CAGR, the quickest among all regions.
Global Pre-harvest Equipment Market Trends and Insights
Drivers Impact Analysis*
| Driver | (~) % Impact on CAGR Forecast | Geographic Relevance | Impact Timeline |
|---|---|---|---|
| Increasing labor scarcity and rising farm labor costs | +1.8% | North America, Japan, and global spillover | Medium term (2-4 years) |
| Shift toward precision agriculture requiring compatible pre-harvesting implements | +1.5% | North America, Europe, and Asia-Pacific | Long term (≥ 4 years) |
| Government mechanization subsidies in emerging economies | +1.2% | Asia-Pacific, Africa, and South America | Short term (≤ 2 years) |
| Growing demand for sustainable minimum-tillage equipment | +1.0% | Europe, North America, and global | Long term (≥ 4 years) |
| Surge in autonomous electric field robots | +0.9% | Japan, North America, and Northern Europe | Medium term (2-4 years) |
| Adoption of AI-driven variable-depth tillage systems | +0.7% | United States, Germany, and Netherlands | Long term (≥ 4 years) |
| Source: Mordor Intelligence | |||
Increasing Labor Scarcity and Rising Farm Labor Costs
Two-thirds of commercial growers surveyed in 2025 reported adopting mechanical solutions to offset persistent labor gaps, a trend most acute in Japan and the United States, where demographic aging accelerates wage escalation [1]Source: Philip Brasher, “How Technology Can Help Solve Agriculture's Labor Woes,” Agri-Pulse, agripulse.com. Japanese authorities are underwriting the rollout of 20,000 AI-enabled field robots by 2025, reflecting a policy pivot toward incentives for automation. On the ground, mechanized pruners and tillage robots slash task times while easing physical strain, improving worker safety, and retention. The Global Harvest Automation Initiative aims to automate half of the United States' specialty crop harvesting by 2035, underscoring the strategic scale of robotics adoption.
Shift Toward Precision Agriculture Requiring Compatible Pre-Harvesting Implements
Variable-rate and sensing technologies are reshaping implement design as farms pursue centimetre-level accuracy to curb input waste. Variable-depth tillage rigs equipped with compression sensors adapt shank penetration on the fly, trimming energy needs 45% relative to fixed-depth operations. Seed drills now synchronize population rates with soil-moisture maps, and multi-product planters dispense fertilizer and biologicals simultaneously, amplifying field-pass productivity. As digital platforms become standard, manufacturers are embedding connectivity hardware as a baseline specification instead of premium add-ons.
Government Mechanization Subsidies in Emerging Economies
Targeted grants, low-interest loans, and custom-hiring centres are accelerating mechanization where capital scarcity once stalled uptake. Brazil and Ghana run service-centre programmes that pool ownership and maintenance, though long-term sustainability hinges on transparent pricing and stable financing. By lowering entry barriers, these initiatives catalyse demonstration effects that encourage private dealers to expand into underserved districts. Subsidy-driven demand therefore feeds directly into the pre-harvesting equipment market, especially for mid-horsepower tractors and power-efficient implements.
Growing Demand for Sustainable Minimum-Tillage Equipment
Conservation tillage has moved from niche practice to mainstream agronomic strategy as carbon-credit schemes gain traction. No-till and strip-till systems preserve soil aggregates, cut erosion and enhance moisture retention, thereby supporting crop resilience under erratic rainfall. Sensor-guided coulters maintain consistent residue cover by adjusting penetration depth in real time, avoiding overworking lighter soils. Equipment suppliers are responding with lighter frames, electrified drivetrains, and plug-and-play sensor ports that support adaptive agronomy without sacrificing throughput.
Restraints Impact Analysis*
| Restraint | (~) % Impact on CAGR Forecast | Geographic Relevance | Impact Timeline |
|---|---|---|---|
| High upfront capital cost for smallholders | -1.1% | Global, particularly acute in Sub-Saharan Africa and South Asia | Short term (≤ 2 years) |
| Fragmented land holdings limiting equipment efficiency | -0.8% | Asia-Pacific core, with significant impact in India, China, and Bangladesh | Medium term (2-4 years) |
| Supply-chain volatility for critical powertrain components | -0.7% | Global, with manufacturing concentration in Asia | Short term (≤ 2 years) |
| Data-privacy concerns slowing connected implement uptake | -0.4% | Europe and North America leading regulatory frameworks | Long term (≥ 4 years) |
| Source: Mordor Intelligence | |||
High Upfront Capital Cost for Smallholders
Inflationary pressure pushed average machinery asset values outpacing crop price gains and squeezing smallholder purchase capacity[2]Source: Johann Tasker, “How to Set Up a Farm Machinery Sharing Syndicate,” Farmers Weekly, fwi.co.uk. Rising interest rates drive financing charges higher, with dealers carrying inventory costs of USD 400,000–500,000 per high-horsepower machine. Equipment-sharing syndicates double utilisation hours and return rental income to owners, blunting capital-absorption risk. Digital marketplaces, such as MachineryLink, match idle assets with demand, targeting the USD 244 billion in underutilized machinery identified by the United States Department of Agriculture audits. Despite proven models, uptake hinges on reliable mobile coverage and transparent pricing structures that build trust among geographically dispersed users.
Fragmented Land Holdings Limiting Equipment Efficiency
Average farm size across India and China remains below 3 ha, making pass-to-pass efficiency gains difficult to achieve and raising transport time between non-contiguous plots. A 2025 systematic review concluded that fragmentation erodes productivity by curbing economies of scale necessary for mechanization payback. Equipment makers respond with sub-25 hp autonomous tillers that navigate narrow terraces and deploy modular toolbars matching micro-plot width. Service-provider networks also aggregate demand across dozens of growers, scheduling operations to optimize route density. The restraint will persist until land-tenure innovations align legal frameworks with rising mechanization appetite.
*Our forecasts treat driver/restraint impacts as directional, not additive. The impact forecasts reflect baseline growth, mix effects, and variable interactions.
Segment Analysis
By Equipment Type: Planters Drive Precision Seeding Revolution
Cultivators accounted for 28% of the pre-harvesting equipment market share in 2024, affirming their central role in residue management and shallow tillage across row-crop systems. Plows and harrows remain staples for primary and secondary soil preparation, yet both categories now integrate depth-control actuators and load-sensing hydraulics to reduce draft power and surface compaction. Seed drills and planters have shifted toward electrically driven meter drives that execute variable-rate scripts with centimetre accuracy, enabling simultaneous in-furrow nutrition and biological treatments.
Planters now represent the fastest-growing category at an 8.5% CAGR to 2030, boosted by variable-rate seed metering, multi-product delivery, and row-level sensing that elevate crop establishment precision. Sprayer systems increasingly mount optical-targeting modules, slashing herbicide spend and runoff, while software updates unlock plug-in mapping functions without hardware swaps.


By Power Source: Electric Propulsion Challenges Tractor Dependency
Tractor-mounted implements held 41.8% of the market share in 2024, as global tractor inventories exceeded 30 million units, and Power Take-Off (PTO) connections offer a mature, standardized power transfer. Electrically driven tools are increasingly appealing to growers seeking to improve fuel efficiency, and field trials have shown that electrically actuated planters reduce diesel use by 33.3% compared to hydraulic systems.
Self-propelled rigs are forecast to expand at a 9.4% CAGR through 2030 as integrated powertrains permit tighter turning radii, headland automation, and implement-specific weight distribution that protects soil structure. PTO-driven attachments maintain traction in mixed-crop operations where versatility outweighs single-purpose optimisation, but their market share is projected to edge lower as electrification spreads.
By Crop Type: Specialty Crops Drive Mechanization Innovation
Cereals and grains captured 38.3% of the market size in 2024 as large-acreage operations standardized on high-capacity tillage and harvesting tools. As consumer demand for blemish-free produce rises, precise implement control that limits tuber bruising or stem breakage becomes a competitive necessity, further lifting the technology threshold across the pre-harvesting equipment market. Oilseeds and pulses benefit from narrow-row drills that maintain consistent spacing even on undulating topography, cutting lodging risk and enhancing fertilizer-uptake efficiency.
However, fruits and vegetables are projected to register an 11.2% CAGR through 2030, outpacing broad-acre segments because high-value crops justify investment in gentle, high-precision field robotics. Pilot harvesters for Chinese cabbage achieved 90.5% pick accuracy at commercial speeds, foreshadowing broader specialty-crop mechanization. Vine-crop farmers deploy camera-guided cultivators that differentiate seedlings from weeds, minimising herbicide exposure and improving marketable yield grades.
By End User: Small Farmers Gain Access to Advanced Technologies
Large operations represented 45% of the market size in 2024 due to their capital depth and appetite for early adoption of emerging technologies. Lightweight robots traverse narrow plots without causing compaction, and battery power eliminates refuelling logistics. Consequently, the pre-harvesting equipment market can penetrate previously overlooked micro-farm segments, broadening its long-term addressable base.
Yet small and medium farms show the highest growth trajectory at 10.5% CAGR, as platform-based service models have democratized access. Hello Tractor’s pay-as-you-go booking app connects independent tractor owners with nearby growers, lifting utilisation and reducing per-acre charges. Cooperatives pooling purchase power negotiate volume discounts and schedule machinery to maximize uptime, while joint-ownership limited-liability partnerships spread depreciation and tax advantages.
Geography Analysis
Asia-Pacific retained leadership with 32.5% revenue share in 2024, propelled by Chinese mechanization rates climbing to 57% under sustained subsidy support and domestic manufacturing economies of scale. India’s Sub-Mission on Agricultural Mechanization accelerates adoption through direct farmer incentives and the expansion of custom-hiring clusters, thereby closing the mechanization gap with developed economies. Japan’s Smart-Agriculture flagship programmes put over 20,000 autonomous field robots to work by 2025, a response to the world’s fastest-aging farm workforce.
The Middle East is projected to post the fastest growth at an 8.2% CAGR to 2030, as Gulf Cooperation Council states invest over USD 1 billion in AgTech funds and water-efficient desert farming in January 2023. Saudi Arabia’s greenhouse complexes utilize vertical stacking to reduce water use by 98%, while the UAE channels sovereign investment into IoT-enabled indoor farming to enhance food security. Government-financed pilot farms become technology showrooms that encourage private-sector replication and attract international equipment brands eager to serve a high-margin market environment.
North America and Europe feature mature mechanization profiles exceeding 90% adoption but continue to generate upgrades through autonomy, telematics, and sustainability compliance. Farm consolidation propels demand for high-horsepower electric-ready tractors and precision seeders equipped with prescription mapping. Sub-Saharan Africa remains an early-stage opportunity, but mobile-app service models and donor-supported finance schemes are incrementally raising mechanization penetration, providing future upside for the pre-harvesting equipment market.

Competitive Landscape
The pre-harvesting equipment market exhibits moderate concentration with a dynamic blend of heritage OEMs and venture-backed disruptors. Deere and Company, CNH Industrial N.V., AGCO Corporation, and Kubota Corporation collectively control a significant installed base, leveraging global dealer networks and full-line product breadth. In April 2024, AGCO Corporation’s acquisition of 85% of Trimble Ag forms the PTx Trimble joint venture, aligning guidance, autonomy, and retrofit solutions under one umbrella and accelerating time-to-market for self-driving kits[3]Source: AGCO Corporation, “AGCO Buys 85% of Trimble Ag,” farmprogress.com. Kubota Corporation showcases its Type S robotic carrier slated for commercialisation post-Expo 2025, underlining a corporate roadmap towards low-impact, autonomous field operations.
Technology partnerships proliferate as OEMs race to embed AI, computer vision, and electrification. CNH Industrial N.V.’s 2025 strategy pledges 16–17% mid-cycle EBIT margins through precision-tech expansion and dual-brand dealer integration, reflecting confidence in value-add software to lift profitability[4]Source: CNH Industrial, “Strategic Business Plan 2025,” investors.cnh.com. Blue-white collaborations bring specialty-crop autonomy to New Holland tractors, offering aftermarket conversions that cut vineyard labor costs up to 85%. Smaller entrants, such as FieldWorks, secure government grants to commercialize weed-robot technology, while start-ups targeting soil-sensing and situational-awareness algorithms license technology modules to incumbent manufacturers.
Component shortages and rising material costs forced Original Equipment Manufacturers (OEM) to trim 2025 build schedules, but many re-balanced by prioritising higher-margin, premium-tech models less exposed to price-sensitive segments. Dealer consolidation continues, with AGCO Corporation expanding Fendt and Massey Ferguson footprints in the United States interior to enhance customer proximity for high-service equipment. Competitive edge increasingly derives from life-cycle software and data services rather than hardware alone, reshaping revenue models toward subscription and remote-support fees. This evolution widens the moat for early movers yet invites nimble software firms to carve out niches in the expanding digital ecosystem surrounding the pre-harvesting equipment market.
Pre-harvest Equipment Industry Leaders
Deere and Company
CNH Industrial N.V.
AGCO Corporation
Kubota Corporation
Mahindra and Mahindra Ltd
- *Disclaimer: Major Players sorted in no particular order

Recent Industry Developments
- July 2025: FieldWorks received Japanese government funding to commercialize a robotic weeding system that targets an 80% reduction in weeding time by 2027.
- April 2025: AGCO expanded distribution with Carter Agri-Systems in Utah and Delta Ag Equipment in Mississippi, enhancing access to Fendt and Massey Ferguson pre-harvesting tools.
- October 2024: CLAAS launched its Connect digital ecosystem, integrating machine management, including pre-harvest machineries, service planning, and precision farming into a cloud-based platform available in over 30 countries.


Global Pre-harvest Equipment Market Report Scope
| Plows |
| Harrows |
| Cultivators |
| Seed Drills |
| Planters |
| Sprayers |
| Tractor-mounted |
| Self-propelled |
| PTO-driven Implements |
| Manual/Animal-draft |
| Cereals and Grains |
| Oilseeds and Pulses |
| Fruits and Vegetables |
| Others |
| Large-scale Farmers |
| Small and Medium Farmers |
| Agricultural Contractors |
| Cooperatives |
| North America | United States |
| Canada | |
| Mexico | |
| Rest of North America | |
| South America | Brazil |
| Argentina | |
| Chile | |
| Rest of South America | |
| Europe | Germany |
| France | |
| Italy | |
| Russia | |
| Rest of Europe | |
| Asia-Pacific | China |
| India | |
| Japan | |
| Australia | |
| Rest of Asia-Pacific | |
| Middle East | Saudi Arabia |
| United Arab Emirates | |
| Rest of Middle East | |
| Africa | South Africa |
| Egypt | |
| Rest of Africa |
| By Equipment Type | Plows | |
| Harrows | ||
| Cultivators | ||
| Seed Drills | ||
| Planters | ||
| Sprayers | ||
| By Power Source | Tractor-mounted | |
| Self-propelled | ||
| PTO-driven Implements | ||
| Manual/Animal-draft | ||
| By Crop Type | Cereals and Grains | |
| Oilseeds and Pulses | ||
| Fruits and Vegetables | ||
| Others | ||
| By End User | Large-scale Farmers | |
| Small and Medium Farmers | ||
| Agricultural Contractors | ||
| Cooperatives | ||
| By Geography | North America | United States |
| Canada | ||
| Mexico | ||
| Rest of North America | ||
| South America | Brazil | |
| Argentina | ||
| Chile | ||
| Rest of South America | ||
| Europe | Germany | |
| France | ||
| Italy | ||
| Russia | ||
| Rest of Europe | ||
| Asia-Pacific | China | |
| India | ||
| Japan | ||
| Australia | ||
| Rest of Asia-Pacific | ||
| Middle East | Saudi Arabia | |
| United Arab Emirates | ||
| Rest of Middle East | ||
| Africa | South Africa | |
| Egypt | ||
| Rest of Africa | ||


Key Questions Answered in the Report
What is the anticipated value of the pre-harvest equipment sector in 2030?
The sector is projected to reach USD 79.9 billion by 2030, reflecting a 7.3% CAGR from 2025.
Which region will register the fastest growth through 2030?
The Middle East is forecast to post an 8.2% CAGR, ahead of all other regions, driven by large AgTech investments and food-security programmes.
Which implement category currently leads global revenue?
Cultivators dominate with 28% share tdue to their versatility in soil conditioning and weed control.
What competitive strategies are top OEMs pursuing?
Leading manufacturers are acquiring precision-technology firms, launching retrofit autonomy kits and expanding dealer networks to secure recurring software revenues.
Page last updated on:


