Practice Management System Market Size and Share
Market Overview
| Study Period | 2020 - 2031 |
|---|---|
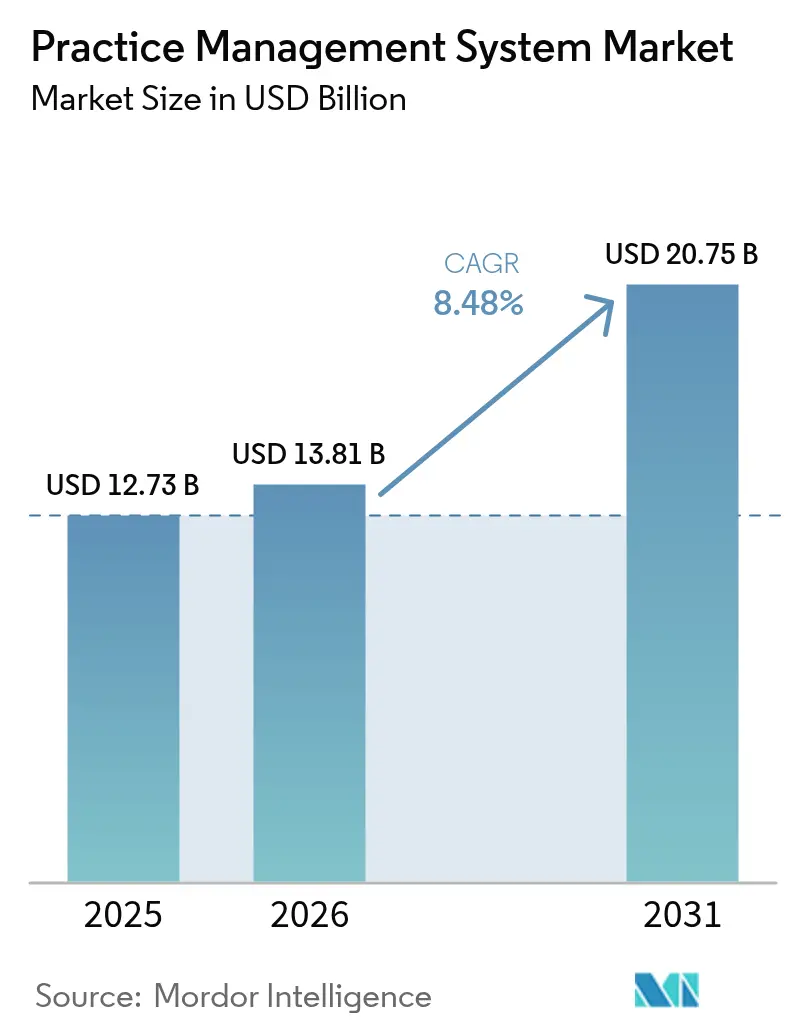
| Market Size (2026) | USD 13.81 Billion |
| Market Size (2031) | USD 20.75 Billion |
| Growth Rate (2026 - 2031) | 8.48% CAGR |
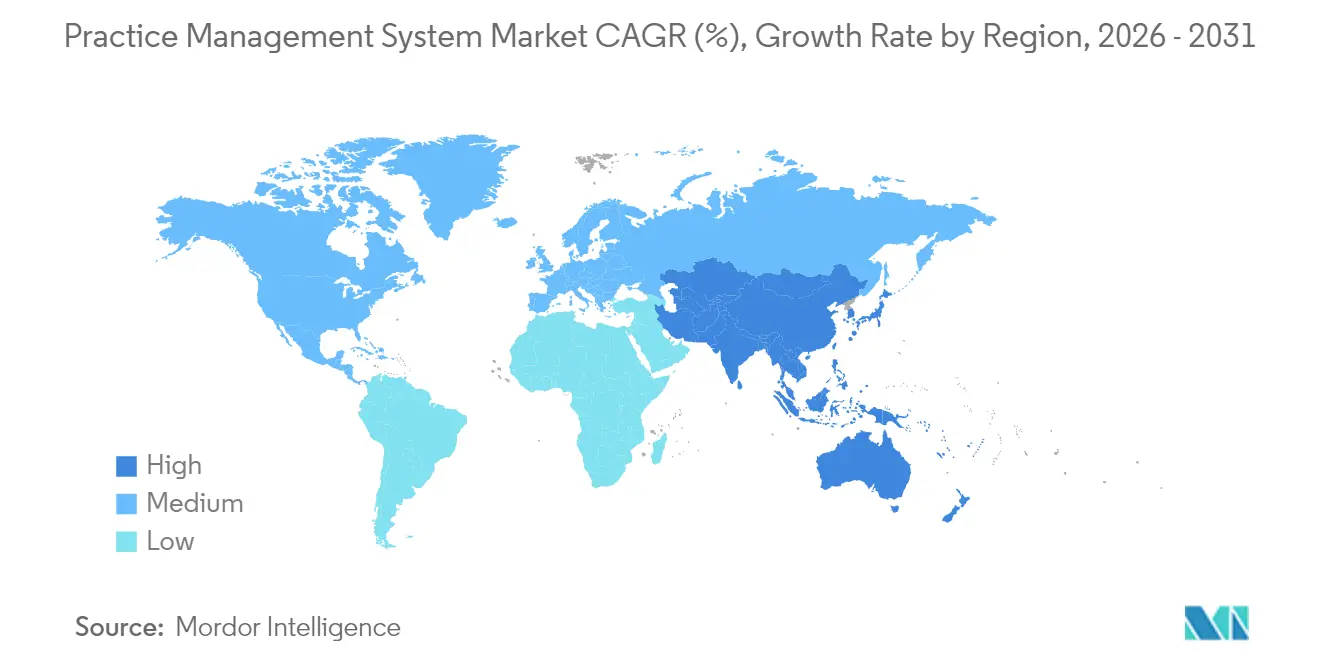
| Fastest Growing Market | Asia Pacific |
| Largest Market | North America |
| Market Concentration | Medium |
Major Players *Disclaimer: Major Players sorted in no particular order Image © Mordor Intelligence. Reuse requires attribution under CC BY 4.0. | |
Practice Management System Market Analysis by Mordor Intelligence
The Practice Management System market size is expected to grow from USD 12.73 billion in 2025 to USD 13.81 billion in 2026 and is forecast to reach USD 20.75 billion by 2031 at 8.48% CAGR over 2026-2031. Accelerated digitization, persistent workforce shortages, and increasingly complex reimbursement rules encourage providers to automate scheduling, documentation, and revenue cycle tasks. Cloud migration remains brisk because subscription models relieve capital constraints and give distributed care teams secure remote access. Integrated platforms outpace modular tools as value-based contracts reward seamless data exchange and complete quality reporting. Competitive momentum favors vendors with broad ecosystems, deep regulatory expertise, and proven interoperability because practices seek one partner able to future-proof operations while guarding margins.
Key Report Takeaways
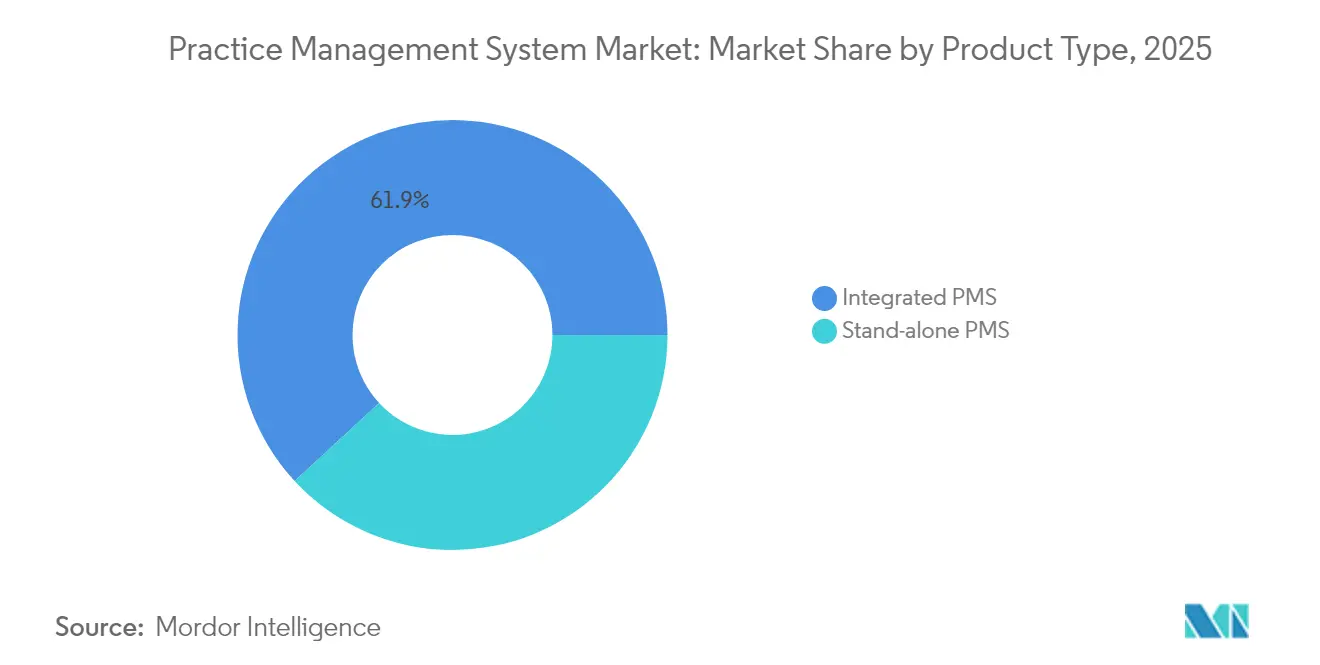
- By product type, integrated PMS captured 61.88% revenue share in 2025, while the same sub-segment is projected to expand at a 10.02% CAGR between 2026 and 2031.
- By component, software held 69.85% of the Practice Management System market share in 2025, whereas services are forecast to grow at a 9.28% CAGR through 2031.
- By deployment mode, cloud-based solutions accounted for 56.02% of the Practice Management System market size in 2025, and the same mode is projected to post a 9.05% CAGR to 2031.
- By functionality, billing and revenue-cycle management captured 34.95% share of the Practice Management System market size in 2025, while telehealth integration is set to rise at a 9.41% CAGR through 2031.
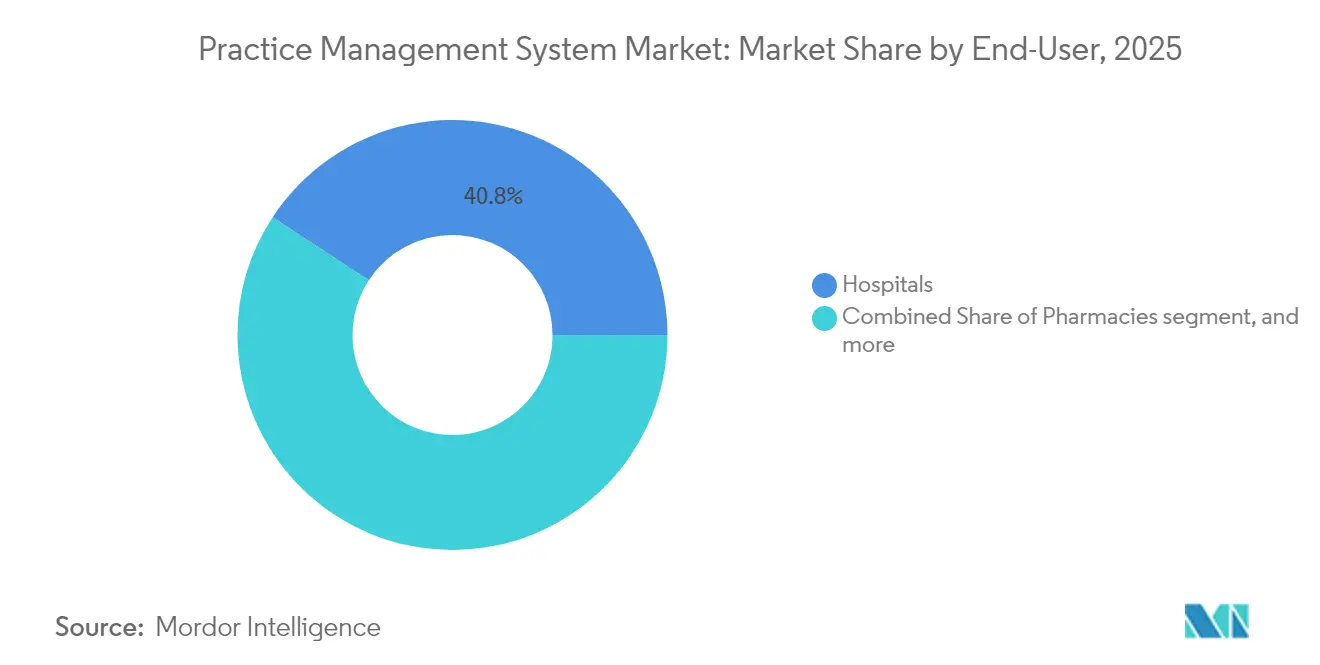
- By end-user, hospitals commanded 40.78% revenue in 2025; pharmacies are projected to register the highest 10.08% CAGR over 2026-2031.
- By practice size, large group practices (>20 physicians) represented 33.12% share in 2025, yet small groups are anticipated to achieve a 10.19% CAGR during the same period.
- By geography, North America held 41.96% of revenue in 2025, whereas Asia-Pacific is expected to advance at a 9.12% CAGR through 2031.
Note: Market size and forecast figures in this report are generated using Mordor Intelligence’s proprietary estimation framework, updated with the latest available data and insights as of 2026.
Global Practice Management System Market Trends and Insights
Drivers Impact Analysis*
| Driver | (~) % Impact on CAGR Forecast | Geographic Relevance | Impact Timeline |
|---|---|---|---|
| Rising demand for operational efficiency | +2.1% | Global, concentrated in North America and Europe | Medium term (2-4 years) |
| Regulatory compliance and incentive programs | +1.8% | North America primary, expanding to Asia-Pacific | Short term (≤ 2 years) |
| Growth of integrated healthcare IT ecosystems | +1.5% | Global, led by developed markets | Long term (≥ 4 years) |
| Expansion of outpatient and ambulatory care | +1.2% | Global, accelerated in Asia-Pacific and Middle East & Africa | Medium term (2-4 years) |
| Transition to value-based care models | +0.9% | North America and Europe | Long term (≥ 4 years) |
| Adoption of artificial intelligence in revenue cycle | +0.6% | North America and Asia-Pacific | Medium term (2-4 years) |
| Source: Mordor Intelligence | |||
Rising Demand for Operational Efficiency
Physician burnout reached 63% in 2024, and administrative turnover surpassed 25%, so practices prioritize automation to protect clinical capacity[1]American Medical Association, “Physician Burnout Benchmark 2025,” ama-assn.org. Modern platforms cut routine workload by 40%, largely through digital check-in, real-time eligibility, and automated prior authorization. Predictive scheduling allows practices to manage higher visit volumes without proportional staffing increases, an advantage as fee-for-service rates flatten even while operating expenses rise. Workforce stress in North America and Europe accelerates platform upgrades because talent shortages prevent manual back-office scaling. Vendors embedding AI for claims scrubbing or smart task routing gain share as practices measure outcomes in hours saved rather than features listed.
Regulatory Compliance and Incentive Programs
The CMS Merit-based Incentive Payment System imposes up to 9% payment adjustments tied to quality scores, so practices adopt systems that can track, validate, and transmit metrics in near real time[2]Centers for Medicare & Medicaid Services, “Quality Payment Program 2025 Final Rule,” cms.gov. Integrated platforms deliver 85% higher scores than disparate tools, translating directly into revenue protection. The 21st Century Cures Act prohibits information blocking and sets tight interoperability deadlines, forcing replacement of legacy software that cannot deliver FHIR-based data exchange. State initiatives such as California’s Advanced Primary Care program layer additional incentives, reinforcing the need for comprehensive workflow coverage. HIPAA security updates further elevate demand for platforms with embedded encryption, audit logs, and multifactor authentication features.
Growth of Integrated Healthcare IT Ecosystems
Seventy-eight percent of health systems listed integration among their top three technology priorities in 2024. FHIR R4 makes it practical to connect practice management, EHR, laboratory, and imaging data, eliminating redundant entry and improving care coordination. Platforms able to sync with Epic’s MyChart create powerful network effects because patients prefer a single portal for appointments, results, and telehealth visits. Bidirectional data flow also underpins value-based reporting, which demands tight linkage between clinical outcomes and cost data. As compliance penalties for information blocking rise, organizations increasingly view comprehensive platform replacement as lower risk than maintaining multiple interfaces that require nonstop updates.
Expansion of Outpatient and Ambulatory Care
Outpatient visits have climbed 15% per year since 2022, shifting revenue toward ambulatory centers modeled for high-throughput, same-day procedures. Ambulatory surgery centers opened 450 new sites in 2024, each requiring procedure catalogs, implant tracking, and post-op follow-up scheduling within the same system. Retail giants such as CVS and Walgreens expand point-of-care services, demanding platforms that can handle thousands of locations yet remain simple enough for frontline staff. Specialty groups in dermatology, orthopedics, and gastroenterology want templates for procedure-specific coding and analytics on case mix. Cloud delivery supports these distributed operations without heavy on-site IT investment, a critical advantage as consumer expectations tilt toward convenience.
Restraints Impact Analysis*
| Restraint | (~) % Impact on CAGR Forecast | Geographic Relevance | Impact Timeline |
|---|---|---|---|
| Limited health IT workforce | -1.2% | Global, acute in North America and Europe | Short term (≤ 2 years) |
| High implementation and maintenance costs | -0.8% | Global, especially affecting small practices | Medium term (2-4 years) |
| Interoperability challenges | -0.7% | Global, more pronounced in multi-vendor environments | Medium term (2-4 years) |
| Data security and privacy compliance burden | -0.6% | North America and Europe | Short term (≤ 2 years) |
| Source: Mordor Intelligence | |||
Limited Health IT Workforce
Unfilled health IT vacancies topped 40,000 in the United States during 2024, delaying many go-lives as staff training backlogs grew. Small practices lack dedicated technicians and lean on vendor services, yet 65% of solo physicians report inadequate support for optimization tasks[3]American Academy of Family Physicians, “Solo Practice IT Gaps 2024,” aafp.org. Security expertise is especially scarce while healthcare accounts for 45% more cyber attacks than other sectors, prompting organizations to outsource monitoring to platform providers. Although managed services relieve pressure, they heighten dependency and may erode negotiation leverage over time.
High Implementation and Maintenance Costs
Entry-level deployments start at USD 15,000 per provider, while enterprise rollouts can reach USD 200,000 plus 20% in annual upkeep. For solo practitioners, those figures equal 3-5% of yearly revenue and often require external financing. Hidden expenses arise from data migration, workflow redesign, and productivity dips during switchover, sometimes doubling original budgets. Although cloud subscriptions spread cost over time, they add indefinite commitments that worry practices operating on slim margins. Advanced AI modules for coding or analytics command premium fees that limit adoption despite clear efficiency upside.
*Our forecasts treat driver/restraint impacts as directional, not additive. The impact forecasts reflect baseline growth, mix effects, and variable interactions.
Segment Analysis
By Product Type: Integrated Platforms Anchor Unified Workflows
Integrated solutions held 61.88% revenue in 2025 and are projected to grow at 10.02% CAGR through 2031, reinforcing their status as the core of the Practice Management System market. Practices gravitate toward single-vendor stacks that converge scheduling, billing, and clinical data because silo elimination reduces re-work, lowers interface costs, and improves audit trails. In value-based contracts, seamless data transfer between charting and revenue modules helps physicians reconcile outcome metrics against payment incentives without manual reconciliation. Ecosystem vendors such as Epic exploit patient-portal stickiness; organizations that adopt MyChart within their practice management workflow report 25% higher portal engagement and fewer no-shows.
Stand-alone modules still appeal to high-volume procedural specialties like dermatology or ophthalmology where finely tuned templates and fast charge capture outweigh cross-departmental hand-offs. Some groups intentionally build best-of-breed stacks mixing niche charting tools with enterprise scheduling backbones. FHIR R4 lowers switching friction by standardizing data interchange, allowing specialists to keep high-performance niche applications while feeding required data to parent hospital EHRs. Still, compliance deadlines and cyber concerns push many holdouts toward integrated upgrades, a trend likely to sustain double-digit growth across the Practice Management System market through 2030.


By Component: Services Propel Lifecycle Value
Software dominated with 69.85% share in 2025, but services are accelerating at a 9.28% CAGR as implementations grow more strategic. Conversion from paper or legacy systems necessitates process re-engineering, interface building, and multi-week staff training that few clinics can manage internally. Cloud migration services see particular velocity because 60% of practices have committed to moving core workloads by 2027. Vendors respond with packaged onboarding, analytics tuning, and managed cyber defense, smoothing adoption but expanding recurring fees.
Long-term optimization contracts emphasize KPI monitoring, dashboard customization, and periodic workflow refreshes to reflect regulatory updates. Specialty clinics often purchase coding audits and denial recovery services that promise uplift in net collections. The rebound in service demand means the Practice Management System industry sees margin shift from licenses toward high-touch engagement, a dynamic that will likely widen the gap between full-service vendors and license-only competitors.
By Deployment Mode: Cloud Adoption Becomes Default
Cloud deployments captured 56.02% share in 2025 and hold a 9.05% CAGR lead to 2031, turning subscription delivery into the modal choice for the Practice Management System market. Multisite groups cite superior uptime, automatic upgrades, and real-time analytics visibility as the main draw. Pandemic-era telework showcased the value of browser-based access for both providers and back-office staff. Hospitals with sunk on-premises investment still maintain local servers to meet internal policies, yet even they shift ancillary practices to the vendor cloud for faster support cycles.
Hybrid models emerge for privacy-sensitive specialties; PHI resides in-house while scheduling or patient engagement runs from vendor data centers. Compliance considerations now weigh encryption level and business associate agreements as heavily as feature lists. In response, cloud vendors earn SOC 2, ISO 27001, and HITRUST certifications, giving risk officers the comfort to greenlight off-site hosting.
By Functionality: Revenue Cycle Reigns; Telehealth Surges
Billing and revenue cycle modules retained 34.95% share in 2025 because reimbursement friction remains the biggest threat to practice solvency. AI-assisted coding, automated eligibility, and denial prediction collectively shorten the cash cycle and reduce write-offs. Nevertheless, telehealth integration posted the quickest 9.41% CAGR and will keep expanding as virtual visits ingrain into routine care. Platforms embedding video consultation inside the existing appointment flow outperform stand-alone telehealth apps whose separate login frustrates patients.
Scheduling, once commodity, is undergoing renewal via machine-learning seat planners that predict no-shows and optimize slot sequence to smooth staff workload. Claims management also evolves as payers layer prior authorization on additional services, requiring real-time rules checking. E-prescription remains mandatory but baseline; growth stems from adjacent clinical decision support that surfaces formulary alternatives within the ordering pane, thereby capturing pharmacist collaboration revenue.
By End-user: Hospitals Hold Scale; Pharmacies Accelerate
Hospitals controlled 40.78% of 2025 revenue due to enterprise purchasing power and need to unify multidepartment networks. They negotiate volume discounts and push vendors to integrate with complex EHR master patient indexes. Ambulatory clinics owned by health systems often inherit the parent PMS to keep referral flows visible in one dashboard. Despite dominance, hospital budgets face scrutiny, so add-on modules undergo ROI analysis tied to operating margin targets.
Pharmacies enjoy the fastest 10.08% CAGR outlook through 2031 as chains add immunizations, chronic-care check-ins, and medication therapy management requiring appointment queues and billing to medical benefits. Locations inside retailers demand simple, mobile-first interfaces that front-line technicians can learn quickly. Diagnostic laboratories maintain stable demand for order routing and result delivery, but their cycle is tied to broader outpatient visit growth. Ambulatory surgery centers invest heavily in perioperative scheduling, while behavioral health clinics seek modules that manage group therapy rosters and outcome measures.
By Practice Size: Small Groups Harness Cloud to Level the Field
Large groups above 20 physicians retained 33.12% revenue share in 2025 because scale supports dedicated IT departments and complex system tailoring. Yet small groups of 2-5 physicians register a vibrant 10.19% CAGR as affordability improves and competitive pressure mounts. Cloud subscriptions replace six-figure capital outlays with predictable fees, letting independent practices adopt enterprise-grade automation without hiring engineers. Younger owners choose mobile-friendly dashboards and built-in e-prescription to promote work--life balance, while seasoned clinicians appreciate that automation trims after-hours charting.
Mid-sized groups occupy a strategic middle ground, able to fund robust reporting yet still agile in vendor selection. They often pilot emerging AI modules sooner than large institutions mirrored in the broader Practice Management System market because approval chains are shorter. Solo practitioners increasingly band together into micro-groups to share costs yet preserve clinical autonomy, further swelling small-group demand.
Geography Analysis
North America held 41.96% share in 2025, propelled by federal incentives, private insurance complexity, and a mature vendor ecosystem. CMS requirements, HIPAA security updates, and the 21st Century Cures Act form a regulatory trio that effectively mandates modern practice software. Canadian provinces also bankroll interoperability projects; Ontario’s Digital First initiative subsidizes upgrades and accelerates EHR-PMS integration. High wage inflation intensifies automation ROI, prompting even smaller U.S. clinics to adopt cloud solutions sooner than peers abroad.
Asia-Pacific posts a 9.12% CAGR, the fastest globally. China’s Healthy China 2030 roadmap funds hospital-to-community IT links, while India’s Digital Health Mission sets national data exchange protocols that favor integrated suppliers. Southeast Asia’s private hospital chains expand regionally, standardizing on cloud platforms for cross-border clinics. Australia and South Korea exemplify advanced markets with compulsory e-prescription and telehealth coverage, locking in steady replacement cycles.
Europe records moderate but resilient demand underpinned by GDPR, ePrescription mandates, and public health system modernization. Germany’s Hospital Future Act allocates EUR 4 billion for digital upgrades, including practice management at affiliated outpatient centers. The United Kingdom’s NHS reforms encourage primary-care networks to merge administrative functions and share analytics. Middle East and Africa show early-stage adoption centered in urban private facilities. Gulf Cooperation Council states fund national digitial records, while South Africa’s private groups deploy cloud PMS to serve dispersed rural outreach clinics.

Regulatory Landscape
In the United States, practice management systems increasingly operate within a health IT compliance perimeter shaped by ASTP/ONC certification and CMS reporting requirements. The ONC HTI-1 final rule tightened the certification baseline, with USCDI v3 remaining available in the ONC Health IT Certification Program as of January 1, 2026, and 2026 interoperability updates advancing through ONC processes such as the Standards Version Advancement Process (SVAP). ONC also published the 2026 SVAP standards set in June 2026, including USCDI v6 and updated HL7 FHIR specifications for use by certified health IT developers beginning August 29, 2026. This raises the expectations for data elements and API-based exchange that PMS vendors need to support alongside connected EHR workflows.
CMS program rules further harden expectations for quality reporting and exchange. For the 2026 performance period, CMS maintains specific electronic clinical quality measure submission formats (for example, QRDA III for eligible clinicians), pushing vendors toward standardized measure capture and export tooling. In Europe, providers and vendors operating across member states face a new compliance layer as EU AI Act obligations for high-risk systems enter enforcement timelines in 2026, increasing requirements for risk management, documentation, and human oversight, particularly for PMS workflows that embed AI for revenue cycle, scheduling optimization, or documentation assistance.
Value Chain Analysis
The practice management system value chain begins with core software development and hosting (cloud infrastructure, cybersecurity controls, and compliance engineering), then moves into implementation services such as data migration, configuration, training, and ongoing optimization. Upstream dependencies include standards bodies and frameworks that govern interoperability (for example, HL7 FHIR and USCDI-aligned data models) and security requirements that shape vendor investments in encryption, auditability, and identity controls. Vendors also depend on adjacent healthcare IT partners, including EHR platforms, patient engagement tools, and e-prescribing and eligibility services, to deliver integrated workflows that multi-site providers require.
On the downstream side, distribution and monetization typically run through direct enterprise sales to hospitals and large groups, channel partnerships for ambulatory and specialty practices, and embedded marketplaces that simplify integration-based procurement. Clearinghouses, revenue-cycle service providers, and payer connectivity partners remain central for claims, eligibility, and prior authorization workflows, while interoperability networks and API aggregators reduce the cost of maintaining point-to-point interfaces. Integration complexity across multi-vendor environments, credentialing and onboarding burden during go-lives, and persistent health IT labor shortages are recurring friction points that increase reliance on vendor professional services and managed operations.
Competitive Landscape
Epic Systems, Oracle Cerner, and athenahealth together control roughly 35% of the Practice Management System market, creating moderate concentration. Oracle’s USD 28.3 billion Cerner acquisition in 2022 armed the combined company with deep resources to modernize its ambulatory portfolio and tie it to enterprise resource planning backbones. Epic leverages MyChart to lock in ecosystems; once a hospital standardizes on Epic, affiliated practices often adopt its PMS to avoid interface headaches. Athenahealth counters with cloud-first agility and the 2024 addition of Epocrates decision support, framing a clinical-administrative continuum.
The mid-tier includes NextGen Healthcare, eClinicalWorks, and Greenway Health, each hunting specialty-specific niches. NextGen’s 2024 pact with Microsoft Azure promises AI coding assistance and smoother upgrades. Disruptors such as Olive AI and CareCloud introduce narrow, high-automation modules that plug into existing platforms, appealing to clinics hesitant to rip and replace. Interoperability compliance remains the principal competitive battleground; vendors able to deliver turnkey FHIR pathways and proven security logs win procurement cycles.
Pricing pressure intensifies because smaller clinics weigh subscription fees against volatile reimbursement. Vendors bundle telehealth, patient intake, and clearinghouse services to raise stickiness. Cyber insurance carriers now audit vendor security posture, so certifications like HITRUST and ISO 27001 become marketing weapons. Consolidation will likely continue as large players seek vertical breadth and smaller innovators partner for distribution.
Practice Management System Industry Leaders
Athenahealth
eClinicalWorks
Greenway Health LLC
Allscripts Healthcare Solutions Inc.
General Electric (GE Healthcare)
- *Disclaimer: Major Players sorted in no particular order

Market Opportunities and Future Outlook
Interoperability-driven workflow automation is creating clearer whitespace in prior authorization, quality reporting, and patient intake, where practices want PMS and RCM functions to exchange data without duplicate entry. CMS actions reinforce this direction. In April 2026, CMS released a proposed rule to extend electronic prior authorization requirements to drugs, with an implementation target of October 1, 2027. In parallel, ONC published the 2026 SVAP cycle in June 2026, with voluntary use by certified health IT developers beginning August 29, 2026. ONC approved USCDI v6 and updated HL7 FHIR specifications (including Da Vinci profiles), providing a basis vendors can use to accelerate standards-based ePA, referrals, and data exchange features within practice workflows.
A second opportunity is compliance-ready performance enablement for clinician programs and multi-organization exchange. The MIPS Promoting Interoperability category includes measures tied to enabling bi-directional exchange under TEFCA using certified EHR technology. That linkage supports demand for PMS platforms that integrate tightly with CEHRT, capture required data elements, and produce submission-ready exports such as 2026 QRDA III formats. Vendors that align product roadmaps to these named programs and standards can differentiate through reduced administrative burden (paperless intake, automated data capture, and certified exchange) and through packaged services that help small and mid-sized practices operationalize the new requirements without expanding internal IT headcount.
Recent Industry Developments
- June 2026: athenahealth released more than 80 new AI-native features across its revenue cycle management capabilities. The updates deepen automation in billing workflows and reinforce the shift toward AI-assisted task execution inside core practice operations.
- April 2026: eClinicalWorks announced production support for the CMS Kill the Clipboard initiative to enable paperless patient intake. The step aligns its ambulatory platform with CMS-backed interoperability and data capture efforts, reducing intake friction and improving downstream billing and documentation quality.
- July 2024: Aledade and eClinicalWorks partnered to enhance physician experience through ambient listening technology. The collaboration targets documentation burden reduction and indicates broader integration of ambient tools into mainstream ambulatory platforms used alongside practice management workflows.


Research Methodology Framework and Report Scope
Market Definition and Coverage
This market is measured as the revenue earned from practice management systems used by healthcare practices to run day to day operations such as scheduling, patient intake, billing, claims, and reporting, across deployment types and support services.
Scope exclusions: We exclude general purpose office software and hardware bundles where the practice management application value cannot be reasonably separated.
Segmentation Overview
- By Product Type
- Stand-alone PMS
- Integrated PMS
- By Component
- Software
- Services
- By Deployment Mode
- On-premise
- Cloud-based
- Hybrid
- By Functionality
- Scheduling
- Billing & Revenue-Cycle Management
- Claims Management
- e-Prescription
- Clinical Workflow
- Telehealth Integration
- By End-user
- Hospitals
- Pharmacies
- Diagnostic Laboratories
- Other End-users
- By Practice Size
- Solo
- Small Group (2-5 physicians)
- Mid-size (6-20 physicians)
- Large Group (>20 physicians)
- Geography
- North America
- United States
- Canada
- Mexico
- Europe
- Germany
- United Kingdom
- France
- Italy
- Spain
- Rest of Europe
- Asia-Pacific
- China
- Japan
- India
- Australia
- South Korea
- Rest of Asia-Pacific
- Middle East & Africa
- GCC
- South Africa
- Rest of Middle East & Africa
- South America
- Brazil
- Argentina
- Rest of South America
- North America
Data Sources, Market Sizing, and Validation
Desk Research
Desk work starts by mapping what features and spending lines are typically counted as practice management, then aligning that with how providers actually buy and renew these tools. To ground adoption and demand signals, we referenced public sources such as the US Centers for Medicare and Medicaid Services datasets, the US Office of the National Coordinator for Health IT publications, OECD health statistics, World Bank health expenditure series, and selected peer reviewed health informatics journals.
We also used company filings, investor decks, product literature, and reputable press coverage to understand pricing models (subscription versus license), typical contract terms, and service attach rates. Where needed, we used paid financial subscriptions for company results, news intelligence, patent databases, and an import and export shipment level database to cross check supplier activity and wider IT spend signals. These desk research sources are illustrative and not exhaustive, and we reviewed many other references during data collection, validation, and research clarification.
Primary Interviews and Surveys
Primary work was used to validate what gets counted as practice management versus adjacent clinical systems, and to sense check adoption by practice size and care setting. We spoke with software providers, channel and implementation partners, and end users such as clinic administrators and revenue cycle teams. Inputs were balanced across major regions so the assumptions did not over index toward one health system model.
Distribution of primary research fieldwork respondents
| Company type | Respondent position | Region |
|---|---|---|
| Top tier: 27% | CXOs: 16% | APAC: 50% |
| Mid tier: 57% | Functional/Unit leaders: 24% | EMEA: 31% |
| Smaller Players: 16% | Managers: 60% | Americas: 19% |
Market-Sizing & Forecasting
Sizing is built using a top-down model where provider and clinic volumes are reconstructed from healthcare delivery metrics, then filtered by software penetration and paid seat or site coverage to form the addressable demand pool. Totals are corroborated with selective bottom-up approximations, including sampled vendor revenue disclosures, channel checks on implementation volumes, and ASP times estimated active users, before final adjustments are made.
Key inputs used in the model include the count of ambulatory visits and outpatient procedures, the number of physician offices and multi site clinics, cloud versus on premises mix, average subscription and maintenance pricing progression, and implementation and support service attach rates. Together, these explain volume, adoption, and revenue per practice. For forecasting, scenario analysis is used because policy shifts, reimbursement pressure, and consolidation can change buying cycles. Primary inputs help define realistic ranges for adoption and price growth. Where the bottom-up cross check is incomplete for smaller geographies, we handle gaps using regional ratios based on provider density and health IT spend intensity, and then recheck using interview feedback.
Data Validation & Update Cycle
Outputs are validated through triangulation across independent signals, and large variances are investigated before numbers are finalized. Checks include year over year growth sanity tests, regional share reconciliation against adoption indicators, and price versus volume consistency so the model does not rely on a single strong assumption.
Before sign off, the work is reviewed in steps by another analyst, and re-contacts are triggered when a key assumption moves outside the agreed range (for example, a faster shift to cloud subscriptions or a change in service attach). The report is refreshed annually, and interim updates are made when material events occur. Right before delivery, we run a fresh scan so clients receive an updated view aligned to the latest public signals.
Mordor Intelligence's Practice Management System Market Sizing Compared With Other Published Estimates
Published market sizes for practice management systems often do not align, and the spread is usually explained by what each study counts inside the product scope and which year is treated as the main reference point. Differences also show up when currency timing, inflation treatment in subscription pricing, and assumptions on the speed of cloud shift are handled differently.
The main gap comes from whether adjacent clinical systems and IT hardware are included, and how multi module contracts are split between practice admin and clinical documentation. Some sources also anchor on 2024 and then project forward, which can make the current number look higher compared with a 2026 current-year view.
Benchmark comparison
| Source | Market Size | Gaps in Research Methodology |
|---|---|---|
| Mordor Intelligence | USD 13.81 B (2026) | |
| Industry Research Publisher A | USD 14.45 B (2024) | Uses a 2024 base year and can apply broader revenue capture across bundled offerings, which can pull more adjacent modules into the total and lift the headline value. |
| Industry Research Publisher B | USD 15.70 B (2024) | Can include a wider end-user pool and treat integrated suite revenues as practice management without consistently separating clinical documentation and other neighboring software lines. |
The spread in the table is largely explained by how integrated suite scope is handled and by the choice of base year for the headline number. The main gap comes from excluding EHR-focused modules and hardware pass-through items, a scope treatment applied by Mordor Intelligence so the total stays tied to scheduling, billing, claims, and practice administration revenue that can be tracked and rechecked.


Key Questions Answered in the Report
How large is the Practice Management System market in 2026?
The Practice Management System market size is USD 13.81 billion in 2026 and is projected to reach USD 20.75 billion by 2031 at an 8.48% CAGR.
Which deployment model grows fastest for Practice Management platforms?
Cloud delivery leads growth, holding 56.02% share in 2025 and advancing at a 9.05% CAGR due to scalability and remote access benefits.
What segment commands the highest Practice Management System market share?
Integrated product suites dominate with 61.88% revenue share because they combine scheduling, billing, and reporting in one platform.
Why are small group practices investing rapidly in Practice Management tools?
Small groups face staffing shortages and competition from health systems, so they adopt cloud PMS at a 10.19% CAGR to streamline workflows and enhance patient engagement.
Which region shows the strongest future demand?
Asia-Pacific posts the fastest 9.12% CAGR through 2031, driven by government digitization initiatives in China, India, and Southeast Asia.
What functionality is rising most quickly inside Practice Management platforms?
Telehealth integration records a 9.41% CAGR as virtual visits become a permanent fixture of outpatient care.
Page last updated on:


