Power Amplifier Market Size and Share
Market Overview
| Study Period | 2020 - 2031 |
|---|---|
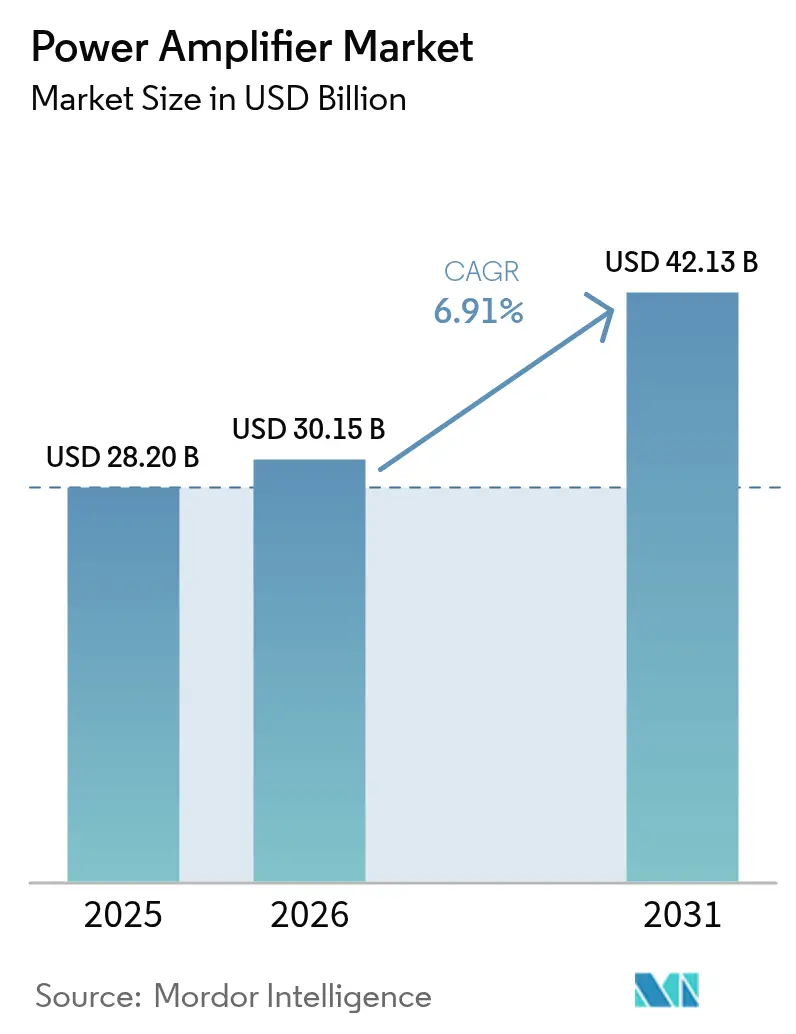
| Market Size (2026) | USD 30.15 Billion |
| Market Size (2031) | USD 42.13 Billion |
| Growth Rate (2026 - 2031) | 6.91% CAGR |
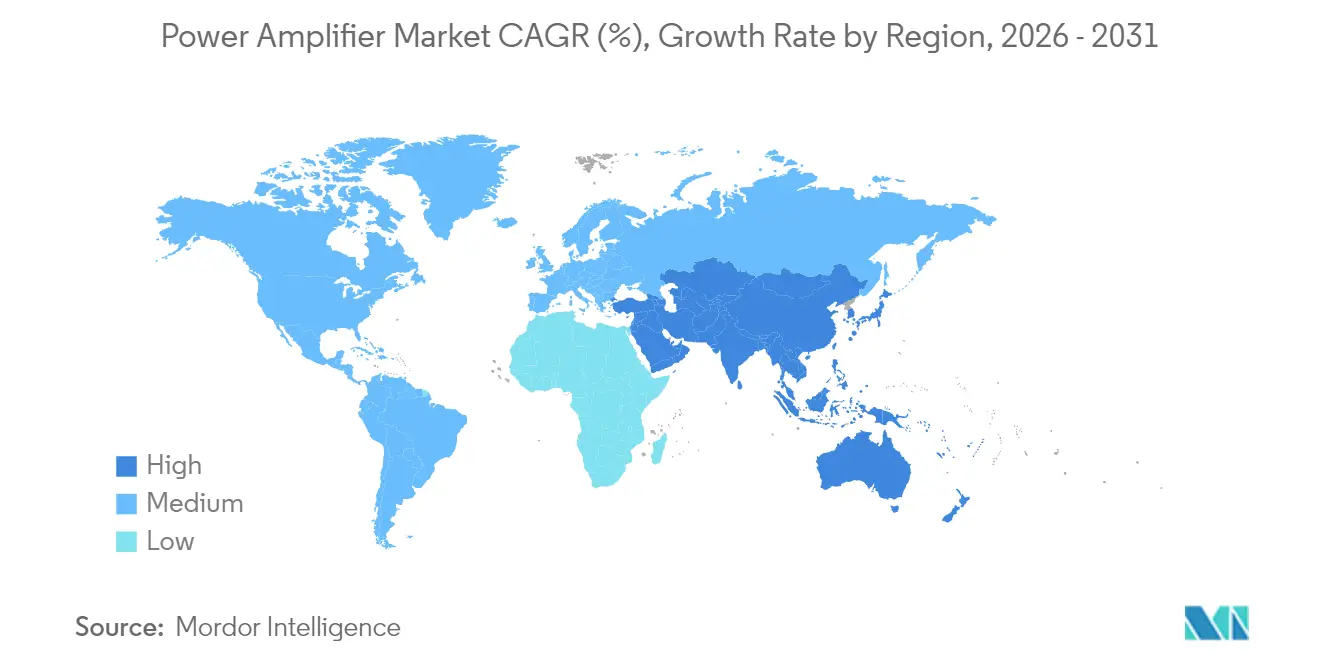
| Fastest Growing Market | Middle East and Africa |
| Largest Market | Asia Pacific |
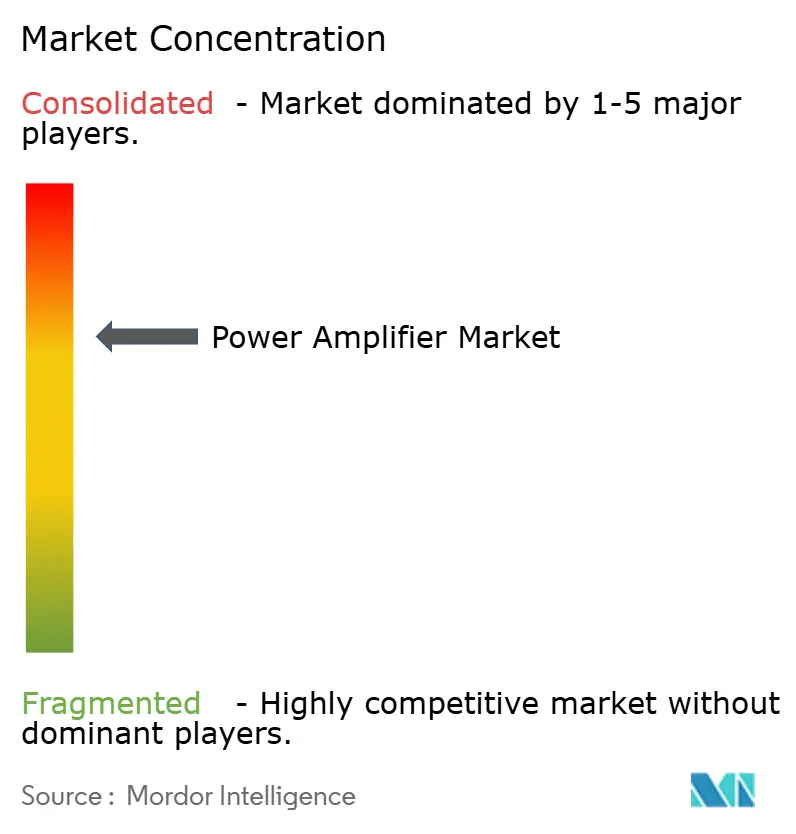
| Market Concentration | Medium |
Major Players
*Disclaimer: Major Players sorted in no particular order Image © Mordor Intelligence. Reuse requires attribution under CC BY 4.0. |
|
Power Amplifier Market Analysis by Mordor Intelligence
The power amplifier market size was valued at USD 28.20 billion in 2025 and estimated to grow from USD 30.15 billion in 2026 to reach USD 42.13 billion by 2031, at a CAGR of 6.91% during the forecast period (2026-2031). Rapid 5G roll-outs, expanding Wi-Fi 6/7 refresh cycles, and growing automotive demand for high-efficiency Class-D audio platforms have underpinned revenue expansion over the past year. GaN devices continued to displace legacy GaAs in macro-cell radios, offering higher power density and reduced energy consumption for operators. Meanwhile, Asia-Pacific kept its cost-leadership advantage in handset power-amplifier back-end assembly, enabling regional vendors to accelerate time-to-market for multi-band RF front ends. Mid-band spectrum (1–6 GHz) remained the performance-price sweet spot for both infrastructure and consumer electronics, yet mmWave amplifiers above 20 GHz recorded the fastest unit growth as satellite broadband and fixed-wireless access scaled in 2024 and early 2025.
Key Report Takeaways
- By geography, Asia-Pacific led with 48.12% revenue share in 2025; the Middle East and Africa are projected to expand at an 11.18% CAGR through 2031.
- By industry vertical, consumer electronics accounted for 37.98% of the power amplifier market share in 2025, while automotive is advancing at 11.86% CAGR to 2031.
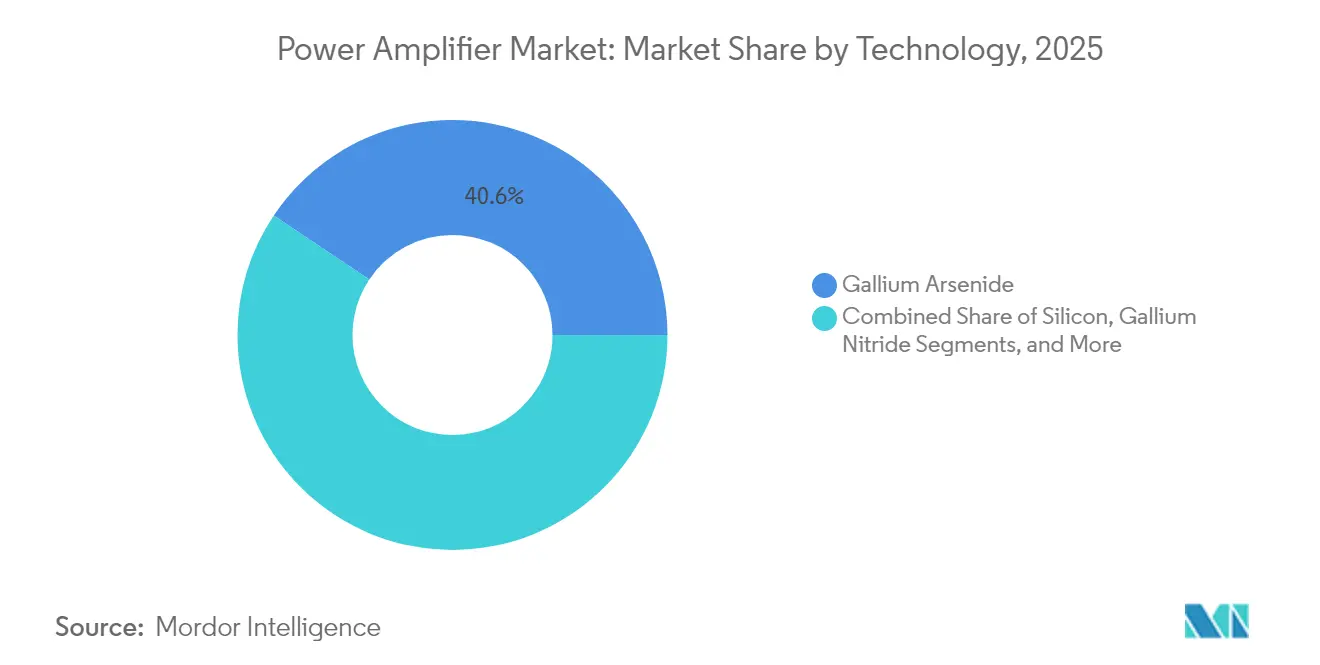
- By technology, GaAs held a 40.62% share in 2025; GaN is forecast to grow at a 16.92% CAGR over 2026-2031.
- By frequency band, 1 – 6 GHz accounted for 45.53% of the power amplifier market share in 2025, while the >20 GHz segment is set to post a 18.54% CAGR through 2031.
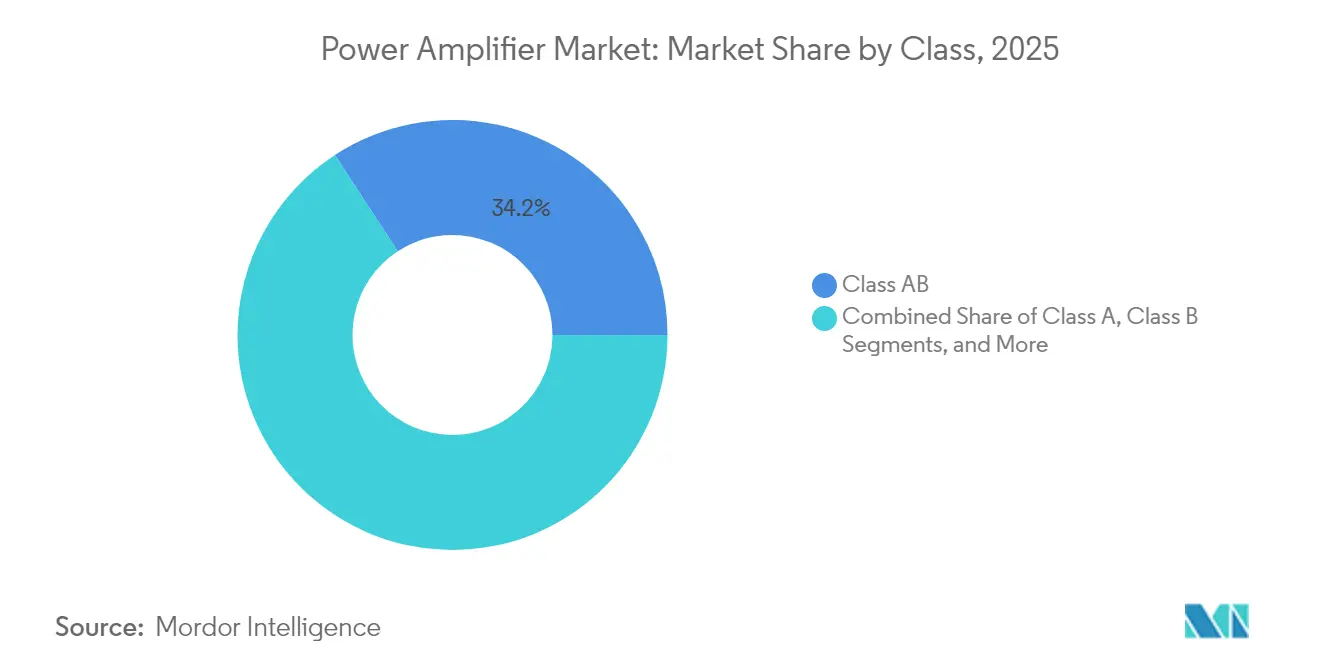
- By class, Class AB commanded 34.21% of the power amplifier market size in 2025; Class D is scaling at 13.49% CAGR.
- By product, RF/microwave amplifiers captured 56.85% revenue in 2025, whereas audio amplifiers are projected to rise at 9.72% CAGR.
Note: Market size and forecast figures in this report are generated using Mordor Intelligence’s proprietary estimation framework, updated with the latest available data and insights as of 2026.
Global Power Amplifier Market Trends and Insights
Drivers Impact Analysis*
| Driver | (~) % Impact on CAGR Forecast | Geographic Relevance | Impact Timeline |
|---|---|---|---|
| GaN PAs in 5G massive-MIMO | +1.8% | East Asia, spillover to North America | Medium term (2-4 years) |
| Wi-Fi 6/7 router refresh | +1.2% | North America, Europe | Short term (≤ 2 years) |
| EV infotainment and ADAS Class-D audio | +0.9% | Europe, North America, China | Medium term (2-4 years) |
| LEO satellite Ku/Ka-band SSPAs | +1.3% | Global, strength in the Middle East and Africa | Long term (≥ 4 years) |
| Smart-factory RF heating | +0.7% | Germany, South Korea, Japan | Medium term (2-4 years) |
| O-RAN multi-vendor architectures | +1.1% | Global | Medium term (2-4 years) |
| Source: Mordor Intelligence | |||
GaN PAs in 5G Massive-MIMO
Typical macro-cell radio units operating from 1.35 GHz to 7.6 GHz reported up to 38% drain efficiency in field deployments during 2024, cutting operating expenditure for carriers.[1]RFHIC Corporation, “RFHIC and MaxLinear Collaborate to Introduce High-Efficiency Power Amplifier Solution for 5G Macrocell Radio Units,” rfhic.com The smaller footprint of GaN die enabled denser antenna panels and simplified thermal layouts, allowing 64-T/64-R arrays to ship in volume for urban densification projects. Regional operators in Japan and South Korea capitalized on the efficiency gains to comply with carbon-reduction roadmaps, reinforcing procurement of GaN front-end modules across 2025 bid cycles. As costs per watt continue to fall, GaN penetration in the power amplifier market should approach parity with GaAs in macro-cells before 2028.
Wi-Fi 6/7 Router Refresh
Home and enterprise access-point vendors accelerated second-generation Wi-Fi 6 and early Wi-Fi 7 launches in 2024, requiring mid-power linear PAs capable of sustaining multi-link operation across 5 GHz and 6 GHz. Solutions such as AsiaRF’s AP7988-002 platform integrated a high-power front-end module that extended throughput to 19 Gbps, thereby lifting unit ASPs for RF front ends. In Q1 2025, HPE Aruba Networking released tri-band Wi-Fi 7 access points that improved aggregate capacity by 30%, intensifying demand for premium silicon with tighter EVM and adjacent-channel leakage specifications. This refresh cycle is set to keep the power amplifier market on a robust shipment trajectory through at least 2027.
EV Infotainment and ADAS Adoption of Class-D Audio PAs
Europe’s battery-electric vehicle (BEV) platforms adopted quad-bridge Class-D amplifiers such as STMicroelectronics’ FDA801, which delivers 93% efficiency at 50 W per channel and integrates a low-latency DAC. The devices support both immersive audio and warning-sound synthesis for driver-assistance functions. Tier-1 infotainment suppliers disclosed that moving from Class AB to Class D saved 0.5 kWh per 100 km drive cycle, a material figure given range anxiety. As BEV penetration climbs, automotive design wins are expected to elevate Class-D’s revenue share in the power amplifier market at a significant rate by 2030.
LEO Satellite Constellations Driving Ku/Ka-band SSPAs
Regional operators in the Middle East and Africa continued to invest in hundreds of Ku-band gateways paired with solid-state power amplifiers that offer mean-time-between-failures exceeding 100,000 hours. Gilat’s Endurance line replaced traveling-wave tube amplifiers at several teleport sites, reducing maintenance cost and improving linearity for high-order QAM. In parallel, MACOM began sampling a linearized Q-band GaN MMIC that pushes PAE above 25% at 45 GHz, paving the way for higher-throughput laser-com feeder links. With nearly 5,000 LEO craft launched during 2024-2025, Ku/Ka shipments are poised to anchor double-digit revenue growth in the high-frequency tier of the power amplifier market.
Restraints Impact Analysis*
| Restraint | (~) % Impact on CAGR Forecast | Geographic Relevance | Impact Timeline |
|---|---|---|---|
| GaAs wafer supply constraints | -0.8% | Global, focus on Asia-Pacific | Medium term (2-4 years) |
| EU Eco-Design idle-power caps | -0.6% | European Union | Long term (≥ 4 years) |
| Low-end CMOS PA price erosion | -0.5% | Global, Asia-Pacific | Short term (≤ 2 years) |
| Thermal limits on >28 GHz silicon PAs | -0.7% | Global | Medium term (2-4 years) |
| Source: Mordor Intelligence | |||
GaAs Wafer Supply Constraints Elevating BOM Costs
Gallium availability tightened in late 2024 after export-control measures constrained Chinese refinery output, inflating GaAs epi-wafer pricing by up to 18%. Multilayer RF front-end modules, therefore, faced higher bill-of-materials outlays, pressuring handset OEM margins and encouraging an accelerated pivot toward GaN-on-silicon processes. Finwave Semiconductor signed a foundry pact with GlobalFoundries to commercialize enhancement-mode GaN-on-Si for sub-6 GHz phones, aiming to neutralize GaAs cost volatility. While long-term diversification will damp inflationary risk, short-run sourcing difficulties are trimming the headline CAGR of the power amplifier market by nearly one percentage point.
EU Eco-Design Idle-Power Caps on Audio PAs
Revised Eco-Design directives effective 2024 mandated idle-power draw below 1 W for consumer and commercial audio gear sold in the European Economic Area. Vendors such as Extron updated Class-D network amplifiers with Eco Standby modes that attain 0.5 W quiescent consumption without compromising rapid wake-up. Compliance engineering costs and requalification testing have lengthened product-development cycles, limiting smaller brands’ ability to compete and tempering unit demand in legacy Class AB channels.
*Our forecasts treat driver/restraint impacts as directional, not additive. The impact forecasts reflect baseline growth, mix effects, and variable interactions.
Segment Analysis
By Technology: GaN Disrupts GaAs Dominance
GaAs devices retained a 40.62% revenue position in 2025 on the strength of entrenched 1–6 GHz handset sockets, yet GaN shipments surged on macro-cell roll-outs and Ku-band gateways. GaN’s 16.92% CAGR through 2031 is projected to lift its portion of the power amplifier market size for radio-access infrastructure to almost half by the end of the forecast window. Qorvo documented a 15 °C reduction in junction temperature at identical output power after migrating a 3.5 GHz Doherty stage to GaN-on-SiC, validating cost-of-ownership savings for operators.
Silicon-germanium remained integral to phased-array beamforming cores, whereas bulk CMOS stayed relevant in low-power Bluetooth and Wi-Fi IoT nodes. Research at IMEC on GaN MISHEMT bias stability removed gate-lag barriers that previously capped drain efficiency above 30 GHz, clearing a pathway for GaN proliferation in handset mmWave modules. Emerging GaN-on-diamond substrates promise further thermal headroom, a key enabler for subsequent 6G and X-band radar design-ins.


By Product: RF/Microwave Amplifiers Lead Market Share
RF and microwave categories generated 56.85% of 2025 revenue, anchored by 5G macros, small cells, and satcom earth stations. Filtronic shipped Ku-band GaN MMICs rated at 80 W that outperformed preceding GaAs line-ups by 40% PAE, unlocking more compact array apertures. Audio power amplifiers contributed a smaller but fast-growing slice: proliferation of smart-speakers and multi-driver in-vehicle entertainment lifted shipments, and GaN FETs removed dead-time limitations that constrained silicon MOSFET fidelity in high-power class-D boards.
Industrial and scientific RF generators for plasma and heating also elevated SiC and GaN transistor demand. Texas Instruments expanded its wideband LDMOS pre-driver catalog to service industrial laser and MRI magnet power stages, reinforcing the RF product category’s role as the revenue mainstay of the power amplifier market.
By Frequency Band: Mid-Band Dominates, mmWave Surges
The sub-6 GHz tier controlled 45.53% of 2025 turnover, given ubiquitous LTE and early 5G mid-band allocations. Nevertheless, the >20 GHz bracket is forecast to register a 18.54% CAGR, adding disproportionate value to the power amplifier market share in satellite backhaul and fixed-wireless access. Qorvo’s TGA4548-SM MMIC showed 25% PAE at 18 GHz while delivering 10 W saturated power, marking a step forward for airborne X-band radars. GaN-on-diamond evaluations conducted by academic consortia recorded thermal conductivity near 1,700 W/m·K, twice that of SiC, paving the way for 40 GHz and higher nodes under the 6G agenda.
Below-1 GHz remained vital for NB-IoT asset tracking and utility metering, but revenue upside appeared capped owing to ASP compression. Bands spanning 6–20 GHz gained modest lift from point-to-point microwave links that decongested fiber-scarce rural backbones.
By Class: Class AB Balances Performance and Efficiency
Class AB retained leadership at 34.21% of 2025 sales as its linearity metrics satisfied adjacent-channel leakage masks in cellular handsets. Design wins spanned 700 MHz paging to 5 GHz Wi-Fi router boosters. In contrast, Class D’s 13.49% CAGR is converting automotive and smart-speaker sockets at speed; Extron’s NetPA Ultra amplifier family demonstrated 77% efficiency in a Dante-enabled rack unit, underlining the class’s green credentials.
High-efficiency switch-mode topologies like Class E/F continued to surface in wireless-power transmitters and energy-harvester blocks, but their aggregate revenue remained niche.
By Industry Vertical: Consumer Electronics Leads, Automotive Accelerates
Handsets, tablets, and wearables sustained 37.98% of 2025 turnover, ensuring the consumer-electronics vertical’s primacy in the power amplifier market. Device OEMs incorporated dual-connectivity front-end modules (5G + Wi-Fi 7) that increased RF content per unit by 12% year on year, boosting silicon demand. Skyworks forecasted a 15% jump in 5G attach rates for mid-priced phones, reinforcing its mobile revenue pipeline.
Automotive contributed the fastest growth at 11.86% CAGR, shaped by EV infotainment and radar domain controllers that require multi-die cascade amplifiers with low phase noise. Microchip underscored that premium SUV trims deploy up to 20 audio channels at 50 W each, a material uplift from 2023 figures. Industrial adoption rose alongside Industry 4.0 retrofits that swapped magnetrons for solid-state RF heaters, while telecom operators continued to drive infrastructural volume.
Geography Analysis
Asia-Pacific generated 48.12% of global revenue in 2025, anchored by China’s handset assembly corridors, which consumed more than half of the region’s low-band GaAs die. Korean fabs leveraged vertical integration to ramp 5G RF front ends, while Japanese material suppliers expanded SiC wafer output to mitigate GaN substrate gaps. India’s production-linked incentives for smartphone EMS houses widened domestic demand, creating a nascent yet vibrant cluster of RF test and packaging firms. Over the near term, Asia’s policy emphasis on indigenous compound-semiconductor supply chains is positioned to strengthen regional control over the power amplifier market.
North America ranked second by value. Dominant players such as Qorvo, Broadcom, and Wolfspeed exploited patent portfolios in GaN power density and thermal packaging to capture new defense and 5G O-RAN awards. The Pentagon’s radar-modernization programs adopted X-band GaN tiles, pushing device ASPs significantly above commercial grades. Telecom operators remained central buyers, upgrading mid-band carriers to 64T/64R arrays in dense urban clusters.
Europe’s share centered on Germany and France, where automotive and aerospace manufacturers absorbed high-linearity PAs for in-cabin audio, ADAS, and multi-band sat-comms. The EU Eco-Design idle-power regulation prompted a swift transition toward Class-D, creating a temporary mismatch between legacy inventory and new-build specs. United Kingdom fabs explored GaN-on-diamond epitaxy through public-private consortia to retain competitiveness against Asian peers.
The Middle East and Africa region, though smaller, exhibited the fastest growth at an 11.18% CAGR, fueled by Ka-band teleport expansion and sovereign LEO connectivity programs. National operators in Saudi Arabia and Nigeria earmarked capex for gateways that integrate 40 W Ku-band SSPAs, broadening the addressable slice of the power amplifier market. South America followed with moderate uptake, led by Brazil’s 5G mid-band auctions and state-backed rural broadband.

Competitive Landscape
Five leading vendors, Broadcom, Qorvo, Skyworks Solutions, Murata Manufacturing, and Infineon Technologies, collectively held the majority of the global revenue share in 2024. Their scale advantages stemmed from captive epi-growth, wafer processing, and multi-chip module integration that compressed cost curves. Broadcom extended GaN Doherty PAs into cable infrastructure, while Qorvo deepened GaN-on-SiC capacity through its Richardson, Texas, fab expansion. Skyworks widened participation by aligning with Chinese handset OEM reference designs, countering aggressive low-end CMOS entrants.
White-space disruptors exploited architectural shifts. Falcomm introduced Dual-Drive™ architectures that posted theoretical 78.5% efficiency at 28 GHz, signaling a potential inflection in mmWave design economics. Finwave’s enhancement-mode GaN-on-Si roadmap targeted handset sockets historically dominated by GaAs. At the systems level, open-ran macro-cells opened procurement to specialized PA vendors, eroding incumbent share and intensifying competition on linearity-plus-efficiency benchmarks.
Thermal-management innovation remained a prime battleground. Research consortiums demonstrated GaN-on-diamond junction resistance below 0.25 K mm²/W, enabling 10 W mmWave die within smartphone footprints.[4]Journal of Semiconductors, “GaN-on-Diamond Technology for Next-Generation Power Devices,” springer.com Vendors pairing material advances with digital predistortion ASICs secured premium margins in defense and satellite. Price competition persisted at the low-power Bluetooth tier, with Chinese fabless companies pushing single-band CMOS PAs below USD 0.05 in high volume.
Power Amplifier Industry Leaders
-
Broadcom Inc.
-
Qorvo Inc.
-
Skyworks Solutions Inc.
-
Qualcomm Technologies Inc.
-
Infineon Technologies AG
- *Disclaimer: Major Players sorted in no particular order

Recent Industry Developments
- April 2025: MACOM Technology Solutions displayed a High-Power Opto-Amp™ line delivering 10–50 W for satellite links and a linearized Q-band GaN MMIC PA at SATELLITE 2025.
- April 2025: IMEC identified a stable operating range for GaN MISHEMTs that mitigates positive-bias instability for 5G+/6G RF PAs.
- April 2025: HPE Aruba Networking released tri-band Wi-Fi 7 access points that boost wireless capacity by 30% and rely on upgraded mid-power RF amplifiers.
- March 2025: AsiaRF unveiled the Wi-Fi 7 AP7988-002 platform with an integrated high-power front-end module.


Research Methodology Framework and Report Scope
Market Definitions and Key Coverage
Our study defines the global power amplifier market as all newly manufactured integrated circuits, modules, and discrete devices that raise the power of an electrical, audio, or radio-frequency signal to levels required by speakers, antennas, or power converters, across consumer, industrial, telecom, automotive, and defense end uses.
Scope exclusion: standalone driver ICs designed solely for low-power pre-amplification are outside this review.
Segmentation Overview
-
By Technology
- Silicon (Si)
- Gallium Arsenide (GaAs)
- Gallium Nitride (GaN)
- Silicon Germanium (SiGe)
- Complementary MOS (CMOS)
- Other Technologies
-
By Product
- Audio Power Amplifiers
- RF / Microwave Power Amplifiers
-
By Frequency Band
- < 1 GHz
- 1 – 6 GHz
- 6 – 20 GHz
- > 20 GHz
-
By Class
- Class A
- Class B
- Class AB
- Class D
- Class E/F and Other Classes
-
By Industry Vertical
- Consumer Electronics
- Industrial
- Telecommunications
- Automotive
- Other Industry Verticals
-
By Geography
-
North America
- United States
- Canada
-
South America
- Brazil
- Argentina
- Rest of South America
-
Europe
- Germany
- United Kingdom
- France
- Italy
- Sweden
- Denmark
- Rest of Europe
-
Asia-Pacific
- China
- Japan
- South Korea
- India
- Rest of Asia-Pacific
-
Middle East and Africa
-
Middle East
- Saudi Arabia
- UAE
- Turkey
- Rest of Middle East
-
Africa
- South Africa
- Rest of Africa
-
Middle East
-
North America
Detailed Research Methodology and Data Validation
Primary Research
Mordor analysts interview RF design engineers, handset ODM procurement managers, base-station OEM strategists, and regional distributors across Asia-Pacific, North America, and Europe. These conversations test preliminary volume estimates, clarify GaN adoption timelines, and surface channel mark-ups that desk sources seldom quantify.
Desk Research
We begin by pulling baseline shipment and revenue indicators from publicly available tier-1 sources such as the International Telecommunication Union, GSMA Intelligence, JEITA production statistics, UN Comtrade trade codes 8542/8518, and IEEE Xplore patent abstracts. Government customs data, corporate 10-Ks, and reputable press releases add unit pricing signals that refine average selling prices.
Next, analysts tap paid databases, D & B Hoovers for company financials and Dow Jones Factiva for deal flow, to benchmark vendor revenues and cross-check regional splits. Where telecom infrastructure drives demand, Marklines vehicle output or WSTS semiconductor billings are sampled for downstream correlations. This list is illustrative; many additional secondary sources guide validation.
Market-Sizing & Forecasting
A top-down reconstruction starts with 5G macro-cell, smartphone, automotive, and professional-audio equipment production volumes, which are then multiplied by verified power-amplifier socket counts and blended ASPs. Supplier roll-ups and sampled dealership channel checks serve as bottom-up reasonableness gates before totals are locked. Key variables like 5G base-station deployments, smartphone shipment mix, GaN penetration rate, vehicle infotainment attach rate, and average audio wattage per smart speaker drive our multivariate-regression forecast. Where bottom-up gaps appear, regional ASP medians are imputed from adjacent markets and reconciled in analyst peer review.
Data Validation & Update Cycle
Outputs face three levels of variance screening, after which a senior analyst signs off. Reports refresh each year; interim recalculations trigger if mergers, catastrophic supply shocks, or policy shifts move any driver by more than two standard deviations.
Why Our Power Amplifier Baseline Earns Dependability
Published values for this market often diverge because firms choose different product classes, base years, and ASP inflation paths.
Key gap drivers include varying inclusion of small-signal driver ICs, whether GaN RF front-end modules are rolled into the total, differing smartphone replacement-rate assumptions, and currency conversion dates. Mordor's model fixes scope to power devices >=1 W output, updates exchange rates quarterly, and verifies ASPs through live distributor quotes, which together anchor a balanced midpoint.
Benchmark comparison
| Market Size | Anonymized source | Primary gap driver |
|---|---|---|
| USD 28.20 Bn (2025) | Mordor Intelligence | - |
| USD 40.79 Bn (2025) | Global Consultancy A | Bundles driver ICs and passive front-end modules, inflates ASPs via list prices |
| USD 14.50 Bn (2024) | Industry Data B | Excludes audio amplifiers > 20 W and applies conservative smartphone replacement cycle |
The comparison shows that when scope creep or over-narrow definitions are stripped away, Mordor's disciplined variable selection, quarterly refresh cadence, and dual-path validation provide the most reliable baseline for strategic planning.


Key Questions Answered in the Report
What is the current value of the power amplifier market?
The power amplifier market was valued at USD 30.15 billion in 2026 and is projected to reach USD 42.13 billion by 2031.
Which region holds the largest power amplifier market share?
Asia-Pacific led with 48.12% of global revenue in 2025, driven by robust electronics manufacturing and aggressive 5G deployments.
Why are GaN devices gaining adoption over GaAs?
GaN offers higher power density, improved thermal performance, and better efficiency, helping operators reduce energy costs and shrink radio footprints.
Which industry vertical is expanding fastest within the power amplifier market?
Automotive is growing at a 11.86% CAGR through 2031 due to rising demand for high-efficiency Class-D audio and radar systems in electric vehicles.
How will EU Eco-Design rules impact amplifier vendors?
New idle-power caps below 1 W force redesigns toward more efficient standby modes, increasing engineering complexity but favoring Class-D architectures.
What is the growth outlook for mmWave (>20 GHz) power amplifiers?
MmWave segments are forecast to grow at 18.54% CAGR as LEO satellite constellations and fixed-wireless access drive demand for high-frequency PAs.
Page last updated on:


