
Potting Compound Market Size and Share
Market Overview
| Study Period | 2021 - 2031 |
|---|---|
| Market Size (2026) | USD 34.19 Billion |
| Market Size (2031) | USD 40.12 Billion |
| Growth Rate (2026 - 2031) | 3.25 % |
| Fastest Growing Market | Asia Pacific |
| Largest Market | Asia Pacific |
| Market Concentration | Medium |
Major Players
*Disclaimer: Major Players sorted in no particular order Image © Mordor Intelligence. Reuse requires attribution under CC BY 4.0. |
|
Potting Compound Market Analysis by Mordor Intelligence
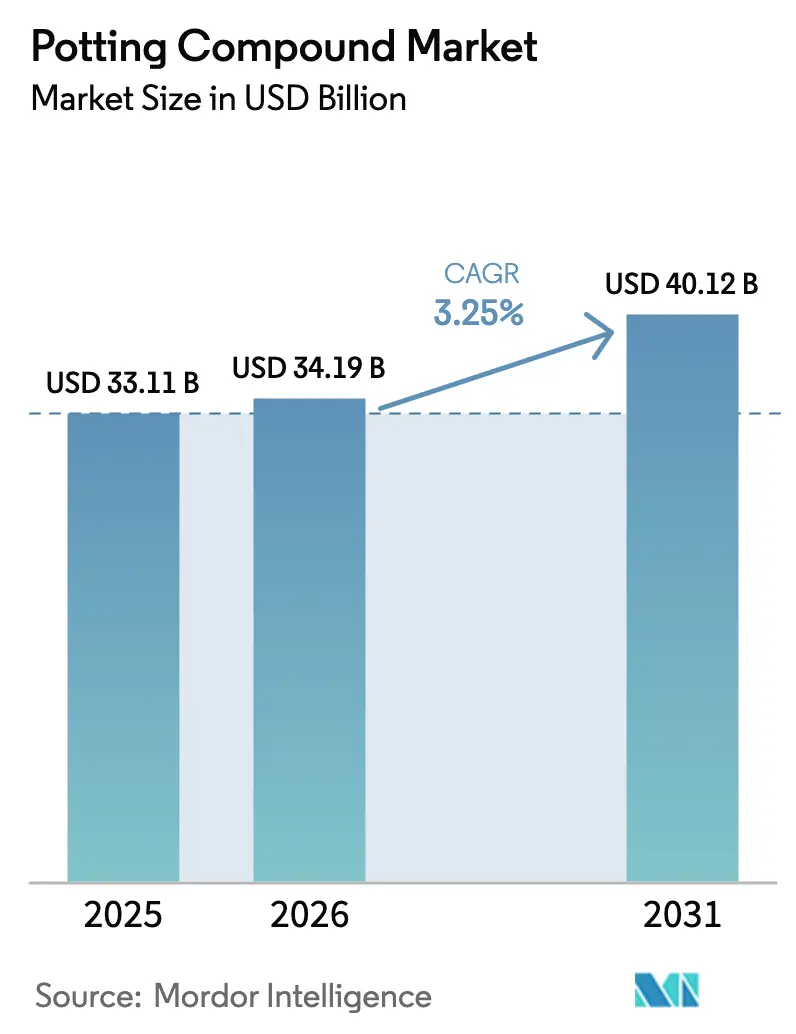
The Potting Compound Market size is expected to grow from USD 33.11 billion in 2025 to USD 34.19 billion in 2026 and is forecast to reach USD 40.12 billion by 2031 at 3.25% CAGR over 2026-2031. Demand tracks the electrification of mobility, the densification of consumer devices, and the expansion of offshore wind farms, all of which impose higher thermal-management and reliability thresholds on encapsulation materials. OEMs are shifting from cost-driven epoxies toward thermally conductive silicone and polyurethane hybrids that dissipate ≥200 W/mK, a change most visible in EV traction inverters and 1,500-volt wind converters. Asia-Pacific drives volume, holding 42.77% of 2025 revenue, as Chinese smartphone assemblers and South Korean semiconductor packagers demand sub-millimeter potting precision. Electronics remains the largest and fastest-growing end-user, benefiting from 5G infrastructure build-outs and edge-computing nodes that favor low-CTE, high-thermal-conductivity chemistries. At the same time, regulators tighten VOC ceilings and REACH-listed substances, accelerating the pivot to water-borne and 100%-solids formulations and rewarding suppliers that invest in low-emission chemistries.
Key Report Takeaways
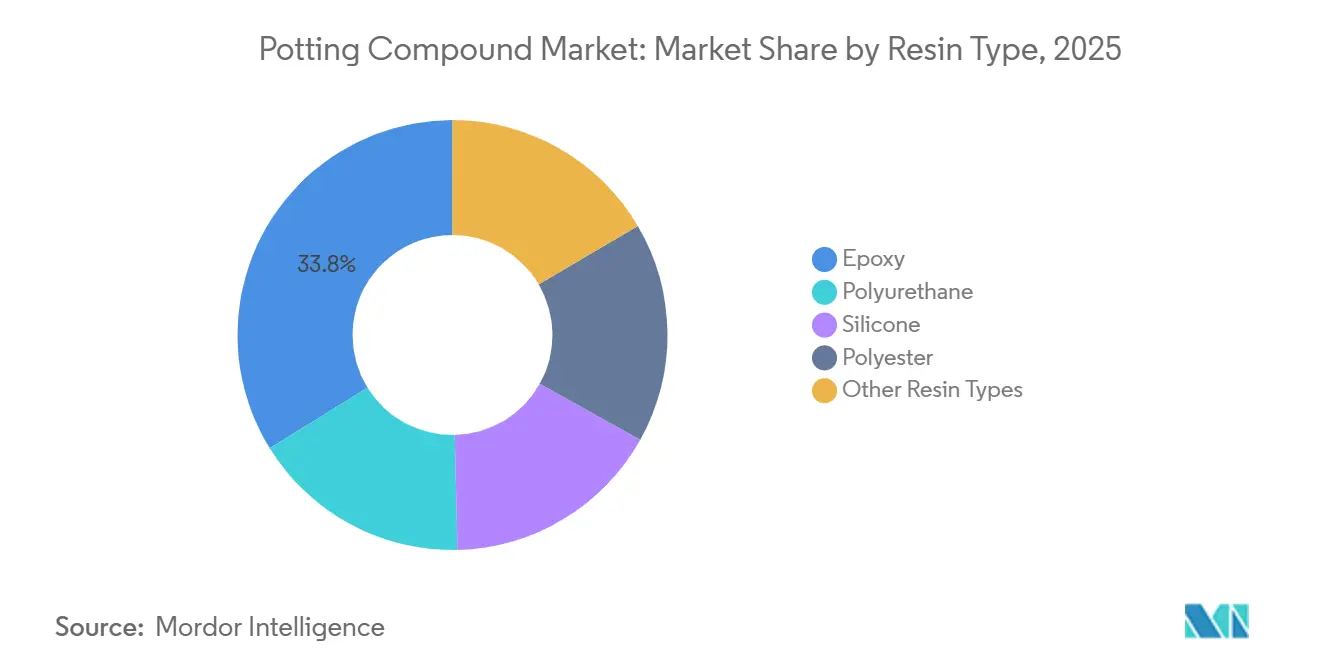
- By resin type, epoxy led with 33.81% revenue share in 2025; silicone is projected to advance at a 4.26% CAGR through 2031.
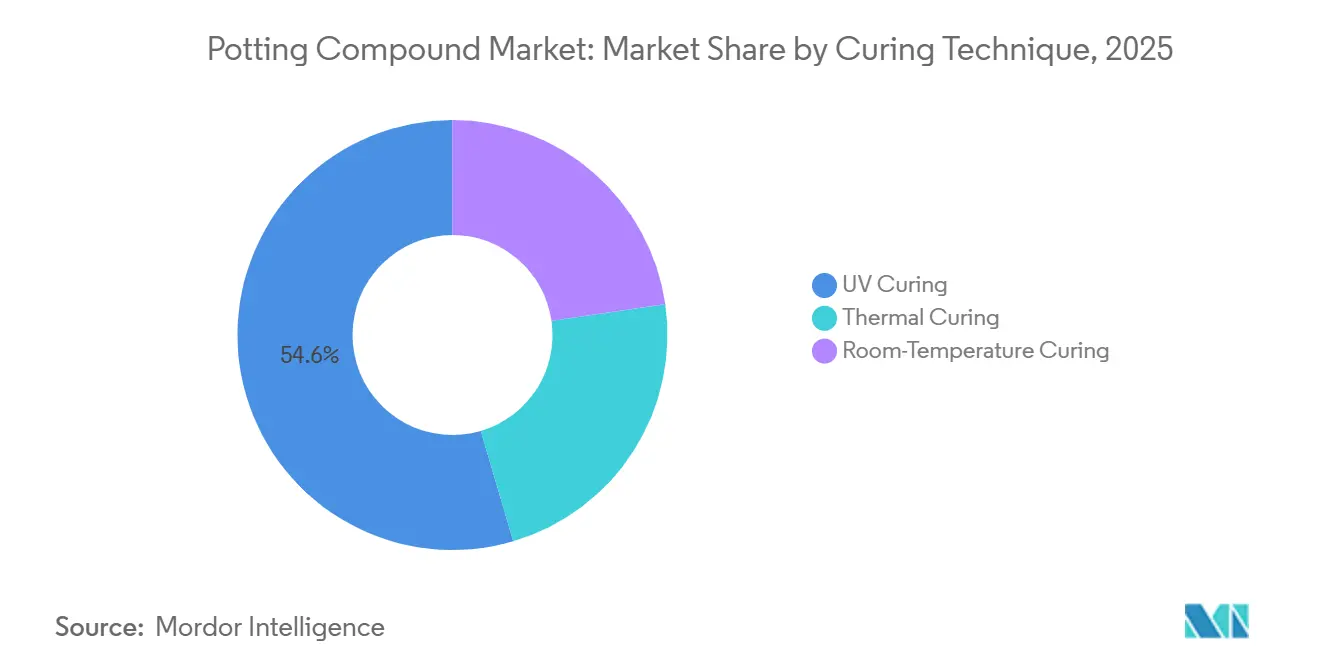
- By curing technique, UV curing held 54.56% share in 2025, while thermal curing records the highest projected CAGR at 4.19% through 2031.
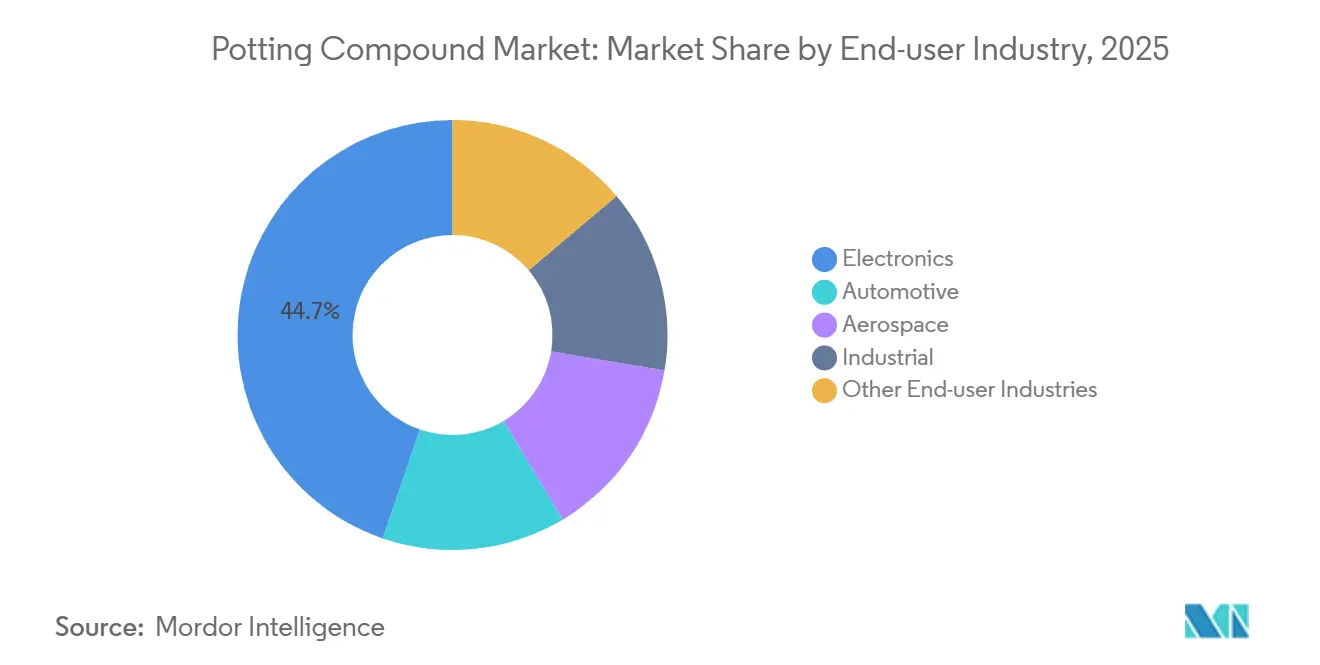
- By end-user industry, electronics accounted for 44.74% share of the potting compound market size in 2025 and is set to grow at a 4.45% CAGR through 2031.
- By geography, Asia-Pacific dominated with 42.77% revenue share in 2025 and is poised to expand at a 3.96% CAGR to 2031.
Note: Market size and forecast figures in this report are generated using Mordor Intelligence’s proprietary estimation framework, updated with the latest available data and insights as of January 2026.
Market Trends and Insights
Drivers Impact Analysis of Potting Compound Market*
| Driver | (~) % Impact on CAGR Forecast | Geographic Relevance | Impact Timeline |
|---|---|---|---|
| Miniaturisation of High-Density Consumer Electronics in Asia | +0.8% | Asia-Pacific core, spillover to North America | Short term (≤ 2 years) |
| Rapid Adoption of Power Electronics in EV Battery Packs | +1.1% | Global, with early gains in China, Europe, North America | Medium term (2-4 years) |
| Aerospace Shift to More-Electric Aircraft Platforms in North America | +0.4% | North America, Europe | Long term (≥ 4 years) |
| Investments in Offshore Wind-Turbine Power Electronics | +0.5% | Europe core, APAC coastal regions | Medium term (2-4 years) |
| Rise of Thermally-Conductive Formulations for SiC Traction Inverters | +0.9% | Global, concentrated in automotive hubs | Medium term (2-4 years) |
| Source: Mordor Intelligence | |||
Miniaturisation of High-Density Consumer Electronics in Asia
Smartphone and wearable brands now engineer cavities below 5 mm³, compelling formulators to deliver sub-100-micron viscosity profiles that fill void-free at room temperature. Samsung’s 2025 foldable hinges embed 47 components in a 12 mm × 8 mm × 3 mm volume, forcing epoxies to cure below 80 °C to avoid flex-PCB warpage. Apple’s A18 chip drives thermal-design-power densities past 15 W/cm², so potting compounds carry more than 60 wt% ceramic filler to channel heat into an aluminum frame. Shenzhen contract manufacturers report cycle-time reductions from 45 minutes to less than 20 minutes after switching to UV-curable acrylate systems, which eliminate oven bottlenecks. IPC-HDBK-830 compliance further mandates ≤0.1% water absorption, protecting moisture-sensitive components in humid climates. As a result, electronics already consume 44.74% of global demand and are on pace to widen that lead through 2031.
Rapid Adoption of Power Electronics in EV Battery Packs
EV manufacturers transition battery housings from passive structures to active thermal-management modules that double as crash-energy absorbers. Tesla’s 4680 cell packs rely on a 3.5 W/m·K polyurethane potting compound to bond cylindrical cells into structural panels, meeting UL 94 V-0 flame rating while shaving vehicle mass. BYD’s Blade Battery employs flame-retardant epoxy compliant with GB 38031 to control thermal-runaway propagation. European OEMs favor silicone potting for 800-volt architectures because dielectric strength remains more than 20 kV/mm after 2,000 thermal cycles from -40 °C to 125 °C. The U.S. DOE funded USD 12 million of R&D into self-healing potting compounds that restore isolation after micro-cracking, targeting 30% warranty-claim cuts. ISO 26262 validation under six-month accelerated aging adds differentiation for large formulators that can finance extensive reliability testing.
Aerospace Shift to More-Electric Aircraft Platforms in North America
Next-generation narrow-body platforms will electrify primary flight controls and environmental systems, embedding potting compounds that withstand pressure cycling to 43,000 feet. Honeywell’s 2025 fly-by-wire controllers replaced silicone with flame-retardant polyurethane, slicing unit weight by 18% while meeting FAA FAR 25.853. Lockheed Martin’s 2024 F-35 avionics upgrade adopted conformal potting that cures to Shore D 75, protecting mission computers from 20 Grms vibration during carrier landings. AFRL funds research into impedance-sensing nanoparticles for predictive maintenance, embedding health monitoring directly into encapsulants. RTCA DO-160G salt-fog and thermal-shock requirements narrow the approved supplier list, concentrating aerospace volume among a handful of certified vendors.
Investments in Offshore Wind-Turbine Power Electronics
15-MW turbines expose nacelle converters to chloride-rich environments and 30-bar pressures. Siemens Gamesa’s SG 14-236 DD installs silicone potting that meets IEC 60068-2-52 salt-mist testing, enabling 25-year maintenance-free service. Orsted traced 9% of legacy fleet downtime to epoxy-potting failures and began retrofitting polyurethane systems offering superior hydrolytic stability. Vestas partnered with Dow in 2026 to infuse graphene, targeting a 40% junction-temperature drop and converter efficiency of 97.8%. The EU earmarked EUR 800 million for subsea converter stations, expanding demand for deep-water-rated encapsulants. DNV-GL certification cycles now span 18 months, elevating the compliance hurdle for market entrants.
Restraints Impact Analysis of Potting Compound Market*
| Restraint | (~) % Impact on CAGR Forecast | Geographic Relevance | Impact Timeline |
|---|---|---|---|
| Volatile Feedstock Pricing (BPA, Epichlorohydrin, Silicone Monomers) | -0.6% | Global, acute in Asia-Pacific and Europe | Short term (≤ 2 years) |
| Stringent Global VOC and REACH Regulations | -0.4% | Europe core, North America, spillover to Asia-Pacific | Medium term (2-4 years) |
| Recycling Challenges for Multi-Component Potting Waste Streams | -0.3% | Global, most acute in Europe and North America | Long term (≥ 4 years) |
| Source: Mordor Intelligence | |||
Volatile Feedstock Pricing (BPA, Epichlorohydrin, Silicone Monomers)
BPA prices in Asia spiked 28% in H1 2025 after a phenol-plant force majeure in Taiwan, and formulators absorbed 60% of the increase to protect automotive contracts. A fire at Solvay’s Belgian unit halved European epichlorohydrin supply, doubling prices to EUR 2,400/ton. Chinese export limits on metallurgical silicon trimmed global dimethyldichlorosilane availability by 12%, stretching silicone lead times to 12 weeks. Huntsman reported a 180-basis-point margin erosion in Q3 2025, prompting reformulation toward lower-cost polyurethane. Three European SMEs exited the market in 2025, consolidating share among larger players.
Stringent Global VOC and REACH Regulations
The EU added four epoxy precursors to its SVHC list in 2024, forcing authorization dossiers by 2027 or market exit[1]European Chemicals Agency, “REACH SVHC Updates 2024,” Echa.europa.eu . The U.S. EPA caps VOCs at 420 g/L from January 2026, disqualifying 30% of legacy epoxies. Henkel invested EUR 45 million retrofitting water-borne lines, yet early trials show 20% adhesion loss on polycarbonate, requiring plasma pre-treatment. California’s SCAQMD tightens the limit to 250 g/L, effectively banning solvent-borne products in the Los Angeles basin. Compliance costs weigh heavier on regional formulators, accelerating consolidation.
*Our forecasts treat driver/restraint impacts as directional, not additive. The impact forecasts reflect baseline growth, mix effects, and variable interactions.
Potting Compound Market Segment Analysis
By Resin Type:
Silicone Gains as Thermal Demands IntensifyEpoxy retains 33.81% of 2025 revenue, yet silicone is forecast to be the fastest-growing category, expanding 4.26% annually through 2031, as EV inverters and offshore wind converters demand wide-temperature flexibility and low modulus. Polyurethane sits between the two, valued for impact resistance in automotive sensors and outdoor LED drivers. Polyester retains niche share in low-cost consumer goods, and early bio-based variants aim to satisfy sustainability mandates. Hybrid chemistries - epoxy-silicone blends and UV-curable acrylates - emerge for optically clear LED encapsulation, underscoring the fragmentation of material needs.
Silicone’s rise maps to escalating thermal loads. GE Renewable Energy specifies silicone for its Haliade-X wind turbine, citing elasticity at -60 °C and UV stability across a 25-year duty cycle. Momentive recorded 19% sales growth in 2025 on EV traction-inverter demand. Epoxy faces price pressure as Chinese suppliers cut 2025 list prices by 8%, sacrificing margins to defend volume. Polyurethane adoption accelerates in radar modules where 10-minute pot-life two-part systems meet ISO 16750 requirements. Regulatory headwinds intensify as REACH narrows amine hardener options, lifting raw-material costs 5-10%.



By Curing Technique:
Thermal Systems Gain GroundUV curing dominates with 54.56% of 2025 share on smartphone-scale throughput, curing in less than 30 seconds and slicing Scope 2 emissions by 70% relative to convection ovens. Yet thermal curing is set to grow at 4.19% through 2031 as SiC modules and aerospace electronics demand post-cure stability above 175 °C, unattainable by UV systems. Room-temperature systems linger in field repairs and subsea splices, tolerating long cure cycles where equipment access is limited.
Electronics assembly lines champion UV to match pick-and-place cadence, while Boeing’s D6-82479 mandates a four-hour 150 °C post-cure for flight-control electronics, locking in thermal systems[2]Boeing, “D6-82479 Material Specification,” Boeing.com . Thermal-cure epoxy delivers lap-shear strengths 35% higher than UV acrylate on aluminum, critical for vibration-prone automotive powertrains. Hybrid UV-thermally activated epoxies blur lines, with Electrolube’s 60-second full-cure product capturing applications previously locked to thermal alone. Room-temperature silicone has resurged in offshore wind, enabling on-site encapsulation without portable ovens.
By End-user Industry:
Electronics Leads While Automotive Broadens Thermal RequirementsElectronics accounted for 44.74% share of the potting compound market size in 2025 and is projected to post the fastest 4.45% CAGR through 2031, lifted by 5G base-stations, high-density edge servers, and a surge in AI-enabled consumer devices. Smartphone assemblers demand low-viscosity, UV-curable chemistries that fill cavities smaller than 5 mm³ in cycle times under 30 seconds, while data-center power supplies specify high-thermal-conductivity silicones rated above 4 W/m·K to manage more than 15 W/cm² heat flux. The expanding electronics footprint in Asia-Pacific underpins regional dominance, with Chinese smartphone hubs alone consuming more potting compound than the entire European automotive sector.
Automotive’s share is driven by potting for EV battery packs, traction inverters, and radar modules that require flame-retardant ratings up to UL 94 V-0 and thermal conductivity above 3 W/m·K. Polyurethane and silicone hybrids are favored because they retain dielectric strength after 2,000 thermal cycles between -40 °C and 125 °C, a performance envelope that commodity epoxy cannot match. Aerospace remains a high-margin niche in which qualification cycles span 36 months and materials must pass RTCA DO-160G salt-fog and thermal-shock protocols, limiting the field to a handful of AS9100-certified suppliers. Industrial applications prioritize low cost and rapid availability, keeping commodity epoxies relevant even as regulatory VOC caps tighten.
Geography Analysis
APAC Potting Compound Market
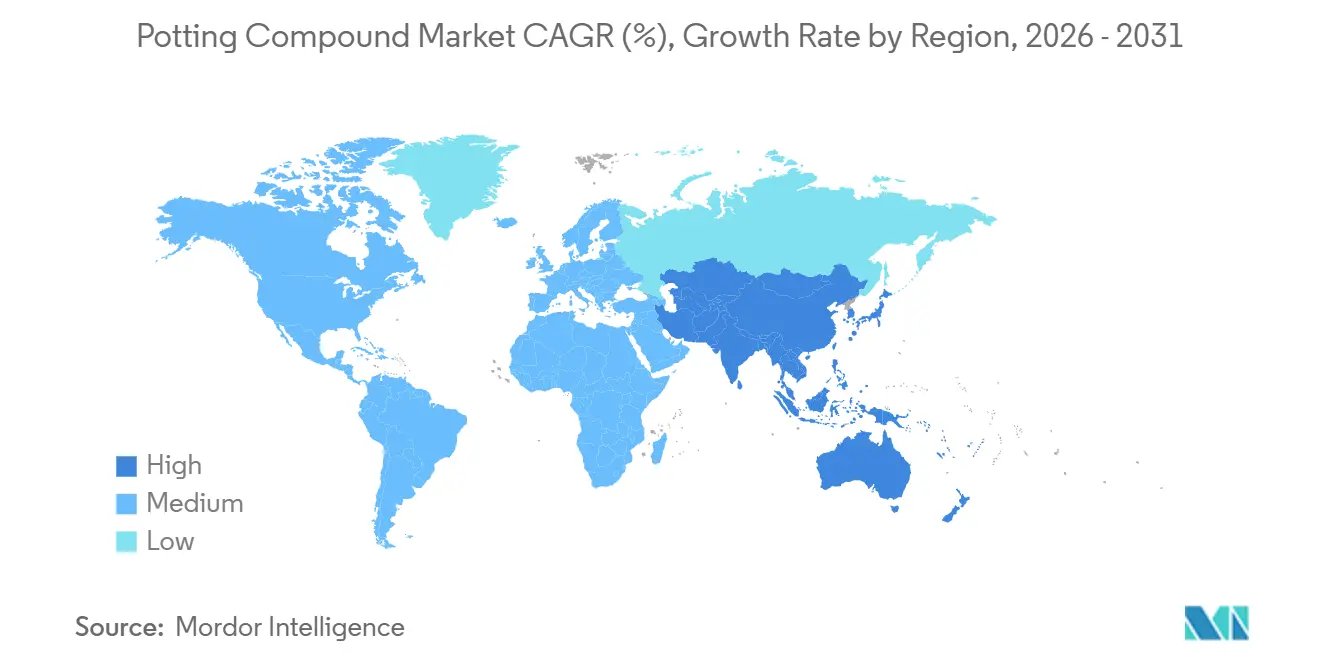
Asia-Pacific captures 42.77% of 2025 revenue, and its 3.96% CAGR keeps the region atop the potting compound market through 2031. China accounts for major regional demand, driven by smartphone and IoT assembly in Guangdong, Jiangsu, and Zhejiang, where annual output tops 2 billion units. Japan’s market is smaller but premium, anchored by Nagase and Resonac silicone lines qualified for hybrid-vehicle inverters. South Korea’s demand is tethered to semiconductor packaging; sub-7 nm nodes consume high-thermal-conductivity epoxy underfills that dissipate 300 W/cm². India accelerates under the Production-Linked Incentive scheme, with Tata Electronics sourcing UV-curable potting domestically since 2025. Vietnam’s imports jumped 41% in 2025 as brands diversify assembly beyond China.
North America Potting Compound Market
North America is also growing amid mature electronics and automotive bases. U.S. consumption rises on CHIPS-funded packaging lines; Intel’s Arizona plant will require 1,200 t/year of potting once fully operational in 2026. Canada’s automotive cluster pivots to bio-based epoxies to trim Scope 3 emissions, while Mexico attracts near-shored EV assemblies served by Henkel’s Querétaro technical center. VOC caps and Proposition 65 labeling elevate compliance costs but also raise entry barriers that favor established players.
Europe Potting Compound Market
Europe's demand is driven by Germany’s EV traction inverters and industrial drives. The U.K. leans on aerospace and defense, with BAE Systems standardizing thermal-cure epoxy in avionics. France’s silicone usage grows via offshore wind and solar inverters, as seen in TotalEnergies’ 1-GW Normandy project. Nordic procurement policies prefer formulations with ≥20% recycled content, accelerating R&D into circular chemistries.
MEA and South America Potting Compound Market
South America and the Middle East and Africa jointly account for a lower market share. Brazil’s automotive electronics and Embraer avionics are sourcing thermal-cure epoxy from overseas suppliers. Saudi Arabia and the UAE spur regional demand through gigawatt-scale solar complexes, specifying silicone potting rated for 65 °C ambient. South Africa leverages potting for smart-meter rollouts in Eskom’s grid upgrade, though local formulation capabilities remain limited.

Regulatory Landscape
Regulation for potting compounds increasingly centers on chemicals management, emissions limits, and hazard communication, tightening formulation choices for epoxies, polyurethanes, and silicones used across electronics, automotive, and industrial applications. In the European Union, REACH actions remain a key constraint: the EU added four epoxy precursors to the SVHC list in 2024, with authorization dossiers required by 2027 or market exit, and a May 2026 amendment to REACH Annex XVII restricts specific organotin compounds (DBT, DOT, MBT, MOT) above concentration thresholds in articles where these additives can appear in sealants and potting-related uses.
In the United States, federal and state rules push portfolios toward lower-emission and better-documented chemistries. The EPA VOC cap of 420 g/L effective January 2026, alongside tighter regional limits such as SCAQMD at 250 g/L in the Los Angeles basin, accelerates water-borne and 100% solids systems for electronics and industrial maintenance. In parallel, TSCA continues to add compliance steps via Significant New Use Rules (SNURs), which require 90-day pre-notification for new uses of covered substances. EU CLP requirements add additional operational burden, as a November 2026 deadline brings new hazard classes into classification and labeling for existing substances, increasing the importance of SDS and labeling updates across global product catalogs.
Value Chain Analysis
The potting compound value chain runs from upstream petrochemical and silicon-based intermediates through compounding and formulation, then into dispensing and final encapsulation at OEM and EMS lines. Key upstream inputs include epoxy resins and hardeners, polyols and isocyanates for polyurethane systems, silicone polymers, acrylic monomers for UV systems, and performance additives such as flame retardants and ceramic or metal fillers used to raise thermal conductivity. Formulators and contract mixers translate these inputs into application-specific products, including two-part, UV-curable, and room-temperature systems, and delivery to end users depends on tight control of viscosity, pot life, and cure profiles. Precision dispensing equipment suppliers often support these requirements.
Bottlenecks frequently stem from dependence on specialized precursors with limited alternative sourcing, along with logistics needs such as temperature-controlled transport and shelf-life management for reactive systems. Recent capacity moves also show regionalization to reduce lead times and shipping risk: Wacker Chemie AG opened a silicone potting compound production line in Charleston, Tennessee (15,000 tons/year) in January 2024, and 3M expanded potting compound manufacturing in Bangalore, India with a USD 45 million investment in September 2024. On the demand-facing side, product qualification and standards, including UL 94 V-0 in automotive and power electronics and long-cycle reliability testing in aerospace and wind, keep switching costs high and increase the role of technical service, application engineering, and in-line process automation in the delivered value.
Competitive Landscape
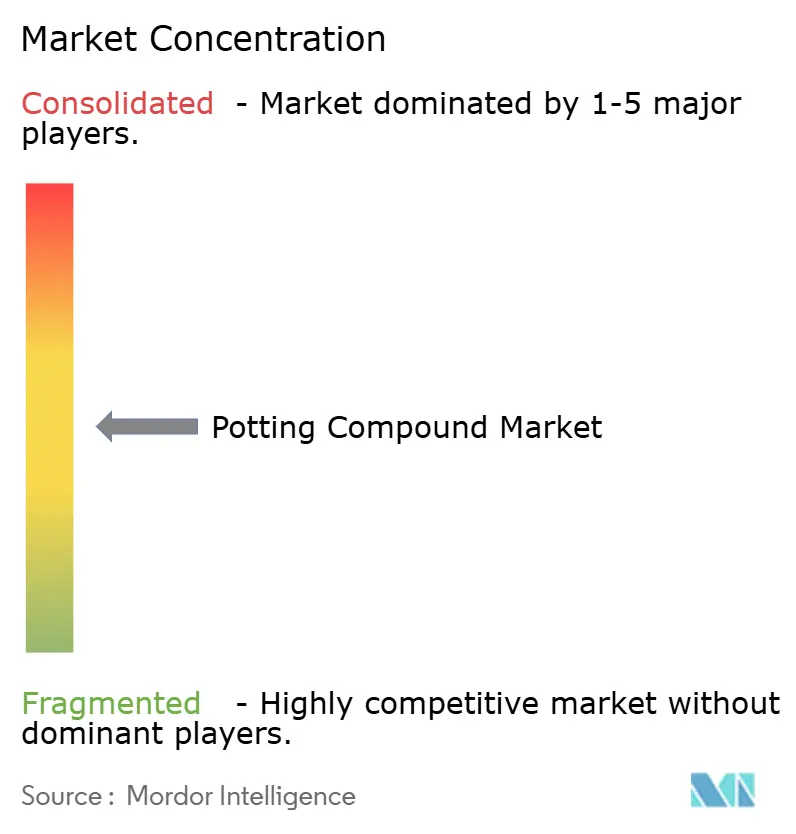
The potting compound market shows moderate concentration: the top five suppliers - 3M, Dow, Henkel, Huntsman, and Momentive - control roughly 38% of installed capacity. Henkel’s 2025 acquisition of Scheugenpflug embeds dispensing robotics into its portfolio, enabling turnkey EV battery-pack lines that cut cycle times 15%. Dow’s 2026 partnership with Siemens Energy co-develops silicone potting optimized for 1,500-volt offshore converters, targeting a 15% boost in thermal-cycling endurance. BASF pilots chemically recyclable polyurethane, addressing upcoming right-to-repair mandates and REACH bisphenol-A restrictions.
Disruptors emerge with graphene and carbon-nanotube fillers surpassing 10 W/m·K thermal conductivity. Parker Hannifin’s Lord unit released an 8.2 W/m·K epoxy qualified by two Tier 1 EV suppliers for SiC inverters. Automation vendors Nordson and Graco reduce material waste 12-18% via precision dispensing, lowering cost per unit and extending pot life through just-in-time mixing. Niche formulators such as Master Bond secure aerospace and medical device projects by customizing chemistries; its NASA-certified EP42HT-2FG commands a 40% premium. Certification regimes - ISO 9001, IATF 16949, AS9100 - remain high hurdles, limiting new entrants and reinforcing supplier stickiness.
Regional specialists exploit localized niches. Nagase and Resonac dominate Japan’s specialty silicone market, while ELANTAS opened a water-borne epoxy line in Shanghai to meet China’s January 2026 VOC limits. Momentive’s 2025 Gujarat plant aligns with India’s PLI incentives, shortening lead times for domestic electronics assemblers. LG Energy Solution and Huntsman formed a joint venture to deliver polyurethane potting for 800-volt battery packs, signalling deeper OEM-supplier integration.
Potting Compound Industry Leaders
-
3M
-
Momentive
-
Henkel AG & Co. KGaA
-
Dow
-
Huntsman International LLC
- *Disclaimer: Major Players sorted in no particular order
Potting Compound Market Companies Covered in this Report
- 3M
- CHT Germany GmbH
- Dow
- Dymax Corporation
- EFI Polymers
- ELANTAS (ALTANA AG)
- Electrolube
- Epic Resins
- H.B. Fuller Company
- Henkel AG & Co. KGaA
- Huntsman International LLC
- Intertronics
- Master Bond Inc.
- MG Chemicals
- Momentive
- Nagase & Co., Ltd.
- Parker Hannifin Corp
- Permabond
- ResinLab LLC
- Resonac Holdings Corporation
- Techsil Ltd
- WEVO-CHEMIE GmbH

Market Opportunities and Future Outlook
Opportunities concentrate where higher power density and reliability requirements create specification pull for high-thermal-conductivity, low-ionic, and low-emission potting chemistries, alongside more localized supply of key inputs. In power electronics and dense data hardware, suppliers are commercializing higher thermal-performance materials to address heat flux and insulation stability. In January 2026, Henkel launched Loctite STYCAST US 8000 A/B, a two-component polyurethane potting compound positioned around ultra-low ionic content (<20 ppm) for reliability in industrial and power electronics, and in May 2026, Dow introduced DOWSIL TC-3120 Thermal Gel (about 12 W/m K) for thermal management in optical modules and dense electronics. These launches point to whitespace in designs where corrosion control (ionic cleanliness), thermal dissipation, and process compatibility (flow and cure control) are required at the same time.
On the supply and cost side, feedstock availability and regional manufacturing footprints create room for players that can secure raw materials and shorten delivery cycles for OEM ramps. Covestro completed a 20% expansion of its Shanghai TDI capacity to 370,000 metric tons in January 2026, supporting polyurethane systems where isocyanate supply can constrain availability. Sika agreed in February 2026 to acquire Akkim, with production sites in Turkey and Romania, to strengthen adhesives and sealants manufacturing and distribution reach in adjacent chemistries that overlap end-use customers for encapsulation materials. In parallel, academic work in 2026 on epoxy thermal-conductivity improvements, including copper-filled and mesogen-containing reactive monomers, reflects an active technology pipeline aimed at raising conductivity without losing processability, aligning with the electronics packaging and EV power module needs already highlighted by the market shift toward higher-performance formulations.
Recent Industry Developments in Potting Compound Market
- May 2026: Dow launched DOWSIL TC-3120 Thermal Gel, a silicone-based thermal interface and encapsulation-adjacent material designed for heat management in dense electronics and optical modules. With reported thermal conductivity around 12 W/m K, it supports designs where higher heat flux and smaller form factors push thermal materials beyond conventional epoxies and standard silicones.
- January 2026: Henkel launched Loctite STYCAST US 8000 A/B, a two-component polyurethane potting compound targeting electrical insulation and mechanical durability in industrial and power electronics. The product positioning around ultra-low ionic content addresses reliability issues such as corrosion and insulation stability under harsh operating conditions.
- May 2024: Henkel introduced new automotive-focused potting compounds under its Loctite portfolio, including Loctite SI 5035 (single-component silicone) and Loctite AA 5832 (dual-cure polyacrylate). The launches broadened material options for protecting automotive electronics against moisture and fluid ingress, supporting higher durability requirements in powertrain and transmission-adjacent environments.


Potting Compound Market Report Scope and Research Methodology
Market Definition and Coverage
For this study, the potting compound market covers materials sold to encapsulate and protect electronic and electrical assemblies, where the compound is poured or dispensed to provide insulation, sealing, vibration damping, and thermal management.
Scope exclusions: Thin conformal coatings, over-molding plastics, and general-purpose structural adhesives are excluded from this market sizing.
Segments Covered in This Report
-
By Resin Type
- Epoxy
- Polyurethane
- Silicone
- Polyester
- Other Resin Types
-
By Curing Technique
- UV Curing
- Thermal Curing
- Room-Temperature Curing
-
By End-user Industry
- Electronics
- Automotive
- Aerospace
- Industrial
- Other End-user Industries
-
By Geography
-
Asia-Pacific
- China
- India
- Japan
- South Korea
- ASEAN Countries
- Rest of Asia-Pacific
-
North America
- United States
- Canada
- Mexico
-
Europe
- Germany
- United Kingdom
- France
- Italy
- NORDIC Countries
- Rest of Europe
-
South America
- Brazil
- Argentina
- Rest of South America
-
Middle-East and Africa
- Saudi Arabia
- South Africa
- Rest of Middle-East and Africa
-
Asia-Pacific
Data Sources, Market Sizing, and Validation
Desk Research
Desk research is used to set the market context and to anchor the model inputs that can be checked against public data. We typically refer to sources such as USITC trade statistics, UN Comtrade, the US Census Bureau, the European Commission trade and industry releases, and national statistics offices in key manufacturing economies, which help validate activity levels around electronics and industrial production.
It is also supported using company annual reports, investor presentations, regulatory filings, and reputable industry association websites, which give directional signals on resin demand, capacity additions, and end-market demand changes. Where needed, a paid subscription for company financials and intelligence, patent databases, and shipment-level import/export records is used to fill gaps in public disclosures and to cross-check patterns by country. The desk sources listed here are illustrative only, and many other public references were reviewed for collection, validation, and clarification.
Primary Interviews and Surveys
Primary work is carried out through expert interviews and structured surveys across formulators, raw material suppliers, distributors, and end users in electronics, automotive, industrial, and energy applications. Respondent input is used to confirm resin mix shifts, typical usage rates per assembly type, and realistic price movement assumptions across regions before finalizing the model outputs.
Distribution of primary research fieldwork respondents
| Company type | Respondent position | Region |
|---|---|---|
| Top tier: 33% | CXOs: 12% | APAC: 48% |
| Mid tier: 47% | Functional/Unit leaders: 31% | EMEA: 32% |
| Smaller Players: 20% | Managers: 57% | Americas: 20% |
Market-Sizing & Forecasting
The sizing model starts with a top-down build where electronics output and industrial production signals are used to reconstruct the addressable demand pool for encapsulated assemblies, which is then translated into potting compound consumption through penetration and loading assumptions. Results are corroborated with selective bottom-up approximations, such as sampled supplier revenue checks, channel feedback on regional volumes, and sanity checks using typical ASP ranges by chemistry.
Key inputs used in the model include the mix of resin chemistries used in potting (epoxy, polyurethane, silicone, and others), the share of automated versus manual dispensing in major end uses, typical compound loading per assembly type, and the pricing spread between standard grades and specialty grades driven by thermal and durability needs. When the data is uneven by country, gaps are handled through proxy indicators like manufacturing output trends, import dependence, and interview-led adjustments on local conversion activity.
Forecasting is done using scenario analysis supported by a simple multivariate regression, where end-market production indices, electronics shipment momentum, and input cost direction are combined with primary feedback on pass-through timing. Assumptions are kept stable across the forecast window unless a clear change is validated. Adjustments are made when multiple interview streams and desk indicators point in the same direction.
Data Validation & Update Cycle
Outputs are validated through triangulation across independent signals, such as end-market production trends, trade flows for related resins and intermediates, and pricing movement patterns shared by interviewees. Variance checks are run at the regional and global levels, and any outliers are reviewed by another analyst before sign-off so the model logic stays consistent.
The study is refreshed on an annual cycle, and interim updates are triggered when material events occur, such as large capacity changes, major regulatory shifts affecting chemical usage, or sharp demand resets in electronics. Before delivery, we perform a fresh pass on the key assumptions and the latest public indicators so clients receive an updated view tied to the same repeatable steps.
Mordor Intelligence's Potting Compound Market Size Measured Against Other Published Estimates
Published market sizes for potting compounds can look far apart, even when they use similar product names, because the scope, unit of measure, and timing assumptions are not always aligned. Differences also come from whether the number is captured at factory gate, whether it blends in adjacent protection materials, and how price progression is treated across regions.
The main gap comes from mixing potting compounds with broader protective materials and from counting internal consumption differently, where Mordor Intelligence keeps the number tied to factory gate sales of potting and encapsulation resins and excludes thin conformal coatings and over-molding plastics from the total. In addition, some published figures use aggressive price uplift across the whole forecast window, while others apply limited validation to resin mix shifts, currency timing, and regional adoption of automated dispensing, which changes the end total.
Benchmark comparison
| Source | Market Size | Gaps in Research Methodology |
|---|---|---|
| Mordor Intelligence | USD 33.11 B (2025) | |
| Global Consultancy A | USD 3.90 B (2025) | Uses a narrower interpretation that appears closer to electronics-focused potting demand, which can undercount industrial and broader electrical applications captured in factory gate sales. |
| Regional Consultancy B | USD 3.74 B (2024) | Different base year and scope treatment, with the model framed around potting process segments and a tighter product scope, which limits comparability versus a global factory gate resin sales view. |
The table shows that the spread is mainly driven by what gets counted as potting material and by whether values reflect a broad factory gate sales pool or a narrower application slice. By keeping assumptions traceable to resin mix, usage intensity, and validated pricing by region, the final market value can be followed and repeated with the same steps in future updates.


Key Questions Answered in the Report
What is the current value of the potting compound market?
The potting compound market is valued at USD 34.19 billion in 2026 and is forecast to reach USD 40.12 billion by 2031.
Which resin type is expected to grow fastest?
Silicone is projected to expand at a 4.26% CAGR through 2031 as thermal-management demands intensify.
Why is UV curing so prevalent in electronics manufacturing?
UV curing offers sub-30-second cycle times and lower energy use, aligning with high-volume smartphone and IoT assembly lines.
Which region holds the largest share of demand?
Asia-Pacific leads with 42.77% of global revenue in 2025, driven by China’s electronics output and South Korea’s semiconductor packaging.
Page last updated on:


 Your data is secure and never sold or shared.


