
Polyether Polyol Market Size and Share
Market Overview
| Study Period | 2020 - 2031 |
|---|---|
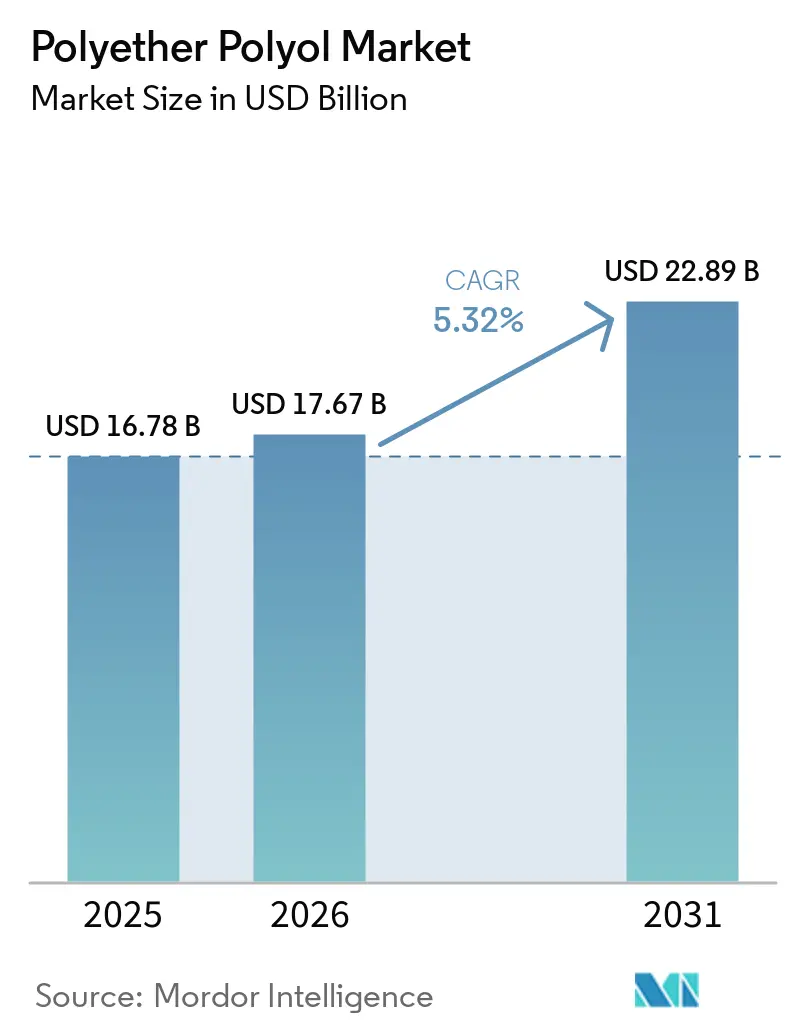
| Market Size (2026) | USD 17.67 Billion |
| Market Size (2031) | USD 22.89 Billion |
| Growth Rate (2026 - 2031) | 5.32 % |
| Fastest Growing Market | Middle East and Africa |
| Largest Market | Asia-Pacific |
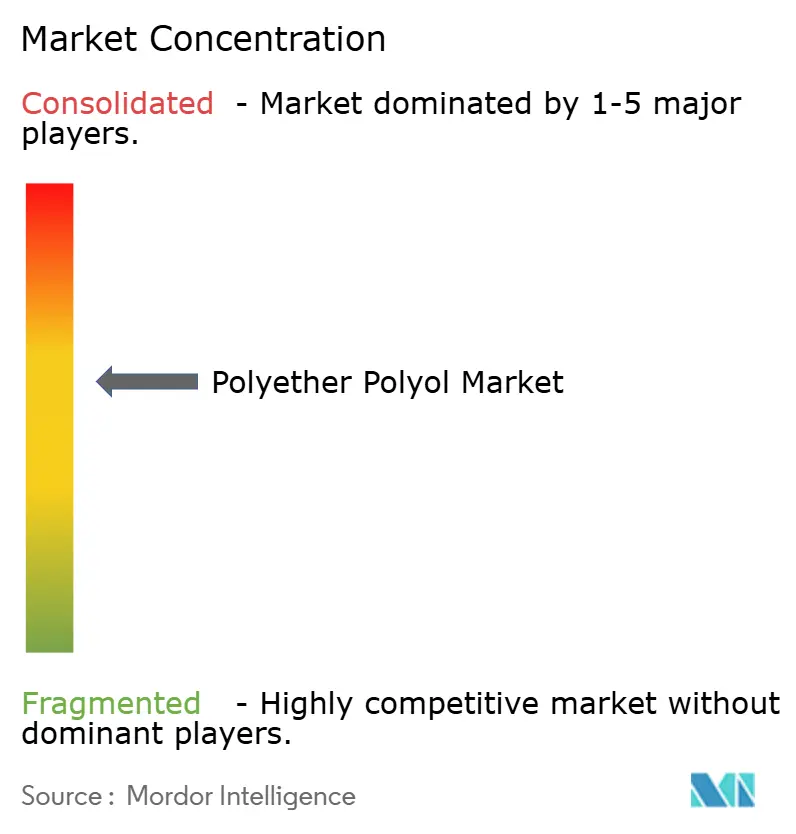
| Market Concentration | Medium |
Major Players *Disclaimer: Major Players sorted in no particular order Image © Mordor Intelligence. Reuse requires attribution under CC BY 4.0. | |
Polyether Polyol Market Analysis by Mordor Intelligence
The Polyether Polyol Market size is expected to grow from USD 16.78 billion in 2025 to USD 17.67 billion in 2026 and is forecast to reach USD 22.89 billion by 2031 at 5.32% CAGR over 2026-2031. Strong insulation demand in new-build and retrofit construction, paired with lightweighting imperatives in electric vehicles, underpins steady volume gains despite raw-material cost volatility. Rigid polyether polyols retained pricing power through 2024 thanks to their superior thermal performance, while flexible grades captured premium margins in furniture, bedding, and automotive seating. Rapid technology adoption—especially CO₂-based synthesis routes—continues to lift the sustainability profile of polyurethane foams, and petrochemical integration strategies in the Middle East are reshaping global supply chains. Competitive intensity has increased as feedstock swings compress margins, prompting capacity rationalization, price announcements, and differentiated product development.
Key Report Takeaways
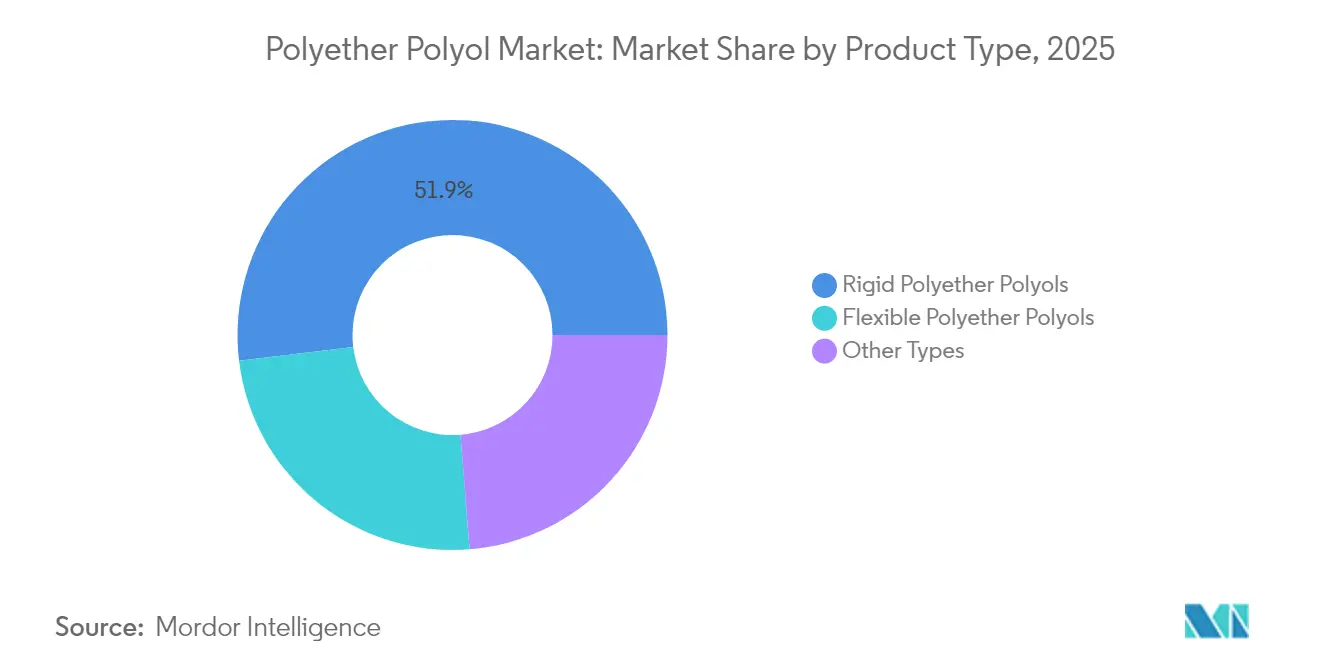
- By product type, rigid polyether polyols held 51.92% revenue share in 2025, whereas flexible polyether polyols are advancing at a 5.74% CAGR to 2031.
- By application, rigid PU foam commanded 45.62% share of the polyether polyol market size in 2025; the CASE (Coatings, Adhesives, Sealants, Elastomers) segment is growing the fastest at 5.98% CAGR through the forecast.
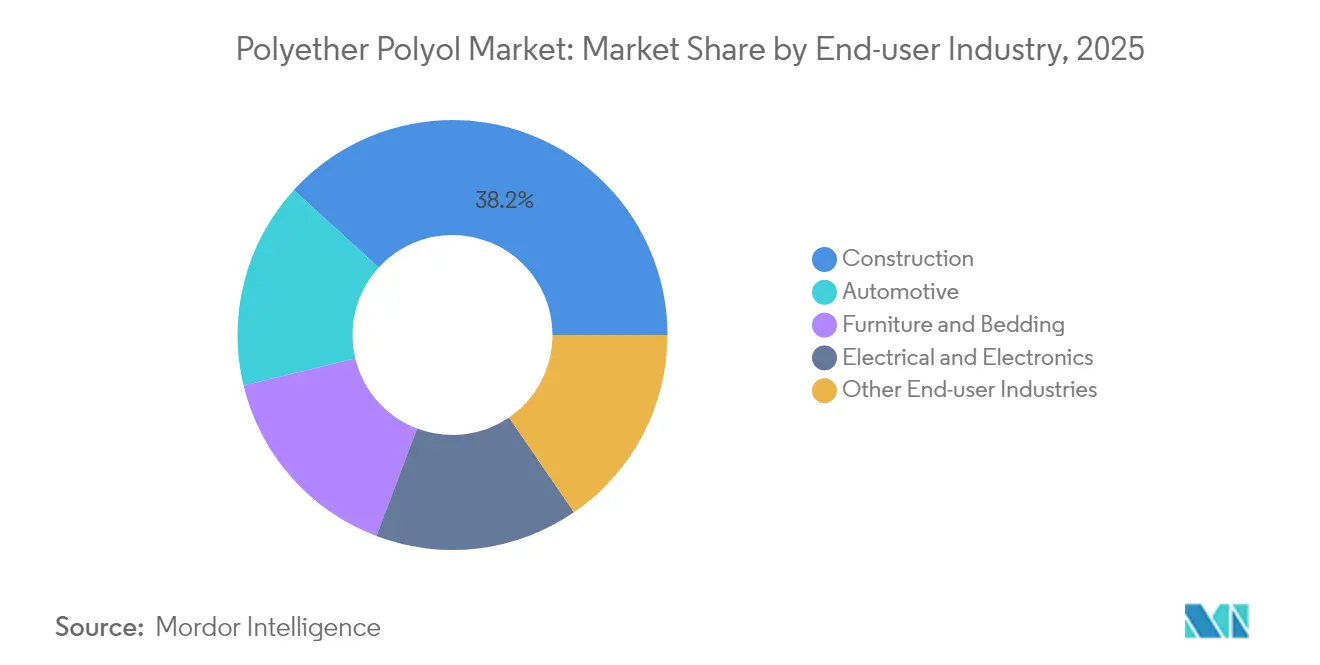
- By end-user industry, construction led with 38.21% share in 2025, while automotive is projected to post the highest CAGR at 6.08% through 2031.
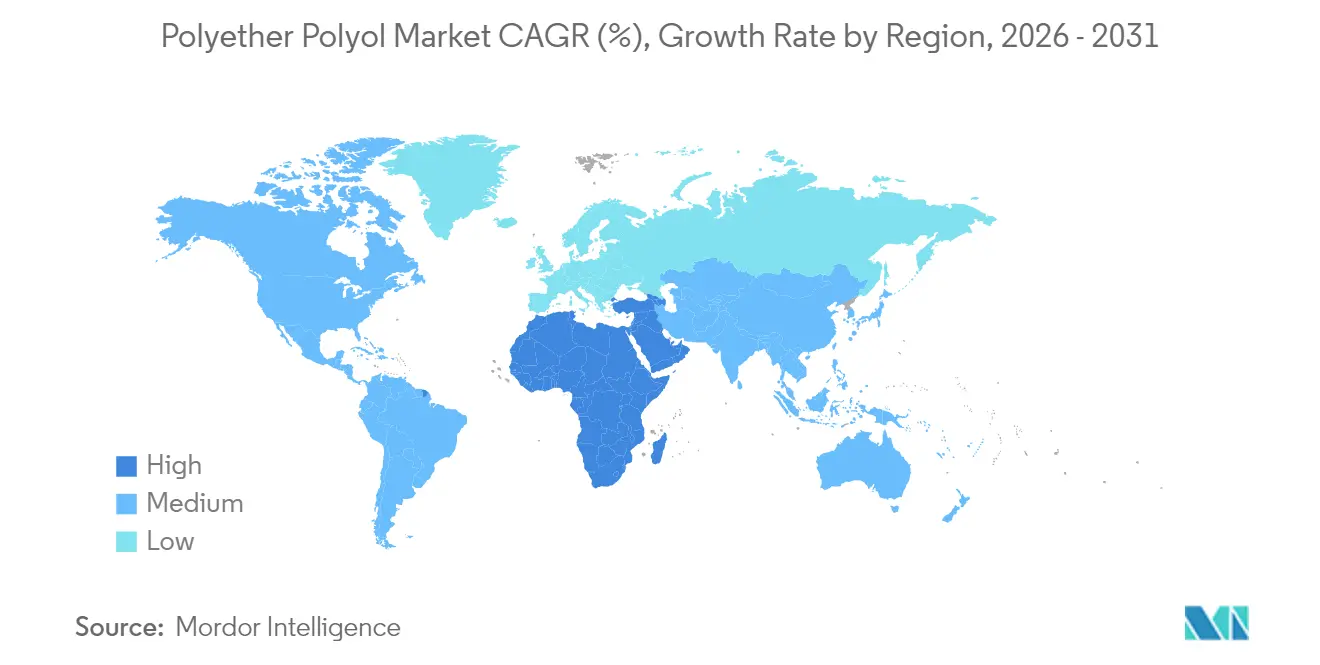
- By geography, Asia-Pacific accounted for 44.05% of 2025 revenues, whereas the Middle-East and Africa is forecast to expand the quickest at 5.69% CAGR to 2031.
Note: Market size and forecast figures in this report are generated using Mordor Intelligence’s proprietary estimation framework, updated with the latest available data and insights as of 2026.
Market Trends and Insights
Drivers Impact Analysis of Polyether Polyol Market*
| Drivers | (~) % Impact on CAGR Forecast | Geographic Relevance | Impact Timeline |
|---|---|---|---|
| Ultra-low emission flexible foams | +0.8% | Global, led by EU and North America | Medium term (2-4 years) |
| CO₂-based polyol decarbonization | +0.7% | EU and North America, rising APAC | Long term (≥ 4 years) |
| Cold-chain build-out in emerging economies | +0.9% | Core APAC, spill-over MEA and South America | Short term (≤ 2 years) |
| Lightweighting in e-mobility interiors | +0.6% | Germany, China, U.S., Japan | Medium term (2-4 years) |
| Renewable-energy insulation demand | +0.5% | Global wind and solar hubs | Long term (≥ 4 years) |
| Source: Mordor Intelligence | |||
Surging Demand for Ultra-Low Emission Flexible Foams
Indoor-air-quality standards in Europe and North America are reshaping polyurethane formulations as regulators tighten VOC limits on construction materials. Producers have migrated from KOH to double-metal-cyanide catalysis to reduce unsaturated by-products, enabling flexible foams to meet stringent emission thresholds without sacrificing comfort or tensile properties. BASF markets several Lupranol grades engineered for these requirements, helping furniture and bedding manufacturers secure green-building certifications[1]BASF, “Polyols,” basf.com. California’s revised HFC restrictions on blowing agents add another compliance layer, strengthening demand for compatible polyether polyols that deliver low-VOC and low-GWP performance in rigid building insulation. Green-label programs such as LEED and WELL increasingly cite emission scores, turning low-emission polyols into a decisive procurement criterion for architectural projects.
Decarbonization Push Favoring CO₂-Based Polyols
Petrochemical incumbents are scaling carbon-utilization technologies that incorporate captured CO₂ into the polyol backbone, thereby lowering scope-3 emissions for downstream foam processors. Commercial polycarbonate polyols demonstrate superior hydrolytic resistance and tensile strength when blended at 10-25% with standard polyether grades, enabling customers to improve mechanical performance while claiming verified CO₂ savings[2]John Sinclair, “Polycarbonate Polyols,” polymerexpert.biz . Covestro has earmarked EUR 100 million for circular-chemistry research and development, including chemical recycling of post-consumer polyurethane foams, signaling intent to close the material loop and differentiate its product slate. Successful adoption could shift raw-material sourcing away from virgin propylene oxide, insulating margins from petrochemical volatility over the long term.
Rapid Cold-Chain Build-Out in Emerging Economies
Stricter food-safety and pharmaceutical-distribution standards are accelerating investments in temperature-controlled logistics across India, Southeast Asia, and the Gulf Cooperation Council. Cold-store builders specify rigid PU panels that require polyether polyols with tight molecular-weight distribution to achieve dimensional stability under extreme thermal cycling. Suppliers that can validate superior k-factor retention and compliance with global pharma guidelines capture premium prices, especially where local production shortens lead times and mitigates customs delays. Mexico’s emergence as a top-four polyurethane consumer illustrates how nearshoring and e-commerce are stimulating demand for high-performance insulation solutions.
Lightweighting Imperatives in E-Mobility Interiors
Battery-electric vehicle OEMs seek every kilogram of weight savings to extend driving range, thrusting high-performance flexible polyether polyols into seat cushioning, NVH dampening, and headliner foams. Formulators have achieved 15-20% density reductions compared with legacy automotive grades while preserving crash-test safety. This performance uplift supports the automotive segment’s projected 6.27% CAGR, with premium e-mobility platforms willing to pay higher polyol premiums in exchange for range gains that directly influence purchase decisions. Related chemistries, including polyetheramine, also serve specialized industrial applications. Huntsman’s 2024-2025 segment earnings show resilience amid vehicle-production variability, underscoring durable demand for weight-optimized chemistry.
Restraints Impact Analysis of Polyether Polyol Market*
| Restraints | (~) % Impact on CAGR Forecast | Geographic Relevance | Impact Timeline |
|---|---|---|---|
| Propylene-oxide price volatility | −1.2% | Global, highest exposure in APAC | Short term (≤ 2 years) |
| Strict HAP caps under U.S. NESHAP 2026 | −0.4% | North America with global spillover | Medium term (2-4 years) |
| Emerging micro-plastics legislation | −0.3% | EU and Korea, expanding worldwide | Long term (≥ 4 years) |
| Source: Mordor Intelligence | |||
Volatile Propylene-Oxide Feedstock Pricing
Quarterly propylene-oxide swings of 15-20% have become routine as energy prices fluctuate and unplanned shutdowns ripple through integrated production chains. Since this monomer represents nearly half of polyether polyol cash costs, margin compression forces producers to announce surcharges or idle high-cost assets. Dow’s decision to close its Argentina polyols unit in October 2024 illustrates how margin pressure accelerates footprint consolidation. Upstream methane-emission rules in the EU further inflate production costs, sharpening competitive gaps between regions with disparate environmental policies.
Strict HAP Emission Caps Under U.S. NESHAP Review 2026
The U.S. EPA is finalizing tighter hazardous-air-pollutant limits that could require multimillion-dollar upgrades to scrubbers, thermal oxidizers, and leak-detection systems at polyurethane facilities. Smaller independent producers face disproportionate compliance costs, nudging the polyether polyol industry toward further consolidation. Capital uncertainty is delaying expansions in the U.S. Gulf Coast while management teams await final rule language, pushing incremental volumes to jurisdictions with lighter regulatory frameworks.
*Our forecasts treat driver/restraint impacts as directional, not additive. The impact forecasts reflect baseline growth, mix effects, and variable interactions.
Polyether Polyol Market Segment Analysis
By Product Type:
Rigid Dominance Drives Infrastructure GrowthRigid grades captured a 51.92% polyether polyol market share in 2025 and remain the backbone of building-envelope insulation, particularly in cold-chain warehouses and zero-energy commercial structures. This leadership is grounded in low thermal-conductivity values and compressive strength that meet evolving energy codes. The segment benefits from policy incentives such as U.S. tax credits for high-efficiency roofs and EU directives calling for deep-renovation targets, safeguarding demand through construction cycles. State-of-the-art rigid formulations integrate halogen-free flame retardants and DMC-initiated polyols to reduce VOCs, broadening their appeal in health-conscious architectural projects. With governments tightening carbon-emission caps, building owners increasingly quantify embodied carbon, which positions CO₂-based rigid polyols as attractive alternatives that embed captured carbon within insulation panels.
Flexible polyether grades, while holding a smaller revenue base, are on track for a 5.74% CAGR fueled by premium furniture, mattress-in-a-box e-commerce, and lightweight vehicle interiors, alongside demand for polyester polyol in related polyurethane applications.Advances in catalyst efficiency have lowered viscosity for easier processing without elevating aldehyde emissions, a key factor for bedding brands marketing low-odor products. Automotive tier suppliers are shifting to MDI-based flexible foams formulated with reactive polyether polyols, achieving density cuts that directly translate to range improvement in EVs.



By Application:
Construction Insulation Leads Market EvolutionRigid PU foam held 45.62% of 2025 demand and anchors steady volume for polyether polyol market size calculations. Building energy-codes mandating higher R-values and the ongoing push for net-zero carbon buildings guarantee a baseline of rigid-foam usage in roof and wall assemblies. Cold-chain facilities often specify higher-density rigid foams to ensure dimensional stability under thermal shock, raising per-square-meter polyol loading relative to residential insulation. Suppliers with on-site pentane pre-blends enjoy a revenue edge because they minimize flammable-liquid handling at customer sites, a logistics convenience prized by panel manufacturers in emerging markets.
The CASE segment (coatings, adhesives, sealants, elastomers) is growing fastest at 5.98% CAGR on the back of infrastructure-maintenance budgets, fleet-vehicle repainting, and bridge-deck joint-seal replacements. Polyether polyols formulated into high-solid polyurethane coatings offer rapid cure, high abrasion resistance, and low VOC profiles, aligning with stricter solvent-reduction mandates. Bridge-deck sealants blending hydrophobic polyether backbones resist freeze-thaw cycling in temperate climates, ensuring long-term adhesion even on weathered concrete.
By End-User Industry:
Construction Sector Anchors Demand StabilityConstruction held 38.21% of 2025 revenues, offering the polyether polyol market a dependable pillar that transcends economic cycles. Governments worldwide deploy green-stimulus packages targeting energy-efficient retrofits, which channel grant funding directly into spray-foam roofs and cavity-wall insulation. Rigid polyether systems with integrated fire retardants and low-VOC signatures remain the default solution for meeting new thermal-performance benchmarks. Over the next decade, skyscraper curtain-wall retrofits and district-cooling network upgrades in the Middle East are expected to secure sustained rigid-foam consumption.
Automotive accounts for a smaller volume base but leads growth at 6.08% CAGR, driven by battery-electric launches that integrate lightweight seat cushions, headliners, and acoustic foams. Polyether polyols optimized for thin-wall molding enable OEMs to shrink part thickness without compromising crash-worthiness, yielding both weight and cost savings. Furniture and bedding continue to source flexible grades focused on comfort and durability, while electrical and electronics demand flame-classified encapsulants and potting compounds.
Geography Analysis
APAC Polyether Polyol Market
Asia-Pacific dominated with 44.05% of 2025 revenue, buoyed by China’s massive construction pipeline and India’s aggressive cold-chain expansion under its National Logistics Policy. Regional producers benefit from scale economies, integrated propylene-oxide assets, and localized supply chains that shorten lead times for downstream foamers.
MEA Polyether Polyol Market
The Middle East and Africa is the fastest-growing bloc at 5.69% CAGR, reflecting petrochemical integration strategies and government-backed giga-projects such as Saudi Arabia’s NEOM and the UAE’s Masdar City. Abundant LPG feedstock and fiscal incentives attracting foreign direct investment underpin regional polyether capacity additions.
North America and Europe Polyether Polyol Market
North America maintains steady volumes from residential reroofing, commercial retrofits, and joint-seal replacements on aging highways. U.S. Inflation Reduction Act tax credits for efficient building envelopes incentivize spray-foam adoption, while Canada’s climate-resilient building codes prioritize higher R-value assemblies. Europe’s market is defined by renovation needs across its aging building stock and strict VOC regulations that favor low-emission polyether grades.
South America Polyether Polyol Market
South America presents a mixed outlook: Brazil’s automotive sector demands flexible polyols, yet construction volumes fluctuate with macroeconomic sentiment and fiscal policy shifts; nonetheless, regional capacity rationalization by multinationals is expected to tighten supply and lift utilization rates through 2028.

Value Chain Analysis
The polyether polyol value chain begins with upstream hydrocarbons that feed propylene and ethylene production, which then supply propylene oxide (PO) and ethylene oxide (EO) as primary intermediates. Polyether polyols are made through oxyalkylation of initiators such as glycerol, sucrose, or sorbitol using catalyst systems (commonly KOH and increasingly DMC) to meet rigid and flexible grade requirements, before being distributed in bulk (tank truck/ISO) to polyurethane formulators and foamers. These converters use the polyols to produce rigid foam, flexible foam, CASE, TPU, and other polyurethane systems.
Integration and location strategy has become more visible through capacity clusters that link feedstocks to PO and polyols. MOL Group inaugurating a EUR 1.3 billion polyol complex in Tiszaújváros, Hungary (around 200,000 tpy) and Longhua New Materials commissioning a 330,000 tpy expansion in China in November 2025, lifting its total capacity to 1.29 million tpy, reflect this direction. Key bottlenecks and cost drivers remain tied to PO availability and price volatility, bulk chemical logistics, and plant reliability, which in turn influence decisions around vertical integration, captive supply, and regional asset rebalancing.
Competitive Landscape
The polyether polyol market exhibits moderate fragmentation: global leaders BASF, Covestro, and Dow leverage integrated propylene-oxide capacity and expansive distribution networks to hold a combined share well above midsized rivals. Sustainability-driven innovation is a focal point: Covestro’s EUR 100 million circular-chemistry program targets commercial CO₂-based polyols and solvent-free recycling routes. Chinese producers, historically positioned on cost, are venturing upstream to secure propylene-oxide via HPPO (hydrogen peroxide to propylene oxide) units, improving environmental footprints and lowering chlorinated coproduct formation.
Polyether Polyol Industry Leaders
Covestro AG
Dow
BASF
Huntsman International LLC
Wanhua
- *Disclaimer: Major Players sorted in no particular order
Polyether Polyol Market Companies Covered in this Report
- Arpadis Benelux NV
- BASF
- China Petrochemical Corporation
- CNOOC
- Covestro AG
- Dow
- Expanded Polymer Systems Private Limited
- Huntsman International LLC
- Manali Petrochemicals Limited.
- Mitsui Chemicals
- MOLGROUP
- PCC Group
- Purinova Sp. z o.o.
- Repsol
- Shell plc
- Solvay
- Stepan Company
- Tosoh Corporation
- Wanhua

Market Opportunities and Future Outlook
Capacity additions and supply-chain integration around propylene-to-PO-to-polyether chains are continuing to open whitespace for suppliers that can pair scale with differentiated grades. Investment activity shows this shift in China, where trial production started in March 2026 for a 240,000 tpy polyether polyol project in Quanzhou, Fujian (Dongda Quanzhou New Materials), and where a May 2026 startup added capacity at Huayi Qinzhou within an integrated HPPO and polyether polyol project in Qinzhou, Guangxi. Environmental approval activity also points to a move up the value chain, with Sinochem Dongda securing approval in July 2026 for an 80,000 tpy high-end specialty polyether polyol project, highlighting demand for specialty polyethers tied to CASE and higher-performance foam needs.
Sustainability-linked product positioning is a practical opportunity area, particularly for customers looking for drop-in solutions that reduce requalification delays. BASF announced first commercial production of biomass balance (BMB) polyether polyols in North America at its Geismar, Louisiana Verbund site in March 2026 (ISCC PLUS-certified), indicating downstream pull from sleep products, automotive, and CASE applications for lower product carbon footprint pathways using mass-balance approaches. Alongside DMC catalysis adoption and the industrialization of CO2-based polyol routes, these developments support premium low-VOC, low-odor, and efficiency-focused portfolios while also reducing sensitivity to propylene-oxide cost swings that increasingly shape procurement and sourcing choices for polyurethane producers.
Recent Industry Developments in Polyether Polyol Market
- June 2026: BASF, Covestro, and Huntsman issued polyol price increase notices in North America amid tight supply conditions, with increases communicated for implementation immediately or as contracts allow. The move reinforced faster price transmission in the region and raised procurement urgency for foamers and CASE formulators managing short lead times.
- March 2026: BASF announced the first commercial production of biomass balance (BMB) polyether polyols in North America at its Geismar, Louisiana Verbund site, certified under ISCC PLUS. This expanded access to mass-balance polyols for sleep products, automotive, and CASE customers seeking lower product carbon footprint options without changing processing equipment.
- December 2024: Dow announced production of VORANOL WK5750, a polyether polyol for soft and hypersoft foams, at its Freeport polyol plant. The product introduction broadened Dow's portfolio for comfort foam applications, supporting differentiation beyond standard flexible polyol grades.


Polyether Polyol Market Report Scope and Research Methodology
Market Definition and Coverage
For this study, the market covers the value of polyether polyols sold for polyurethane production, spanning flexible, rigid, and other polyether polyol grades, and covering major end uses such as foams and other PU systems.
Scope exclusions: We exclude downstream polyurethane finished goods pricing (for example, the value of foam parts or insulated panels) and count only the polyether polyol material value.
Segments Covered in This Report
- By Product Type
- Flexible Polyether Polyols
- Rigid Polyether Polyols
- Other Types
- By Application
- Flexible PU Foam
- Rigid PU Foam
- CASE (Coatings, Adhesives, Sealants, Elastomers)
- Thermoplastic Polyurethanes (TPU)
- Others
- By End-user Industry
- Furniture and Bedding
- Construction
- Automotive
- Electrical and Electronics
- Other End-user Industries
- By Geography
- Asia-Pacific
- China
- India
- Japan
- South Korea
- ASEAN Countries
- Rest of Asia-Pacific
- North America
- United States
- Canada
- Mexico
- Europe
- Germany
- United Kingdom
- France
- Spain
- Italy
- NORDIC Countries
- Rest of Europe
- South America
- Brazil
- Argentina
- Rest of South America
- Middle-East and Africa
- Saudi Arabia
- South Africa
- Rest of Middle-East and Africa
- Asia-Pacific
Data Sources, Market Sizing, and Validation
Desk Research
Desk research was used to map the supply chain, define product boundaries, and build the first set of assumptions for volumes and pricing. We typically referenced public sources such as the US International Trade Commission data, UN Comtrade, the US Geological Survey for feedstock context, the International Energy Agency for insulation and building efficiency indicators, and Eurostat for construction and industrial activity signals that affect polyurethane demand.
On top of that, we reviewed company filings and investor presentations for capacity additions, plant utilization commentary, and regional exposure statements, followed by trade association publications and reputable press releases for new projects and shutdowns. Where needed, a paid subscription covering company financials and another covering shipment-level import and export data were used to sanity-check trade flows and implied price bands. The desk sources listed here are not exhaustive, and we used other public and paid references for data collection, validation, and clarification.
Primary Interviews and Surveys
Primary work focused on interviews and structured surveys with producers, distributors, and large buyers that consume polyether polyols through polyurethane production. We used these discussions to confirm the share of demand across flexible versus rigid systems, to understand how contract pricing and spot pricing were applied, and to check how demand moved by region before finalizing assumptions and totals.
Distribution of primary research fieldwork respondents
| Company type | Respondent position | Region |
|---|---|---|
| Top tier: 27% | CXOs: 17% | APAC: 42% |
| Mid tier: 51% | Functional/Unit leaders: 33% | EMEA: 32% |
| Smaller Players: 22% | Managers: 50% | Americas: 26% |
Market-Sizing & Forecasting
The core sizing logic is built from a top-down demand pool. Polyurethane end-use activity is translated into polyether polyol consumption using penetration and formulation shares, then converted to value using regional price ladders. To keep it practical, the model uses indicators that are observable and explainable, such as rigid insulation demand signals in buildings, furniture and bedding production trends, automotive seating and interior demand, regional construction output, and typical flexible versus rigid mix changes driven by efficiency codes.
Results are then corroborated with selective bottom-up checks, including sampled supplier revenue splits, channel feedback on tonnage movement, and ASP times volume approximations for major consuming regions. These are used to adjust any obvious overstatements or gaps. When direct datapoints were missing for smaller countries, we bridged them using nearby-country pricing, trade linkages, and consistent polyurethane demand proxies rather than forcing overly detailed rollups.
For forecasting, we used scenario analysis supported by a light multivariate regression on the key demand drivers, followed by expert confirmation on expected shifts in rigid foam intensity and pricing pass-through. This approach stays stable even when feedstock volatility distorts short-term pricing, because volume and mix are treated separately from the price curve.
Data Validation & Update Cycle
Triangulation is done by checking whether modeled consumption aligns with independent market signals, including trade balances for polyether polyols and polyurethane feedstock activity, plus capacity additions and operating rate commentary found in public documents. If a region shows an unusual jump, we re-check the drivers, revisit conversion factors, and then re-contact selected interviewees to confirm whether it reflects a one-off event or a structural change.
Before sign-off, the work goes through multiple analyst reviews, including a separate pass for unit consistency, currency timing, and year-on-year variance checks. Reports are refreshed annually, and interim updates are triggered when material events occur, such as major plant outages, new capacity startups, or sharp raw-material price moves. Right before delivery, a final refresh is completed so clients receive the latest updated view.
Mordor Intelligence's Polyether Polyol Market Size Compared Against Other Published Estimates
Published market values for polyether polyols can differ even when the topic name looks the same, because groups define the counted chemical scope, the pricing point in the year, and included applications in their own ways. We also see gaps coming from how firms treat trade flows, how they split flexible versus rigid demand, and how quickly they refresh pricing assumptions.
Trade balances, capacity announcements, and polyurethane end-use activity checks are the evidence that keep Mordor Intelligence tied to a material-level value view (polyether polyol only), rather than blending in broader polyurethane system revenues or downstream finished goods.
Benchmark comparison
| Source | Market Size | Gaps in Research Methodology |
|---|---|---|
| Mordor Intelligence | USD 16.78 B (2025) | |
| Trade Journal A | USD 16.00 B (2025) | This figure appears to use a simplified value statement tied to a narrative outlook, with less clarity on whether prices represent annual averages or a point-in-time benchmark, which can compress the final value in volatile feedstock years. |
| Regional Consultancy B | USD 13.97 B (2024) | The estimate is anchored to a different base year and is often reported alongside shipments, which can shift the implied ASP if product mix, contract timing, or regional conversion factors are not kept consistent across geographies. |
Looking at the spread, the biggest drivers are year selection and how pricing is applied, followed by whether the value is kept strictly at the polyether polyol material level. By keeping scope boundaries clear and re-checking the totals against trade and capacity signals, we get a balanced number that can be re-created and updated with repeatable steps.


Key Questions Answered in the Report
How large is the global polyether polyol sector today and how fast is it growing?
Global demand was valued at USD 17.67 billion in 2026 and is projected to reach USD 22.89 billion by 2031, reflecting a 5.32% CAGR during 2026-2031.
Which application currently uses the most polyether polyol volumes?
Rigid polyurethane foam for building-insulation applications accounts for 45.62% of 2025 global demand, ahead of flexible foams and CASE uses.
What end-user area is expanding the quickest?
Automotive applications are expected to rise at 6.08% CAGR to 2031 as electric-vehicle makers adopt lightweight flexible foams for seating, headliners, and acoustic parts.
Why are CO2-based polyether polyols gaining attention?
They embed captured carbon into the polymer backbone, cut dependence on virgin propylene oxide, and improve hydrolytic resistancedelivering measurable Scope-3 emission savings for converters.
Which region is forecast to see the fastest consumption growth?
The Middle East and Africa is on track for a 5.69% CAGR through 2031, driven by mega-construction projects and new integrated petrochemical capacity.
How are producers addressing propylene-oxide price volatility?
Leading suppliers are passing through surcharges, shutting high-cost assets, and investing in alternative feedstocks such as CO?-based synthesis to stabilize margins.
Page last updated on:


 Your data is secure and never sold or shared.


